Mapping the Outflow from G5.89-0.39 in SiO
Abstract
We have mapped the ultracompact H ii region, G5.89-0.39, and its molecular surroundings with the Submillimeter Array at angular resolution in 1.3 mm continuum, SiO, and eight other molecular lines. We have resolved for the first time the highly energetic molecular outflow in this region. At this resolution, the outflow is definitely bipolar and appears to originate in a 1.3 mm continuum source. The continuum source peaks in the center of the H ii region. The axis of the outflow lines up with a recently discovered O5V star.
1 Introduction
G5.89-0.39 (G5.89) is a shell-like ultracompact (UC) H ii region (Wood & Churchwell, 1989) which was recently found to contain an O5V star via near-IR imaging (Feldt et al., 2003). Acord et al. (1998) have used proper motion measurements of the expansion of G5.89 to determine its distance, kpc, its size, 0.01 pc, and its dynamical age, 600 years. Associated with G5.89 is a molecular outflow (Harvey & Forveille, 1988) with a mass of 77 M☉ and an energy of ergs (Acord et al., 1997, hereafter, AWC). While many UCH ii regions have been observationally associated with molecular outflows (Snell et al., 1990; Shepherd & Churchwell, 1996), the question of whether an UCH ii region can itself be or contain the source of a bipolar outflow remains in dispute. Bipolar outflows are generally understood to be a signpost of ongoing accretion, while the presence of an UCH ii region has been understood by some as a sign that accretion has ceased (Garay & Lizano, 1999). Recent observational and theoretical results have shown that the presence of an UCH ii region does not necessarily shut off accretion (Keto, 2002a, b). But since massive stars and their UCH ii regions tend to form in very crowded fields, high resolution imaging is necessary to associate the origin of any particular bipolar molecular outflow with an UCH ii region, and not a distinct, nearby protostar. This determination is possible with and well suited to the capabilities of the new Submillimeter Array111The Submillimeter Array is a joint project between the Smithsonian Astrophysical Observatory and the Academia Sinica Institute of Astronomy and Astrophysics, and is funded by the Smithsonian Institution and the Academia Sinica. For more on the SMA and its specifications see Ho et al. (2004). (SMA) on Mauna Kea.
We have used the SMA to map the region of G5.89-0.39 in the SiO line, known to trace outflows and this outflow in particular (Codella et al., 1999, AWC). Because of the spectral capabilities of the SMA, we were simultaneously able to map the region in nine spectral lines and broadband continuum. The aim of the project was to improve on the previous resolution map in SiO(5-4) of AWC, and also to detect in dust and molecular lines any other massive protostars in the vicinity which might be sources of the outflow.
2 Observations
G5.89-0.39 was observed with the SMA on the night of 2003 13 July with 160 minutes on source. The pointing center of the observations was . Five antennas were used in the array, giving baselines with projected lengths ranging from 10.2 meters to 116 meters resulting in a synthesized beam. The FWHP of the primary beam was . We observed the quasar NRAO530 for phase calibration every 35 minutes ( degrees from the source, Jy), and the data were self-calibrated for phase correction at 1 minute intervals using the continuum as a model. We observed Mars and Neptune for bandpass and flux calibration respectively. The average system temperature was 180 K. We had 1 GHz (1300 km s-1) spectral coverage in each sideband with 0.8125 MHz (1.1 km s-1) spectral resolution. The resulting noise in the 227 GHz (1.3 mm) continuum map was mJy beam-1 with a bandwidth of 900 MHz. The theoretical noise limit for this map is 1.7 mJy beam-1, so the actual noise level is probably limited by dynamic range. The noise in a single spectral channel map was Jy beam-1, which is only a factor of two worse than the theoretical limit of 0.057 Jy beam-1. We smoothed our data to 3.3 km s-1 resolution for most of the analysis presented below.
3 Results
3.1 SiO Map and Other Lines
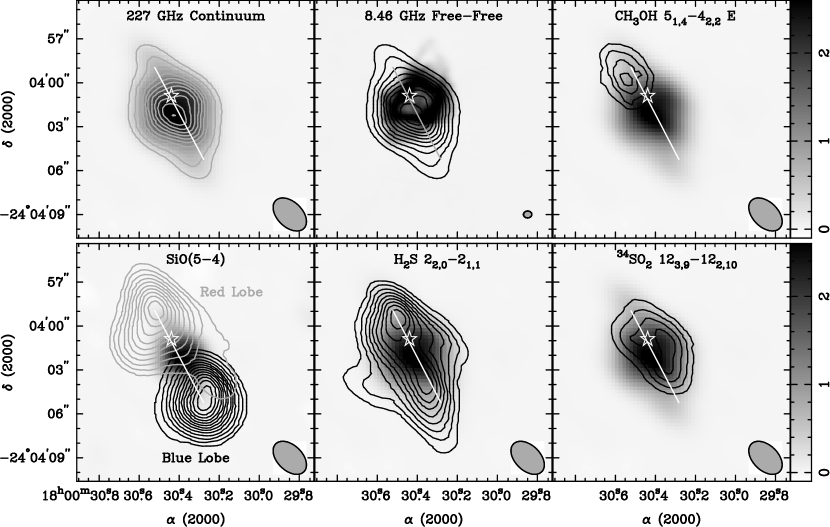
Our map of the integrated SiO(5-4) line emission in Figure 1 clearly resolves and separates the red- and blue-shifted lobes of the outflow. The extent of the SiO(5-4) emission is consistent with the unresolved SiO(5-4) emission of AWC. We detect SiO(5-4) emission which is much stronger and more extended than the SiO of AWC, probably due to excitation effects in the outflow. Figure 1 also shows the location of the O5 star detected by Feldt et al. (2003) and a line connecting the peaks of the outflow lobes. Both lobes are more than two synthesized beams across in the direction perpendicular to the outflow axis. At the peaks of the red- and blue-shifted lobes, the velocity integrated flux in our SiO(5-4) spectra are 256 K km s-1and 306 K km s-1, respectively. Assuming LTE and optically thin emission with a uniform rotation temperature of 100 K, from AWC’s analysis of SiO, CO and NH3, we calculate that the column density of SiO at the peak of the red- and blue-shifted lobes are cm-2 and cm-2 respectively. These are higher than the column densities determined by AWC, probably because we have much higher spatial resolution and are able to avoid beam dilution. The brightest channel in either of the two spectra considered is 16.4 K, in which channel the optical depth would be less than 0.2, so our assumptions in this calculation are self-consistent.
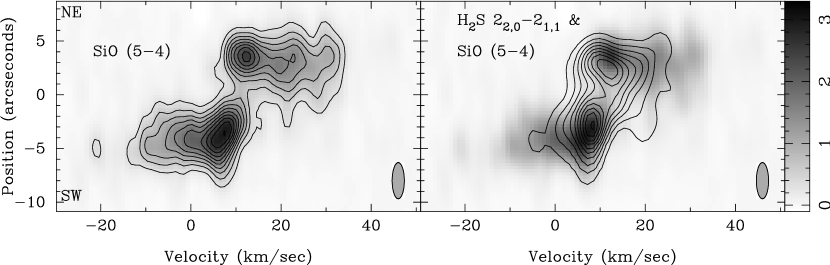
Figure 2 shows a position-velocity (P-V) diagram of the SiO(5-4) emission. The P-V cut goes through the peaks of the SiO(5-4) lobes. There is no obvious dependence of velocity on position within each lobe, as is seen in some bipolar outflows from low- to intermediate-mass young stars (Lada & Fich, 1996; Arce & Goodman, 2001). The peak emission is at low relative velocities, km s-1, and tails off towards higher relative velocities. The SiO(5-4) emission exceeding ranges from = -20 km s-1 to +40 km s-1. Red- and blue-shifted CO(1-0) and HCO+ emission have been detected out to from the UCH ii region (Watson et al., 2002), but the SiO(5-4) emission extends only in either direction along the outflow giving a dynamical time-scale of 1600 years (separation divided by velocity). This number, however, is uncertain, since the line-of-sight velocity is a lower limit on the three dimensional velocity and the projected separation is a lower limit on the three dimensional separation.
In total we detected 9 spectral lines. SiO(5-4), H2S , HCCCN(25-24), SO, and 34SO, all show the outflow to varying degrees. HC13CCN(24-23), HCC13CN(24-23), and CH3OH E, show only marginally resolved emission all at the same location in the Northeast lobe of the outflow and all at the ambient velocity of =10 km s-1. DCN(3-2) was also detected but was difficult to map, probably due to missing flux.
3.2 227 GHz Continuum
The first panel of Figure 1 shows our 227 GHz continuum emission map. 900 MHz of line-free channels from the upper sideband were averaged to obtain the continuum visibilities. The map shows the full extent of the detected 1.3 mm continuum emission. We detect no other 1.3 mm continuum sources anywhere in our field of view down to a detection limit of 60 mJy. The second panel in Figure 1 shows the 8.46 GHz continuum map of Wood & Churchwell (1989) in grayscale overlaid with our 1.3 mm map in contours, and the stellar source of Feldt et al. (2003). The peak in 1.3 mm emission is about removed from the star. The strongest 1.3 mm emission is extended nearly perpendicular to the outflow axis. The faint extensions of the 1.3 mm emission follow the axis of the outflow and are probably emission from dust in the outflowing molecular gas, as has been observed in L1157 (Gueth et al., 2003).
The total flux detected in the 1.3 mm map is 8.8 Jy, integrated over a central square of . Continuum data from 21 cm to 350 m are plotted in Figure 3 showing the SED of this region. Using the distance of 2.0 kpc determined by Acord et al. (1998), we did a least squares fit of a standard free-free spectrum (Gordon, 1988) to the data below 50 GHz. We get an electron temperature of 8000 K, angular diameter of corresponding to a physical size of 6000 AU (0.03 pc), an electron density of cm-3, and an emission measure of pc cm-6. For the dust-dominated, short-wavelength regime, we simply extended the existing “cold-component” fit from Hunter et al. (2000). The sum of the two spectra is the solid line in Figure 3 and fits our data point well. Based on these fits, we predict 5.6 Jy from free-free emission and 3.2 Jy from dust emission. Following Hunter et al. (2000), assuming a dust emissivity of , a dust temperature of 100 K as above, and a total mass to dust mass ratio of (Testi & Sargent, 1998), we calculate a total mass of 83 M☉ associated with the dust emission. If we define the 2 mJy beam-1 contour of the free-free map as a boundary, the 1.3 mm map contains 8.2 Jy of flux inside the boundary and 0.7 Jy outside. Since the flux outside is largely from the extensions which follow the outflow, we estimate the mass of gas associated with the dust in the outflow to be at least 18 M☉. This number is an approximate lower limit since much of outflow overlaps with the UCH ii region, but since the effects of the outflow on abundance are unknown it is not a hard lower limit. The remaining 65 M☉ is projected against the UCH ii region.
4 Discussion
We believe the origin of the outflow is the 1.3 mm continuum source for two reasons. First, the slightly extended 1.3 mm continuum peak lies on the projected outflow axis, halfway between the peaks of the two outflow lobes. Second, the 1.3 mm continuum source seems to show a physical connection to both outflow lobes in the form of the extensions of the continuum along the outflow axis. Apparently the dust is being swept up in both lobes of the outflow (as seen in L1157 by Gueth et al. (2003)), and thus it seems that the outflow is emanating from the 1.3 mm continuum source.
The question of whether the outflow actually originates inside the UCH ii region is somewhat thornier. One possibility is that the 1.3 mm continuum source lines up with the UCH ii region by chance, and is a distinct high-mass protostar with its own dusty envelope, not physically connected to the UCH ii region, but part of the same young cluster. Alternatively, the dust and free-free continuua could be from a single source, one dusty, hot molecular core surrounding an embedded UCH ii region. In this case, it seems the outflow would have to come from inside the UCH ii region in order for both sides of the outflow to be seen in the dust continuum. We cannot distinguish between these two cases, and neither seems unlikely. However, we can say that the known O5 star is a bad candidate to be the source of the outflow since it is not equidistant from the outflow lobes.
We cannot eliminate any model chronologies by comparing timescales. The outflow has a dynamical age of 1600 years, compared to just 600 for the UCH ii region. This might lead one to believe that the outflow is truly older than the UCH ii region. However, any “quenching” of the UCH ii region by infalling material would tend to make the dynamical age of the H ii region an underestimate of its true age, perhaps by a great deal (Keto, 2002b). The gas in the outflow was probably accelerated before the UCH ii region began to expand, but not necessarily before the UCH ii region was created.
The central unknown about the outflow is its inclination. The fact that the two lobes hardly overlap at all on the plane of the sky and the fact that the SiO(5-4) emission is extended perpendicular to the outflow axis might lead one to believe that the outflow has a wide opening angle, and lies primarily in the plane of the sky. But these two facts could just as easily be interpreted as a highly collimated outflow, like those seen around low-mass proto-stars (Bachiller et al., 1991), whose axis is largely along the line of sight. Including only the line-of-sight velocity, the outflow is already quite energetic, so adding a large component in the plane of the sky would make this a remarkable outflow, indeed. Some studies of regions of massive star formation have found poor collimation of outflows (Richer et al., 2000; Ridge & Moore, 2001). But Beuther et al. (2002b) found that 15 outflows with apparently low collimation were consistent with the very high collimations seen in low mass cases, with the discrepancy due to low resolution. Higher resolution interferometer studies have confirmed the presence of highly collimated outflows in some regions of high-mass star formation (Beuther et al., 2002a).
The velocity structure of the SiO(5-4) is intriguing and may be a clue as to the outflow orientation. In both lobes, the spectra peak at low relative velocity and tail off towards much higher relative velocity. In the case of outflows from low-mass protostars, the SiO emission is concentrated immediately behind the shock in the highest velocity molecular gas (van Dishoeck & Blake, 1998). So perhaps the fact that the low relative velocity peaks in the SiO(5-4) emission, only km s-1, is an indication that the outflow is mainly in the plane of the sky. This outflow, however, is far more energetic than an outflow from a low-mass protostar. There could be highly excited SiO emission which follows behind the shock more closely than the SiO(5-4) emission. We plan to observe SiO, and lines of several CO isotopes with the SMA allowing calculations of excitation and abundance in the outflow to see if higher excitation gas occurs at higher line of sight velocities, as we might expect for an outflow largely along the line of sight. These observations will also have higher angular resolution which should clarify the outflow opening angle.
On an equally hypothetical note, consider the fact that while some dust emission appears to come from the outflow, the free-free emission shows no preference for the direction of the outflow, and is more extended perpendicular to the outflow. Recent results have shown that massive protostars (M☉) can have disk-like structures akin to the disks seen in low-mass protostars (Zhang et al., 1998, 2002). If such a disk were to photoevaporate, as was modeled by Hollenbach et al. (1994), that would naturally produce free-free emission which is extended perpendicular to the outflow, and possibly ring-like. However, if the outflow does not originate in the UCH ii region, the more traditional limb-brightened-shell interpretation of the free-free emission may make more sense. Future work to investigate the geometry and the velocity structure of the ionized gas could be carried out with the SMA using low quantum number radio recombination lines (RRLs) of hydrogen, including H, H, H, and H. These lines suffer less from pressure broadening than higher quantum number RRLs, and could be used to probe the velocity structure of the densest ionized gas in the UCH ii region.
References
- Acord et al. (1998) Acord, J. M., Churchwell, E., & Wood, D. O. S. 1998, ApJ, 495, L107
- Acord et al. (1997) Acord, J. M., Walmsley, C. M., & Churchwell, E. 1997, ApJ, 475, 693
- Akeson & Carlstrom (1996) Akeson, R. L. & Carlstrom, J. E. 1996, ApJ, 470, 528
- Arce & Goodman (2001) Arce, H. G. & Goodman, A. A. 2001, ApJ, 551, L171
- Bachiller et al. (1991) Bachiller, R., Martin-Pintado, J., & Planesas, P. 1991, A&A, 251, 639
- Becker et al. (1994) Becker, R. H., White, R. L., Helfand, D. J., & Zoonematkermani, S. 1994, ApJS, 91, 347
- Beuther et al. (2002a) Beuther, H., Schilke, P., Gueth, F., McCaughrean, M., Andersen, M., Sridharan, T. K., & Menten, K. M. 2002a, A&A, 387, 931
- Beuther et al. (2002b) Beuther, H., Schilke, P., Sridharan, T. K., Menten, K. M., Walmsley, C. M., & Wyrowski, F. 2002b, A&A, 383, 892
- Codella et al. (1999) Codella, C., Bachiller, R., & Reipurth, B. 1999, A&A, 343, 585
- Feldt et al. (2003) Feldt, M., Puga, E., Lenzen, R., Henning, T., Brandner, W., Stecklum, B., Lagrange, A.-M., Gendron, E., & G., R. 2003, ApJ, 599, L91
- Garay & Lizano (1999) Garay, G. & Lizano, S. 1999, PASP, 111, 1049
- Gordon (1988) Gordon, M. A. 1988, in Galactic and Extragalactic Radio Astronomy, 37–94
- Gueth et al. (2003) Gueth, F., Bachiller, R., & Tafalla, M. 2003, A&A, 401, L5
- Harvey & Forveille (1988) Harvey, P. M. & Forveille, T. 1988, A&A, 197, L19
- Ho et al. (2004) Ho, P. T. P., Moran, J., & Lo, K. Y. 2004, ApJ, this volume, 1
- Hollenbach et al. (1994) Hollenbach, D., Johnstone, D., Lizano, S., & Shu, F. 1994, ApJ, 428, 654
- Hunter (1997) Hunter, T. R. 1997, Ph.D. Thesis
- Hunter et al. (2000) Hunter, T. R., Churchwell, E., Watson, C., Cox, P., Benford, D. J., & Roelfsema, P. R. 2000, AJ, 119, 2711
- Keto (2002a) Keto, E. 2002a, ApJ, 568, 754
- Keto (2002b) —. 2002b, ApJ, 580, 980
- Lada & Fich (1996) Lada, C. J. & Fich, M. 1996, ApJ, 459, 638
- Richer et al. (2000) Richer, J. S., Shepherd, D. S., Cabrit, S., Bachiller, R., & Churchwell, E. 2000, Protostars and Planets IV, 867
- Ridge & Moore (2001) Ridge, N. A. & Moore, T. J. T. 2001, A&A, 378, 495
- Sandell (1994) Sandell, G. 1994, MNRAS, 271, 75
- Shepherd & Churchwell (1996) Shepherd, D. S. & Churchwell, E. 1996, ApJ, 457, 267
- Snell et al. (1990) Snell, R. L., Dickman, R. L., & Huang, Y.-L. 1990, ApJ, 352, 139
- Testi & Sargent (1998) Testi, L. & Sargent, A. I. 1998, ApJ, 508, L91
- van Dishoeck & Blake (1998) van Dishoeck, E. F. & Blake, G. A. 1998, ARA&A, 36, 317
- Watson et al. (2002) Watson, C., Churchwell, E. B., Zweibel, E., & Crutcher, R. M. 2002, Bulletin of the American Astronomical Society, 34, 1135
- Wood & Churchwell (1989) Wood, D. O. S. & Churchwell, E. 1989, ApJS, 69, 831
- Zhang et al. (1998) Zhang, Q., Hunter, T. R., & Sridharan, T. K. 1998, ApJ, 505, L151
- Zhang et al. (2002) Zhang, Q., Hunter, T. R., Sridharan, T. K., & Ho, P. T. P. 2002, ApJ, 566, 982