Long Term Spectral and Timing Behavior of the Black Hole Candidate XTE J1908094
Abstract
We present the long term X-ray light curves, detailed spectral and timing analyses of XTE J1908+094 using the Rossi X-ray Timing Explorer Proportional Counter Array observations covering two outbursts in 2002 and early 2003. At the onset of the first outburst, the source was found in a spectrally low/hard state lasting for 40 days, followed by a three day long transition to the high/soft state. The source flux (in 210 keV) reached 100 mCrab on 2002 April 6, then decayed rapidly. In power spectra, we detect strong band-limited noise and varying low-frequency quasi periodic oscillations that evolved from 0.5 Hz to 5 Hz during the initial low/hard state of the source. We find that the second outburst closely resembled the spectral evolution of the first. The X-ray transient’s overall outburst characteristics lead us to classify XTE J1908+094 as a black-hole candidate. Here we also derive precise X-ray position of the source using Chandra observations which were performed during the decay phase of the first outburst and following the second outburst.
1 Introduction
The X-ray transient source XTE J1908094 was serendipitously discovered on 2002 February 19 during scheduled Rossi X-ray Timing Explorer (RXTE) Proportional Counter Array (PCA) observations of a Soft Gamma Repeater, SGR 1900+14 (Woods et al. 2002). Subsequent RXTE/PCA scanning observations of the region allowed the localization of the new source to RA: 19h08m50s, Dec: +09∘22 30 with an accuracy of 2. This placed the new source about 24 away from SGR 1900+14. Based on Very Large Array observations on 2002 March 21 and 22, a transient source was suggested as the radio counterpart candidate to XTE J1908094 (Rupen, Dhawan & Mioduszewski 2002a). Observations in the optical band on April 8 and 9 revealed no new sources near the radio position (Garnavich, Quinn & Callanan 2002), however Chaty, Mignani & Israel (2002) identified a near infrared counterpart to the new source and concluded that XTE J1908094 is in a low-mass X-ray binary system with a main sequence companion of spectral type later than K. Based on our preliminary analysis of the RXTE/PCA observations we concluded that XTE J1908094 is a new stellar mass black hole candidate (Woods et al. 2002).
There are currently 18 dynamically confirmed and 20 candidate stellar mass black hole systems in our Galaxy (see McClintock & Remillard 2003 for a recent review). Most of them are characterized by occasional transient outbursts (X-ray novae; Chen, Shrader & Livio 1997) as a result of sudden increase in the mass accretion rate possibly triggered by instabilities in the accretion disk (Cannizzo 1993, Dubus et al. 2001). During outbursts, these systems generally undergo various changes in their spectral characteristics, usually in conjunction with changes in their timing behavior (see e.g., Homan et al. 2001). The most common BH spectral states are the low/hard state: the spectrum is represented by a hard power law and usually accompanied by timing variability, and the thermal-dominant (high/soft) state: a blackbody appears in the spectrum as the power law component gets steeper and timing features get weaker or completely disappear (Tanaka & Lewin 1995). Other spectral states characterized by more complicated spectral and timing properties are also observed (e.g., Homan et al. 2001).
In this study, we present the results of our spectral and timing analysis of the RXTE pointed observations of XTE J1908094 covering two outburst episodes. Additionally, we report observations with the Chandra X-Ray Observatory taken under Director’s Discretionary Time (DDT). We describe our observations in §2, and we present detailed data analyses in §3. In §4 we discuss and compare the different states of the source to other black hole candidates.
2 Observations
In Figure 1, we show the light curve of XTE J1908094 in the 1.512 keV band observed with the All Sky Monitor (ASM) onboard RXTE. Pointed observations with RXTE, indicated by vertical lines, were made throughout two outburst episodes until 2003 January 31, although pointings were more frequent during the first outburst. In this study, we used the data from 58 pointed RXTE observations (Obs # 7 through 64 in Table 1) with a total exposure time of 110.4 ks. In addition, we have 6 observations of SGR 1900+14 from our monitoring program (Obs # 1 6 in Table 1), covering the same portion of the sky 40 days prior to the first transient outburst of XTE J1908094 . We use these pointings to determine the background behavior from other sources in the field and the galactic ridge contribution as we will describe in §3.3. For convenience, we reference all times to 2002 January 6 (MJD 52280) in this paper.

Besides the ASM, there are two more instruments on RXTE: the PCA, an array of 5 nearly identical Proportional Counter Units (PCUs) which are sensitive to photon energies between keV, and the High Energy X-ray Timing Experiment (HEXTE) sensitive to photon energies between keV. Here, we present the results of our PCA data analysis only. The HEXTE spectral data analysis resulted in large statistical uncertainties after the background subtraction, even during the phase when the hard spectral component dominates the source spectrum, and it is not presented.
A short (1.1 ks) Chandra Advanced CCD Imaging Spectrometer (ACIS) observation was performed on 2002 April 15. It took place during the relatively bright phase of the outburst (day 99 in Figure 1), resulting in heavy pile up. Nevertheless, we could still use the data to determine an accurate X-ray position of XTE J1908094 . There are, additionally, two publicly available Chandra ACIS pointings performed on 2003 March 23, and 2003 April 19 for 4.7 ks each. We used these observations to confirm our best location solution determined from the earlier short pointing.
3 Data Analysis and Results
3.1 Source Location from the Chandra/ACIS Data
Our 2002 Chandra observation was taken in the ACIS full frame timed exposure mode while the two subsequent observations were collected in the 1/8 subarray mode. Initial standard processing of the data was performed by the Chandra X-ray Center (CXC). We modified the standard processed data by using acis_process_events (CIAO v2.3) to remove pixel randomization and to retrieve x-ray events flagged bad while attempting to remove cosmic ray events. The data were filtered to exclude events with ASCA grades 1, 5, and 7, hot pixels, bad columns, and events on CCD node boundaries.
To determine the location of XTE J1908094 , we followed the method of Hulleman et al. (2001) and fitted the piled up image with an appropiate function. We also determined the position from the two observations in 2003 and found that they are consistent. Since these data were not significantly piled up, we fitted a 2-dimensional Gaussian to the source location and determined the source centroid. We averaged all these locations and derived a (J2000) position of , for XTE J1908094 (90% error radius111http://asc.harvard.edu/cal/ASPECT/celmon of ).
3.2 Light Curves, Hardness Ratios, Color-Intensity Diagram
In Figure 2, we show the long-term PCA light curves of XTE J1908094 in the 25, 510 and 1020 keV energy bands. During the first 16 days of the outburst (from day 44 to 60 in Figure 2), the rates in all 3 bands increased by a factor of 3. In the following 27 days, the rise was gradual in the 25 and 510 keV bands, while the 1020 keV rate remained constant.

Starting at day 87, the rate in the 25 keV range increased rapidly (by a factor of 2 over the next 3 days), and then decayed exponentially (e-folding time of 26.8 1.2 days). During the time of the low energy peak (indicated by the left dashed vertical lines in Figure 2), the rates in both higher energy bands sharply declined.

About 55 days after the low energy peak, we see a secondary peak in all 3 energy bands, possibly a secondary maximum often seen in X-ray novae (Chen, Shrader & Livio 1997). A closer look at the secondary peak (shown in Figure 3) indicates that it evolves from soft to hard, with the 25 keV band peaking about 3 days earlier than the 510 keV energy band. It is noteworthy that soon after this secondary peak, the source transitioned into a harder spectral state (as marked in Figure 2 with the right dashed vertical line; see also Figure 3).
Between days 170 and 295, the source intensity remained very low (the flux varied between 1.6 and 3.6 10-10 erg s-1 cm-2), but significantly above the background value. (see Figure 1 and 2). The last two PCA observations of XTE J1908094 were during the second outburst episode which took place between days 330 and 410 (Figure 1). The peak of the outburst as seen with the ASM is between these two observations.

Changes in the source spectral properties are also reflected in the hardness ratios as illustrated in Figure 4. Here, the hardness ratios are defined as the ratio of the averaged (over each observation) count rates in the higher energy band to those in the lower energy band. Note that the evolution of the soft color (Figure 4, top panel) and the hard color (Figure 4, middle panel) are quite similar. The rise in hardness after the dip coincides with the secondary peak shown earlier (denoted by the right dashed vertical line in Figure 4).
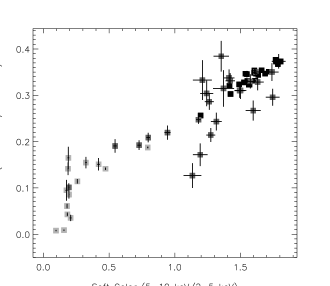
We present a color-color diagram in Figure 5. The different colors of the symbols correspond to the spectral states of the source; black represents the early hard state ( days 4490), and these points are, therefore, concentrated at the upper right corner of the diagram. Light gray represents the soft state ( days 90140) and dark gray are points from the subsequent low state (days 140 afterwards).
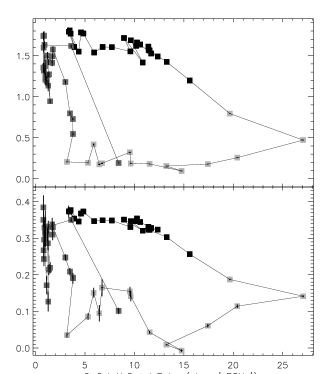
In Figure 6, we show the color-intensity diagram for both the soft and hard colors. Colors are identical to those in Figure 5. After the onset of the first outburst, both colors remained at high levels, then decreased quickly as the source underwent the first state transition and looped in the clockwise direction. Notice that the color of first of the last two observations appears to be at the level of the initial hard state, and the color of the last observation is among those in the soft state. Therefore, the second outburst, like the first, transitioned from a hard to a soft spectral state.
3.3 Spectral Analysis
For each RXTE observing orbit, we extracted the PCA spectrum using Standard2 data (129 channels accumulated every 16 s) collected from the top layer of all operating PCUs (to achieve the highest signal-to-noise ratio), excluding PCU0 (because of its higher background level caused by the loss of its propane layer). In selecting data we required the Earth elevation angle to be greater than 10∘ and the time to the nearest South Atlantic Anomaly passage to be greater than 30 minutes. A background spectrum was generated using the faint source background models provided by the PCA instrument team and pcabackest which is an FTOOLS utility. Spectral modelling was performed using XSPEC 11.2.0.
Due to the fact that the PCA is not an imaging instrument and it has a relatively large field-of-view ( FWHM), the background subtracted PCA spectra of XTE J1908094 still have some contamination from other X-ray sources in the field and from the galactic ridge. To determine the spectral shape and the intensity level of this contamination, we generated background subtracted spectra from the PCA observations performed 40 days before the outburst (Obs # 1 6 in Table 1) using the same methodology described earlier. We found that all these spectra were well fitted by a power law ( = 1.8) plus a Gaussian line (Ecent = 6.68 keV and Ewidth = 0.45 keV) both attenuated by the interstellar absorption (fixed at NH = 1.8 1022 cm-2, as given by Valinia & Marshall 1998). The model normalizations of all six spectral fits are consistent within errors, therefore we calculated their weighted mean (by statistical errors). We then included this absorbed power law plus Gaussian line model (all parameters are fixed at determined values) as a fixed term in the subsequent spectral fitting of the XTE J1908094 .
The energy spectra of the black hole X-ray binaries are generally successfully fitted by a two component model containing a multicolor disk blackbody (Mitsuda et al. 1984) plus a power law (Tanaka & Lewin 1995). The former (or the soft) component is expected to originate mainly from the inner portions of the accretion disk (T R-3/4), while the latter (the hard) component is believed to be due to Compton up-scattering of low energy seed photons from the disk by the energetic electrons (possibly) in the hot corona around the inner disk.

Our initial fits to each XTE J1908094 spectrum (over the energy range of 2.525 keV) with absorbed (NH fixed at 2.5 1022 cm-2 as reported by in’t Zand et al. 2002) disk blackbody plus power law model during the early hard state of the outburst (from days 44 through 90) revealed a significant excess in the resulting residuals between 4.5 and 7 keV. Inclusion of a Gaussian line component to the model resulted in a broad line feature (see the two representative spectra in Figure 7 and 8 for the necessity of adding this component) and significant improvement in the goodness of fit to the acceptable level. Also during this state, the disk blackbody component was not statistically required, nonetheless we kept this component to determine the upper limits of the disk blackbody flux. Table 2 lists the resulting values for the spectral parameters. In all spectral fits, we obtained statistically acceptable values ranging between 0.51 and 1.19.

We show the variations of the spectral model parameters in Figure 9. During the low/hard state, the power law index remained fairly constant ( 1.5). The centroid of the broad line feature appears to vary between 5.18 and 6.88 keV, with a statistically weighted average of 5.73 0.09 keV. The width of the line ranges between 0.96 and 1.27 keV, with a weighted average value of 1.11 0.31 keV. The corresponding line equivalent widths range from 153 eV to 734 eV, with the majority being between 170 and 360 eV.

As the source transited into the soft state (first dashed line in Figure 9), the disk blackbody component appeared and became prominent, while the broad line feature disappeared. The blackbody temperature clearly evolves during the soft state. The model normalization, Ndisk of the disk blackbody component is parametrized in terms of the inner disk radius, the distance to the source and the inclination angle, as Ndisk = (R/d) cos. If the last two are assumed to not vary over the course of the soft spectral state, there is some evidence for an early increase of the inner disk radius that remains relatively constant around 40 until day 130, and then decreases to its initial value. Meanwhile, the power law trend became steeper with an average value of 2.5.
On day 149, soon after the secondary peak (second dashed line in Figure 9), the spectral transition into the low/hard state took place. Similar to the earlier hard state, the source spectrum is dominated by the power law component and the broad line feature again becomes observable, although with relatively lower line flux, therefore, with larger uncertainties in the line model parameters (see also Figure 10).
The last two RXTE observations studied here (on days 339 and 384) captured a glimpse of the second outburst; the first of these pointings was during the rise of the X-ray intensity while the second was during its decline (see Figure 1). Detailed spectral analysis of these two observations show that the spectrum of the first one was hard, resembling the low/hard state; in contrast, the spectrum of the second was strongly dominated by the soft component, indicating the reappearance of disk emission.
Figure 10 illustrates the time history of the fluxes of each model component. Similar to the 1020 keV light curve of the source (Figure 2, bottom panel), the power law flux increased over the first 16 days into the outburst, then remained constant, forming the ‘knee’ at around day 60. There is an apparent correlation between the line and power law fluxes (especially during the first rising portion and around the secondary peak), which suggests that these two may be related.

In the energy range that the spectral fitting was performed (2.525 keV), we have been detecting only the higher energy tail of the blackbody spectrum (kT 0.60.7 keV) whose significant portion lies between 1 and 2.5 keV. To account for this, we have additionally integrated the blackbody flux values over 125 keV (indicated by asterisks in Figure 10, second panel from top). We find that the absorbed 125 keV disk flux is 50% larger than the flux in the 2.525 keV range.
3.4 Timing Analysis
We computed power spectra for each pointed observation using the PCA event mode data (E_125us_64M_1s). In the few cases where more than one PCU combination occurred during an observation, we made separate power spectra for each combination. More specifically, we generated light-curves from the event mode data using 31.25 ms binning, and divided them into 512 s segments, which were then Fourier transformed. The Fourier powers were then averaged over the segments.

To examine the overall evolution of the source noise during the first outburst, we generated power spectra in three energy bands, 25 keV, 510 keV, and 1020 keV. Figure 11 shows the fractional RMS amplitude in the 0.002-5 Hz frequency range for each energy band, during the first outburst. The RMS amplitudes were normalized to the source count rates obtained by subtracting from the observed count rate the faint source model rate, and the predicted rate from the galactic ridge emission. There is no significant difference between energy bands. The fractional variability drops slowly until day 87, after which it falls rapidly in coincidence with the fall of the 1020 keV flux, and the rapid rise in the 25 keV flux. After the peak of the 25 keV flux on day 90, the source noise power is no longer detected.

Figure 12 shows a representative power spectrum (from the observation on day 55) for the 2-20 keV energy band. The upper panel shows the Leahy normalized power with the Poisson noise level of 2 subtracted. For better display this has been logarithmically rebinned in frequency. At low frequencies the power spectrum is nearly flat, while at high frequencies it drops off as a power-law with index near -1. In the lower panel we plot the power minus Poisson noise level multiplied by the frequency, which is proportional to the source power per decade of frequency. Evident in this plot is a QPO near 0.5 Hz.
We fit the power spectra in the 2-20 keV band with a model with three components representing the Poisson level, the continuum, and the QPO:
| (1) |
where ,, and are the amplitudes of the Poisson level, continuum, and QPO components, the break point in the continuum power-law index, and the continuum index before and after the break, respectively, the QPO center, and the QPO full-width at half maximum. In general this model reasonably characterized the power spectra.

Figure 13 shows the resulting fractional rms amplitude of the continuum and QPO components during the first outburst. The continuum amplitude follows the trend described for Figure 11. The QPO amplitude varies from 3% to 13%. As the 10-20 keV flux falls, the ratio of the QPO amplitude to the continuum amplitude increases. For the observation at the peak of the 25 keV flux, we have only an upper limit for the continuum RMS, which is below the measured QPO amplitude. The power spectrum for this observation is shown in Figure 14.

In Figure 15 we show the frequency evolution of the QPO. The frequency gradually increases during the early stages of the outburst and around day 60 it exhibits a jump, which coincides with the knee in the flux seen in Figure 2. After that the QPO frequency rises more rapidly, following a different logarithmic trend. The last two frequency measurements were during the state transition episode of the outburst.

4 Discussion
In the course of its X-ray activity XTE J1908+094 proceeds through a series of X-ray states characteristic of black hole binaries, which we shall discuss using the terminology proposed by McClintock & Remillard (2003). The discovery outburst begins in the low/hard state, which lasted until about day 87. The source then enters an intermediate state during which the 25 keV flux peaks. This ends near day 90 when the source enters the thermal-dominant (high/soft) state, which persists until day 143, just before the secondary peak, where the source enters an intermediate state and then after day 149 returns to the low/hard state. The remaining observations (in 1.512 keV) up to the peak of the second outburst show the source in the low/hard state (see Figure 1). The one observation following the second outburst peak is consistent with the thermal-dominant state.
In the low/hard state the energy spectra are dominated by a hard power-law component, and the power spectra by strong band-limited noise. During the low/hard state at the onset of the first outburst, the index of the power-law spectra began at , and then gradually softened to . The power spectra show band-limited noise with an rms amplitude which began near % and gradually fell to %. In addition there was a QPO with rms amplitude varying from 3% to 13%, which rose in frequency from 0.5 to 2.2 Hz. In the second interval of low/hard state ( days 149295) the flux is lower, and the behavior of the power-law index is more complex. Due to the low flux, we could not make significant power-spectral measurements.
Outburst onsets in the low/hard state have been seen in a number of X-ray novae. Brocksopp et al. (2002) tabulate 13 sources with outbursts that began in the low/hard state, five of which never left this state. Strong low-frequency QPO with rising frequencies are common in these low/hard state onsets, and have been seen for GRO J0422+32 van der Hooft et al. (1999), GRO J1719-24 van der Hooft et al. (1996), XTE J1550-564 (Finger et al. 1998; Cui et al. 1999), 4U 1630-472 Dieters et al. (2000), XTE J1859+226 Markwardt et al. (1999), and XTE J1118+480 Wood et al. 2000b , among others.

Hard-X-ray and gamma-ray observations have shown that in the low/hard state the power-law spectra break in the 100 keV range Grove et al. (1998). In Figure 16 we show our spectral fit for the PCA data on day 64 along with the spectral fit for BeppoSAX/PDA data from days 6265 (MJD 5234252345) in’t Zand et al. (2002). We notice a break near 50 keV. The flux in the 30-250 keV range is , which surpasses the flux in the 2.5-25 keV range of .
The low/hard state is also associated with radio emission. Flat spectrum radio emission, associated with compact jets, is consistently observed during the low/hard state of X-ray novae Fender (2003). Indeed, during the onset of the first XTE J1908+094 outburst, Very Large Array observations (on days 7475) led to the discovery of a radio counterpart to XTE J1908+094, with a flux of 0.85 mJy at 8.6 GHz Rupen et al. 2002a . This was detected in additional observations until day 127 Rupen et al. 2002b .

Figure 17 shows the X-ray flux, power-law index and variability amplitude evolution during the transition interval between the low/hard and thermal-dominant state. This intermediate state begins near day 67, when the power-law flux begins to drop, the power-law component begins to rapidly soften, and the disk black-body flux begins to rise, and the flux variability begins to fall. The rise of the disk black-body flux occurs in four days, but the fall of the power-law flux takes 15 days to complete. BeppoSAX/MECS observations covering day 66.4 67.8 (MJD 52366.452367.8) show the onset of this transition in’t Zand et al. (2002).
In this transition, the total flux in 2.525 keV band consistently falls. However, a significant fraction of the disk black-body flux is below this energy range. From our spectral fits we find that the total integrated flux of this thermal component rises to , implying that the bolometric flux may be constant or rising.
After day 90 the source is in the thermal-dominant state, with thermal disk flux dominating the spectrum, and low variability. The disk black-body normalizations average about 40, which is consistent with the inner disk being at the radius of the inner most stable circular orbit if
| (2) |
where is the black-hole mass, the source distance in units of 10 kpc, and the disk inclination to the line of sight. Note here that for any value of disk inclination angle, the mass of the central object is in the range of a black hole, if the source distance is of the order of 10 kpc.
During this thermal-dominant state, the flux steadily falls. This mainly occurs by the temperature decreasing. The thermal-dominant state ends on day 149 when a transition begins back to the low/hard state.
In the transition from the low/hard state to the thermal-dominant state starting day 87), the disk black-body normalization begins near 15 and rises, implying an increasing inner disk radius. The opposite occurs on the transition back to the low/hard state. This is counter to the expectation that the inner-disk radius is large during the low/hard state, and near the inner most stable orbit in the thermal-dominant state (e.g., Esin et al. 1997). This rise and fall may be due to systematic problems with our spectral fits: we detect only the high-energy tail of the thermal spectrum. In fits where the column density, disk temperature and flux are all free to vary, these parameters are, therefore, highly coupled. By fixing the column density to the value found with the BeppoSAX data, we have reduced this coupling, but could be biasing the solution.
There is a strong correlation between the flux associated with the broad line feature and that of the power law component during the early stages of the first outburst episode. One possible interpretation of this feature is that it is the fluorescent Fe K emission produced by the reprocessing of the hard X-ray photons by cooler material close to the central object. The line centroid energies were somewhat lower than what is expected for neutral iron (6.4 keV). This may suggest that what we observe is primarily the red wing of Doppler shifted neutral Fe K in a Keplerian accretion. This was seen also in 4U 163047 (Cui, Chen & Zhang 1999) and in XTE J1748288 (Miller et al. 2001).
Esin et al. (1997) have presented a model to explain the states of X-ray novae. In the quiescent and low/hard state a thin accretion disk is present but truncated at a large inner radius. Within this radius there is an Advection Dominated Accretion Flow (ADAF) which is a hot and radiatively inefficient flow where most of the thermal energy generated is advected onto the black hole rather then being radiated. Above the accretion disk is a hot corona, which is a continuation of the advection dominated flow, which produces a power-law spectral component in the low/hard state by Comptonization.
This model does not incorporate the jets which are responsible for the radio emission now known to be associated with the low/hard state. Markoff, Falcke & Fender (2001) have proposed that these jets also produce the power-law component via synchrotron radiation. In their model a standard accretion disk transitions at an inner radius of km to a hot ADAF-like flow which feeds the jet. The hard X-rays are synchrotron radiation produced in a shock acceleration region some km above the disk plane. The radio emission is from beyond this region.
While providing successful fits of a multi-wavelength spectrum, neither of these models yet consider dynamical changes in the flow or attempt to explain the power-spectra seen in the different states. The high amplitude variability seen in the low-hard state requires changes in emissivity that are spatially coherent over most of the emission region. It is tempting to associate the QPO’s seen in the low/hard state with the Keplerian frequency at the inner edge of the thin accretion disk. Yet while this is plausible in the low-hard state, the QPO in XTE J1908+094 persists into the intermediate state, where the inner disk radius inferred from spectral fits imply frequencies much larger than those observed.
References
- Brocksopp et al. (2002) Brocksopp, C., Fender, R. P., McCollough, M. et al. 2002, MNRAS, 331, 765
- Brocksopp et al. (2001) Brocksopp, C., Jonker, P. G., Fender, R. P. et al. 2001, MNRAS, 323, 517
- (3) Cannizzo, J.K. (1993), ApJ, 419, 318
- (4) Chaty, S., Mignani, R.P. and Israel, G.L. 2002, MNRAS 337, L23
- (5) Chen, W., Shrader, C.R. and Livio, M. 1997, ApJ 491, 312
- Cui et al. (1999) Cui, W., Zhang, S. N., Chen, W. & Morgan E. H. 1999, ApJ, 512, L43
- Cui et al. (2000) Cui, W., Chen, W. & Zhang, S. N. 2000, ApJ, 529, 952
- Dieters et al. (2000) Dieters, S. W., Belloni, T., Kuulers, E. et al. 2000, ApJ538, 307
- (9) Dubus, G., Hameury, J.-M and Lasota, J.-P. 2001, A&A 373, 251
- Esin, McClintock, & Narayan (1997) Esin, A. A., McClintock, J. E., & Narayan, R. 1997, ApJ, 489, 865
- Fender (2003) Fender, R. 2003, astro-ph/0303339
- Finger et al. (1998) Finger, M. H., Dieters, S. W., & Wilson, R. B. 1988, IAUC 7010
- (13) Garnavich, P., Quinn, J., Callanan, P. 2002, IAUC, 7877
- Grove et al. (1998) Grove, J. E., Johnson, W. N., Kroeger, R. A., et al. 1998, ApJ500, 899
- (15) Homan, J., Wijnands, R., van der Klis, M., et al. 2001, ApJS, 132, 377
- (16) Hulleman, F., Tennant, A. F., van Kerkwijk, M. H. et al. 2001, ApJ, 563, L49
- (17) Miller, J.M., Fox, D.W., Di Matteo, T., et al. 2001, ApJ, 546, 1055
- van der Hooft et al. (1996) van der Hooft, F., Kouveliotou, C., van Paradijs, J. et al. 1996, A&A Supp., 120C, 141
- van der Hooft et al. (1999) van der Hooft, F., Kouveliotou, C., van Paradijs, J. et al. 1999, ApJ, 513, 477
- McClintock & Remillard (2003) McClintock, J. E. & Remillard, R. A. 2003, in Compact Stellar X–ray sources, eds. W.H.G. Lewin and M. van der Klis, in press, astro-ph/0306213
- Markoff, Falcke, & Fender (2001) Markoff, S., Falcke, H, & Fender, R. 2001, A&A 372, L25
- Markwardt et al. (1999) Markwardt, C. B., Focke, W. B., Swank, J. H. & Taam, R. E. 1999, Bull. Am. Astron. Soc., 31, 1555
- (23) Mitsuda, K., Inoue, H., Koyama, K., et al. 1984, PASJ 36, 741
- (24) Rupen, M. P., Dhawan, V., & Mioduszewski, A. J. 2002a, IAUC 7874
- (25) Rupen, M. P., Dhawan, V., & Mioduszewski, A. J. 2002b, IAUC 8029
- (26) Tanaka, Y. and Lewin, W.H.G. 1995, in X-ray Binaries, eds. W.H.G. Lewin, J. van Paradijs, and E.P.J. van den Heuvel, (Cambridge U. Press, Cambridge), 126
- (27) Valinia, A. & Marshall, F.E. 1998, ApJ, 505, 134
- (28) Wood, K. S., Ray, P. S., Bandyopadhyay, R. M. et al. 2000, ApJ, 544, L45
- (29) Woods, P. M., Kouveliotou, C., Finger, M. et al. 2002, IAUC 7856
- in’t Zand et al. (2002) in’t Zand, J. J. M., Miller, J. M., Oosterbroek, T. & Parmar, A. N. 2002, A&A 394, 553
| Obs | Timeaafootnotemark: | Exp | Count Ratebbfootnotemark: | Hardness | Obs | Timeaafootnotemark: | Exp | Count Ratebbfootnotemark: | Hardness |
|---|---|---|---|---|---|---|---|---|---|
| # | (ks) | (c/s/PCU) | Ratioccfootnotemark: | # | (ks) | (c/s/PCU) | Ratioccfootnotemark: | ||
| 1 | 0.1 | 9.9 | 0.09 | 33 | 115.4 | 1.2 | 11.6 | 0.035(3) | |
| 2 | 1.2 | 10.0 | 0.09 | 34 | 119.3 | 0.6 | 13.0 | 0.048(3) | |
| 3 | 1.6 | 9.7 | 0.04 | 35 | 123.9 | 1.3 | 8.1 | 0.043(6) | |
| 4 | 2.1 | 10.2 | 0.06 | 36 | 125.2 | 0.8 | 7.6 | 0.034(8) | |
| 5 | 5.2 | 9.8 | 0.04 | 37 | 129.9 | 0.9 | 8.7 | 0.058(5) | |
| 6 | 11.1 | 10.0 | 0.02 | 38 | 131.1 | 1.6 | 6.4 | 0.037(3) | |
| 7 | 44.9 | 9.4 | 12.1 | 0.224(3) | 39 | 137.4 | 1.1 | 3.8 | 0.042(8) |
| 8 | 46.4 | 3.0 | 13.4 | 0.199(3) | 40 | 141.3 | 1.1 | 6.2 | 0.080(6) |
| 9 | 49.7 | 2.9 | 15.7 | 0.223(2) | 41 | 144.2 | 1.6 | 7.0 | 0.090(4) |
| 10 | 50.7 | 2.9 | 16.5 | 0.226(2) | 42 | 145.5 | 1.7 | 6.8 | 0.099(4) |
| 11 | 51.9 | 2.9 | 18.1 | 0.201(3) | 43 | 149.5 | 0.9 | 7.4 | 0.132(4) |
| 12 | 54.9 | 3.3 | 21.4 | 0.207(1) | 44 | 154.6 | 1.1 | 5.4 | 0.182(8) |
| 13 | 56.9 | 3.3 | 24.3 | 0.207(1) | 45 | 160.9 | 0.7 | 5.0 | 0.169(8) |
| 14 | 60.7 | 8.9 | 29.6 | 0.215(1) | 46 | 163.2 | 0.6 | 4.8 | 0.177(9) |
| 15 | 62.2 | 2.1 | 31.5 | 0.212(1) | 47 | 170.5 | 1.3 | 3.5 | 0.165(9) |
| 16 | 64.4 | 1.5 | 32.3 | 0.209(1) | 48 | 174.2 | 1.1 | 3.7 | 0.171(8) |
| 17 | 67.2 | 1.2 | 33.3 | 0.215(2) | 49 | 179.4 | 1.0 | 3.4 | 0.122(8) |
| 18 | 70.1 | 3.1 | 33.8 | 0.208(1) | 50 | 183.3 | 0.9 | 3.1 | 0.114(7) |
| 19 | 73.6 | 2.4 | 35.3 | 0.194(1) | 51 | 188.9 | 1.6 | 3.2 | 0.147(8) |
| 20 | 75.8 | 0.9 | 36.6 | 0.190(2) | 52 | 192.4 | 0.7 | 2.9 | 0.090(18) |
| 21 | 77.8 | 1.4 | 35.3 | 0.193(1) | 53 | 194.2 | 1.2 | 2.6 | 0.107(15) |
| 22 | 79.9 | 3.4 | 35.8 | 0.200(1) | 54 | 198.8 | 1.8 | 2.6 | 0.181(9) |
| 23 | 80.9 | 3.2 | 35.1 | 0.193(1) | 55 | 207.6 | 1.1 | 2.2 | 0.133(10) |
| 24 | 82.7 | 1.9 | 37.8 | 0.175(1) | 56 | 238.9 | 0.9 | 2.5 | 0.158(20) |
| 25 | 86.8 | 1.9 | 39.0 | 0.139(1) | 57 | 244.0 | 1.2 | 2.4 | 0.148(11) |
| 26 | 88.9 | 2.5 | 38.1 | 0.084(1) | 58 | 251.8 | 0.8 | 2.6 | 0.159(19) |
| 27 | 90.5 | 1.6 | 41.6 | 0.048(1) | 59 | 257.5 | 1.9 | 2.6 | 0.151(13) |
| 28 | 98.2 | 1.4 | 26.2 | 0.029(1) | 60 | 269.0 | 1.9 | 2.2 | 0.177(14) |
| 29 | 101.2 | 1.5 | 20.7 | 0.018(1) | 61 | 283.1 | 1.6 | 2.7 | 0.163(9) |
| 30 | 105.9 | 1.9 | 15.3 | 0.013(1) | 62 | 295.0 | 1.2 | 2.8 | 0.172(9) |
| 31 | 107.9 | 0.9 | 16.0 | 0.005(2) | 63 | 339.1 | 1.4 | 11.4 | 0.203(3) |
| 32 | 112.9 | 3.1 | 13.7 | 0.019(1) | 64 | 384.7 | 1.5 | 10.1 | 0.032(2) |
a Observation times referenced to 2002 January 6.0 (MJD 52280.0).
b Background subtracted, orbit averaged rates in 220 keV band.
c Hardness Ratios defined as the ratio of the background subtracted, orbit averaged rates in the 1020 keV to those in 210 keV.
| Obs | Multicolor Disk Blackbody | Broad Line | Power Law | ||||||
|---|---|---|---|---|---|---|---|---|---|
| # | kTdiskaafootnotemark: | Ndisk | Fdiskbbfootnotemark: | Ecent.aafootnotemark: | aafootnotemark: | Flinebbfootnotemark: | FPLbbfootnotemark: | FTotalbbfootnotemark: | |
| (keV) | (10-10cgs) | (keV) | (keV) | (10-11cgs) | (10-9cgs) | (10-9cgs) | |||
| 7 | 0.60 | 11.5 | 0.03 | 5.720.17 | 1.070.55 | 2.21(44) | 1.400.03 | 1.09(1) | 1.12(2) |
| 8 | 0.60 | 39.5 | 0.09 | 5.750.27 | 1.030.92 | 1.92(66) | 1.450.04 | 1.15(2) | 1.18(4) |
| 9 | 0.60 | 149.7 | 0.35 | 5.440.14 | 0.960.44 | 2.76(41) | 1.500.03 | 1.30(1) | 1.37(2) |
| 10 | 0.60 | 170.0 | 0.40 | 5.490.13 | 0.960.43 | 2.88(41) | 1.490.02 | 1.36(1) | 1.44(2) |
| 11 | 0.60 | 0.01 | 0.01 | 5.440.43 | 1.101.35 | 1.44(75) | 1.450.03 | 1.57(2) | 1.59(5) |
| 12 | 0.60 | 47.1 | 0.11 | 5.330.11 | 1.160.34 | 2.81(32) | 1.470.01 | 1.83(1) | 1.87(2) |
| 13 | 0.60 | 31.6 | 0.07 | 5.540.12 | 1.250.43 | 2.46(37) | 1.500.01 | 2.06(1) | 2.09(2) |
| 14 | 0.60 | 76.9 | 0.02 | 5.600.15 | 1.140.50 | 3.36(55) | 1.550.02 | 2.34(2) | 2.39(3) |
| 15 | 0.60 | 0.01 | 0.01 | 5.680.11 | 1.310.37 | 5.34(55) | 1.520.01 | 2.57(2) | 2.63(4) |
| 16 | 0.60 | 37.2 | 0.08 | 5.610.21 | 1.140.69 | 2.68(65) | 1.550.02 | 2.61(2) | 2.65(3) |
| 17 | 0.60 | 0.01 | 0.01 | 5.590.23 | 1.100.76 | 3.32(82) | 1.530.02 | 2.69(3) | 2.73(6) |
| 18 | 0.60 | 78.3 | 0.18 | 5.710.08 | 1.110.29 | 4.34(38) | 1.540.01 | 2.66(1) | 2.73(2) |
| 19 | 0.60 | 68.1 | 0.16 | 5.410.09 | 1.150.28 | 4.44(37) | 1.570.01 | 2.69(1) | 2.76(2) |
| 20 | 0.60 | 69.3 | 0.17 | 5.770.18 | 1.120.62 | 4.02(78) | 1.580.02 | 2.77(3) | 2.83(5) |
| 21 | 0.60 | 0.01 | 0.01 | 5.780.14 | 1.120.49 | 3.99(62) | 1.660.01 | 2.64(2) | 2.68(4) |
| 22 | 0.60 | 0.01 | 0.01 | 5.890.09 | 1.270.32 | 4.84(46) | 1.610.01 | 2.72(1) | 2.78(2) |
| 23 | 0.60 | 29.6 | 0.07 | 5.800.08 | 1.110.30 | 4.28(40) | 1.640.01 | 2.63(1) | 2.68(2) |
| 24 | 0.60 | 97.8 | 0.23 | 5.830.10 | 1.100.35 | 4.80(50) | 1.660.01 | 2.71(2) | 2.79(3) |
| 25 | 0.75 | 55.4 | 0.58 | 6.080.11 | 1.100.39 | 4.73(56) | 1.910.02 | 2.48(2) | 2.59(4) |
| 26 | 0.790.01 | 27627 | 3.88(37) | 5.950.07 | 1.100.33 | 4.91(52) | 2.290.03 | 1.76(2) | 2.19(7) |
| 27 | 0.740.01 | 91455 | 8.67(52) | 5.960.37 | 1.200.48 | 4.40(70) | 2.440.06 | 1.35(2) | 2.27(9) |
| 28 | 0.690.01 | 145569 | 9.55(45) | 6.0 | 1.150.55 | 2.80 | 2.030.19 | 0.31(3) | 1.29(8) |
| 29 | 0.670.01 | 169684 | 8.37(42) | 6.0 | 0.671.55 | 0.83 | 2.640.67 | 0.13(2) | 0.98(7) |
| 30 | 0.690.01 | 168699 | 10.0(59) | 6.0 | 1.10 | 0.41 | 2.661.64 | 0.08(2) | 1.09(11) |
| 31 | 0.630.01 | 2139193 | 7.48(68) | 6.0 | 0.621.14 | 0.81 | 3.491.64 | 0.01(3) | 0.76(7) |
| 32 | 0.650.01 | 145676 | 5.96(31) | 6.0 | 1.072.10 | 0.77 | 3.031.22 | 0.08(0) | 0.68(7) |
| 33 | 0.610.01 | 2045188 | 5.30(49) | 6.0 | 1.000.62 | 2.05 | 0.760.51 | 0.10(2) | 0.66(7) |
| 34 | 0.590.01 | 1920251 | 4.24(55) | 6.0 | 0.672.89 | 0.76 | 2.350.38 | 0.29(3) | 0.73(10) |
| 35 | 0.610.01 | 1308253 | 3.60(70) | 6.0 | 1.140.71 | 2.34 | 3.370.76 | 0.08(4) | 0.47(12) |
| 36 | 0.540.01 | 2713803 | 3.21(95) | 6.0 | 1.10 | 0.20 | 2.581.84 | 0.10(3) | 0.43(14) |
| 37 | 0.580.02 | 1189303 | 2.24(57) | 6.0 | 1.151.97 | 1.36 | 2.540.51 | 0.25(3) | 0.49(11) |
| 38 | 0.540.02 | 2024461 | 2.39(54) | 6.0 | 1.362.57 | 0.84 | 2.900.97 | 0.07(3) | 0.32(10) |
| 39 | 0.570.02 | 1042263 | 1.73(44) | 6.0 | 0.882.16 | 1.01 | 2.541.44 | 0.08(3) | 0.19(9) |
| 40 | 0.570.04 | 686297 | 1.14(50) | 6.0 | 1.432.39 | 1.18 | 2.360.39 | 0.23(3) | 0.36(11) |
| 41 | 0.680.03 | 17859 | 0.99(33) | 6.0 | 1.101.14 | 1.59 | 2.160.26 | 0.31(2) | 0.43(7) |
| 42 | 0.640.05 | 16389 | 0.61(33) | 6.0 | 1.322.78 | 0.76 | 2.260.23 | 0.35(2) | 0.42(8) |
| 43 | 0.60 | 69.9 | 0.17 | 5.970.35 | 1.091.39 | 1.15(66) | 1.890.08 | 0.48(2) | 0.50(3) |
| 44 | 0.60 | 37.8 | 0.10 | 5.430.29 | 1.100.93 | 1.78(62) | 1.510.14 | 0.39(2) | 0.42(3) |
| 45 | 0.60 | 35.7 | 0.09 | 5.590.32 | 1.081.03 | 1.52(60) | 1.460.15 | 0.34(2) | 0.37(3) |
| 46 | 0.60 | 40.3 | 0.09 | 6.520.65 | 1.10 | 0.35(46) | 1.450.13 | 0.35(1) | 0.36(3) |
| 47 | 0.60 | 0.01 | 0.001 | 6.0 | 1.10 | 0.01 | 1.680.06 | 0.26(1) | 0.26(1) |
| 48 | 0.60 | 19.0 | 0.04 | 6.0 | 1.10 | 0.44 | 1.530.12 | 0.27(1) | 0.28(2) |
| 49 | 0.60 | 0.01 | 0.001 | 6.0 | 1.10 | 0.32 | 1.860.16 | 0.22(1) | 0.22(2) |
| 50 | 0.60 | 61 1 | 0.14 | 6.0 | 1.10 | 0.25 | 2.040.17 | 0.19(2) | 0.20(4) |
| 51 | 0.60 | 17.3 | 0.04 | 6.121.22 | 1.061.58 | 2.12(87) | 1.940.18 | 0.24(2) | 0.25(4) |
| 52 | 0.60 | 0.01 | 0.01 | 6.460.58 | 1.412.08 | 2.31(1.84) | 2.200.46 | 0.19(5) | 0.21(12) |
| 53 | 0.60 | 61.1 | 0.15 | 6.670.40 | 1.091.83 | 1.69(1.22) | 1.880.35 | 0.18(3) | 0.20(7) |
| 54 | 0.60 | 23.5 | 0.06 | 5.180.56 | 0.821.59 | 0.64(44) | 1.330.20 | 0.22(1) | 0.24(2) |
| 55 | 0.60 | 9.84 | 0.02 | 6.020.45 | 1.821.66 | 1.53(83) | 1.890.21 | 0.15(1) | 0.16(3) |
| 56 | 0.60 | 37.7 | 0.09 | 6.121.74 | 1.10 | 0.01 | 1.460.35 | 0.24(2) | 0.25(2) |
| 57 | 0.60 | 0.01 | 0.01 | 6.090.80 | 1.243.74 | 0.61(99) | 1.740.23 | 0.21(2) | 0.22(5) |
| 58 | 0.60 | 25.2 | 0.06 | 5.791.66 | 1.10 | 0.34(67) | 1.530.40 | 0.22(2) | 0.23(4) |
| 59 | 0.60 | 0.01 | 0.01 | 7.011.74 | 1.10 | 0.27(80) | 1.760.22 | 0.19(2) | 0.20(5) |
| 60 | 0.60 | 45.7 | 0.11 | 5.320.53 | 1.11.41 | 1.04(57) | 1.940.61 | 0.19(2) | 0.21(4) |
| 61 | 0.60 | 3.46 | 0.08 | 5.820.40 | 1.081.62 | 1.05(69) | 1.560.20 | 0.24(2) | 0.25(4) |
| 62 | 0.60 | 0.01 | 0.01 | 6.880.86 | 1.10 | 0.38(45) | 1.550.12 | 0.31(1) | 0.32(3) |
| 63 | 0.60 | 15.0 | 0.04 | 5.630.43 | 1.281.72 | 1.13(77) | 1.430.04 | 1.19(2) | 1.20(4) |
| 64 | 0.600.01 | 1669144 | 4.40(38) | 6.230.33 | 1.080.87 | 1.43(48) | 1.340.64 | 0.08(2) | 0.54(7) |
a Values without errors were kept frozen in the fitting procedure.
b Absorbed flux in the 2.525 keV band. Values in the parentheses are the 2-sigma level errors in the last number of digits of given flux values.