Hard X–ray emission from Serpens X-1 as observed by INTEGRAL
Abstract
We here report results of an INTEGRAL observation of the X–ray burst and atoll source Ser X-1 performed on May 2003. The object was observed for a total of 400 ks but nearly 8∘ off-axis due to the amalgamation with an observation of SS 433, the pointing target source. Ser X-1 was detected up to 30 keV with unprecedented positional accuracy for a high-energy emission; a sharp spectral drop is evident beyond this energy. Significant variability is seen in the 20–30 keV light curve. Comparison with previous observations indicates that the source was in its high (banana) state and displayed a soft spectrum during the INTEGRAL pointing. A (non simultaneous) broadband radio-to-–rays broad-band spectral energy distribution for Ser X-1 is also presented for the first time.
keywords:
X–rays: binaries, X–rays: individuals: Ser X-1, Stars: neutron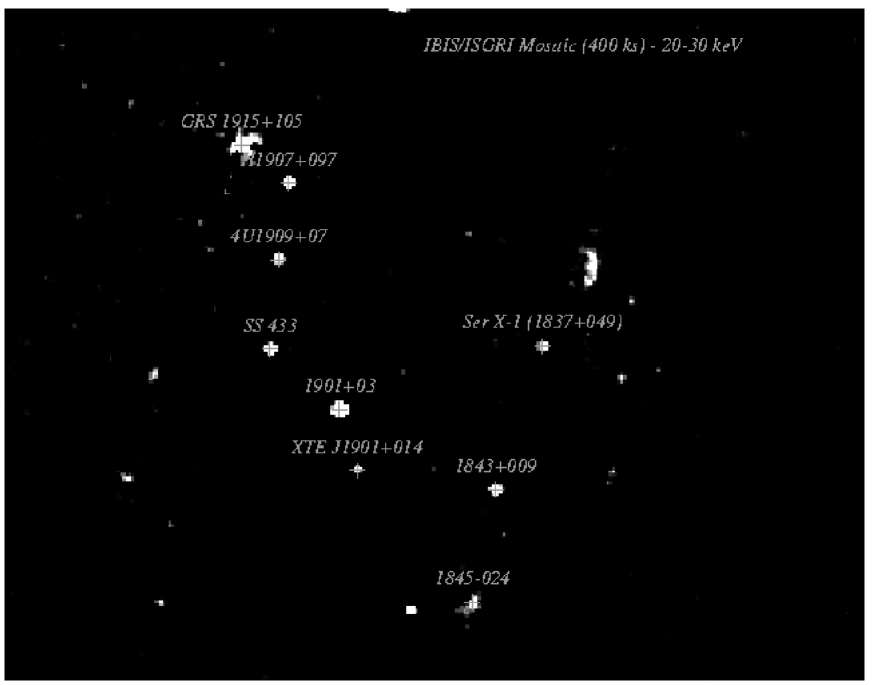
1 Introduction
The low-mass X–ray binary Ser X-1, or 4U 1837+04 is known to host a neutron star as the accreting object; it is classified as an Atoll source (e.g., Liu et al. 2001). Archival EXOSAT data (Seon & Min 2002) showed this object in the banana (i.e. high intensity) state during the observations. More recent BeppoSAX and RXTE pointing (Oosterbroek et al. 2001) caught the source while it was again in a high activity state, with an unabsorbed flux (1–200 keV) of 8.010-9 erg cm-2 s-1. Its spectrum was well described by a combination of a blackbody-like and Comptonization (Titarchuk 1994) models to account for the observed hard tail. A reflection component could not be excluded, but the data quality could not provide a definitive conclusion. Up to now, however, the X–ray emission observed from Ser X-1 with the most recent high-energy missions was never well representative of the hard (island) state which is generally seen when Atoll sources are undergoing the low intensity phase (Barret 2001).
Several X–ray bursts (lasting tens of seconds at most) were also detected from Ser X-1; moreover, during 2001, BeppoSAX pinpointed a very long (4 hours) X–ray burst (Cornelisse et al. 2002), making this source join the group of ‘superbursters’ (see Kuulkers 2003 for a review). By studying X–ray bursts observed with Einstein, Christian & Swank (1997) deduced a distance to the source of 8.4 kpc. This implies a 1–200 keV luminosity of 6.71037 erg s-1 during the BeppoSAX observation of Oosterbroek et al. (2001), which means roughly one third of the Eddington luminosity for a neutron star.
The optical counterpart to Ser X-1, located in a crowded stellar field (Thorstensen et al. 1980), was correctly identified by Wachter (1997) and, subsequently, spectroscopically confirmed and studied by Hynes et al. (2004). Very recently, the radio counterpart was discovered with the VLA (Migliari et al. 2004).
We here report on a observation of Ser X-1 performed with the INTErnational Gamma–RAy Laboratory (INTEGRAL; Winkler et al. 2003) on May 2003, i.e. less than 7 months after the launch of this spacecraft. The high spectral sensitivity of the high-energy instruments onboard this satellite are optimal to study the behaviour of the hard X–ray tail of this source in case of its presence. A more complete analysis of these data can be found in Masetti et al. (2004).
2 Observations and analysis
The observations presented here were acquired during Revolutions 67 to 69, i.e. between 12:00 UT of 3 May 2003 and 09:26 UT of 9 May 2003, for a total on-source time of of 400 ks, with the SPI (Vedrenne et al. 2003) and IBIS (Ubertini et al. 2003) instruments onboard INTEGRAL. These detectors allow an actual 20 keV – 10 MeV spectral coverage altogether. In particular, the IBIS telescope is composed of two detector layers: ISGRI (Lebrun et al. 2003), optimized for the energy range 20–200 keV, and PICsIT (Di Cocco et al. 2003; Labanti et al. 2003), covering the range from 175 keV to 10 MeV. IBIS is a coded-mask imager with a wide field of view 29∘29∘ at zero response; 9∘9∘ fully coded) and a high angular resolution of 12′, sampled in 5′/pixel in ISGRI and 10′/pixel in PICsIT. In this preliminary analysis we did not consider the data from JEM-X (Lund et al. 2003) and SPI (Vedrenne et al. 2003), the other two high-energy instruments onboard INTEGRAL.
Data were acquired with a spacecraft rectangular 55 dithering pattern mode. Unfortunately, due to pointing constraints – the present observation was amalgamated with a pointing centered on the source SS 433 (see Cherepashchuk et al. 2003) located nearly 8∘ away –, Ser X-1 was outside the field of view of the fourth instrument carried by INTEGRAL, i.e. the optical camera OMC (Mas-Hesse et al. 2003), and therefore could not be observed by it.
The IBIS data reduction and analysis was performed with the Offline
Scientific Analysis111Available through the INTEGRAL Science
Data Centre at:
http://isdc.unige.ch/index.cgi?Soft+download (OSA), version 3.0, whose
algorithms are described in Goldwurm et al. (2003). The count rates
extracted from the standard pipeline were normalized to those measured
during the observation of calibration of the Crab, performed from 22 to 24
February 2003, in order to obtain a flux evaluation in term of physical
units.
A further correction, as described in Goldoni et al. (2003), has been applied to take into account effects introduced by the off-axis position of the source with respect to the detector field of view.
3 Results
3.1 IBIS detection
Ser X-1 was well detected by ISGRI in the 20–30 keV band at a 25 level in the whole 400 ks observation. the source shows an average count rate of 0.84 cts s-1 in this band, corresponding to a flux of 6.210-11 erg cm-2 s-1.
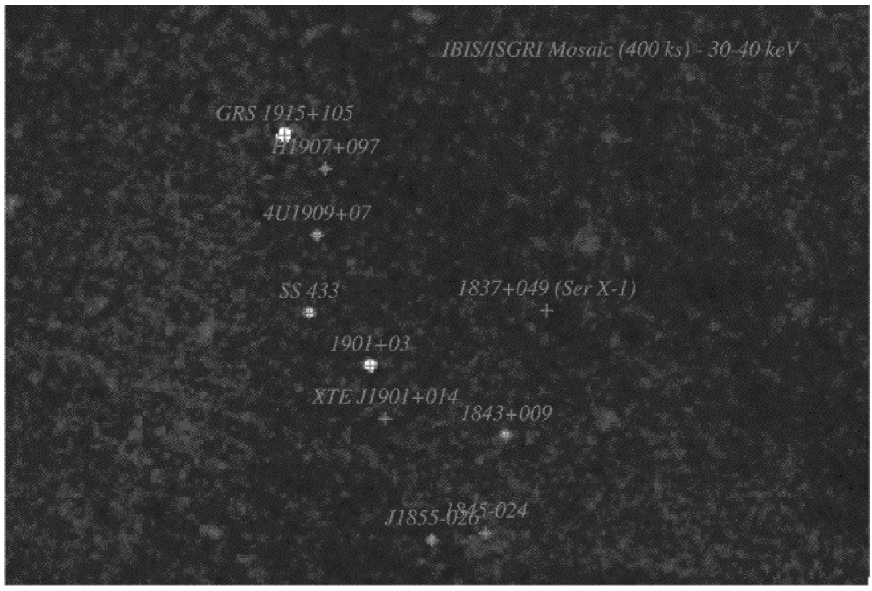
No detection of Ser X-1 was instead obtained in the 30–40 keV (ISGRI) and 220–280 keV (PICsIT) ranges down to 3 upper limits of 610-12 erg cm-2 s-1 and 110-10 erg cm-2 s-1, respectively. The upper panel of Fig. 1 shows the image of the Ser X-1 field as obtained by ISGRI in the 20–30 keV during our INTEGRAL observation, while the lower panel of Fig. 1 reports the field of Ser X-1, again imaged by ISGRI, in the 30–40 keV band.
The ISGRI source detection was at coordinates (J2000) = 18h 40m 000, = +05∘ 02′ 06′′. The significance of the detection implies a 90% confidence positional accuracy of 1′ (Gros et al. 2003). The position is fully consistent with that of the optical counterpart MM Ser (Thorstensen et al. 1980; Wachter 1997) as well as with the radio position (Migliari et al. 2004).
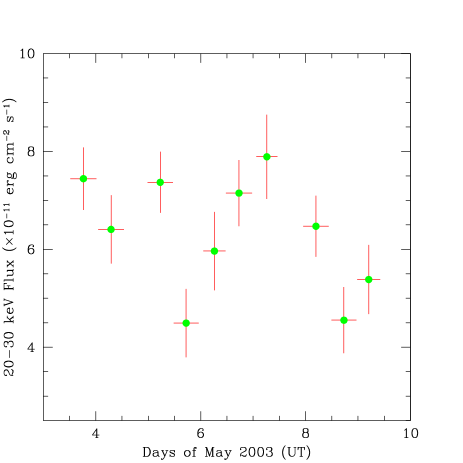
3.2 ISGRI 20–30 keV light curve
The ISGRI light curve in Fig. 2 was obtained by dividing the whole observation in 10 intervals of about 40 ks each. We chose this temporal resolution as it turned out to be the best tradeoff between the time sampling and the S/N ratio of each bin. Significant (99.99% confidence level) fluctuations are present in the light curve. This behaviour confirms the variability findings of Oosterbroek et al. (2001) in the 2–10 keV as observed with BeppoSAX.
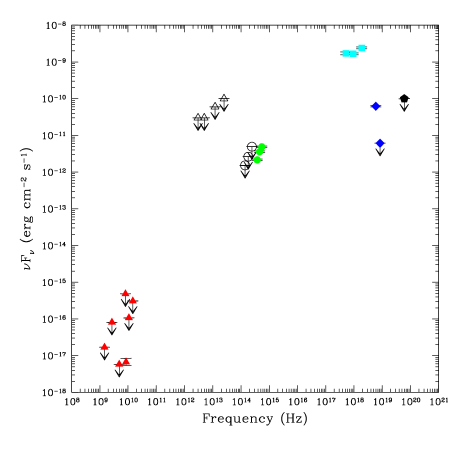
3.3 Spectral Energy Distribution (SED)
By using the ISGRI and PICsIT results, RXTE/ASM data obtained simultaneously with the INTEGRAL observations, and (non simultaneous) archival optical data (Wachter 1997), 2MASS near-infrared (Skrutskie et al. 1997), IRAS far-infrared (Beichman et al. 1988), and radio upper limits (Migliari et al. 2004; Wendker 1995 and references therein) we constructed, for the first time for Ser X-1, a broadband SED (Fig. 3) spanning from radio to –ray frequencies. Although non-simultaneous with the high-energy part of the spectrum, these lower frequency data and upper limits can give us a general description of the overall SED of this source thanks to the relative stability of its emission with time.
Optical and near-infrared data were corrected assuming a color excess
= 0.8 (e.g. Hynes et al. 2004 and references therein) and
converted into fluxes using the normalizations by Fukugita et al. (1995)
for the optical and the ones referring to the 2MASS222These
normalizations are available at:
http://www.ipac.caltech.edu/2mass/releases/
/allsky/faq.html
for the near-infrared. Given the resolution of the 2MASS survey (pixel
size: 2′′) and the crowding of the Ser X-1 field (e.g. Wachter 1997), we
considered the 2MASS near-infrared detections as conservative upper limits
to the actual source fluxes in the bands.
Acknowledgements
The results presented in this paper are based on observations with INTEGRAL, an ESA project with instruments and science data centre funded by ESA member states (especially the PI countries: Denmark, France, Germany, Italy, Switzerland, Spain), Czech Republic and Poland, and with the participation of Russia and the USA. We thank Simone Migliari for having communicated us the Ser X-1 radio detection result prior to publication. Pavel Binko is acknowledged for the help in the INTEGRAL data retrieval from the ISDC archive. This work has made use of the NASA Astrophysics Data System Abstract Service, of the SIMBAD database, operated at CDS, Strasbourg, France, and of data products from the 2MASS. ASM data were provided by the RXTE ASM teams at MIT and at the RXTE SOF and GOF at NASA’s GSFC. This research was partially funded by ASI.
References
- [1] Barret, D. 2001, Adv. Sp. Res., 28, 307
- [2] Beichman, C., Neugebauer, G., Habing, H.J., Clegg, P.E., & Chester, T.J. (eds.) 1988, IRAS Catalogs and Atlases Explanatory Supplement (Washington, DC: GPO), NASA RP-1190, vol. 1
- [3] Cherepashchuk, A.M., Sunyaev, R.A., Seifina, E.V., et al. 2003, A&A, 411, L441
- [4] Christian, D.J., & Swank, J.H. 1997, ApJS, 109, 177
- [5] Cornelisse, R., Kuulkers, E., in ’t Zand, J.J.M., Verbunt, F., & Heise, J. 2002, A&A, 382, 174
- [6] Di Cocco, G., Caroli, E., Celesti, E., et al. 2003, A&A, 411, L189
- [7] Fukugita, M., Shimasaku, K., & Ichikawa, T. 1995, PASP, 107, 945
- [8] Goldoni, P., Bonnet-Bidaud, J.M., Falanga, M., & Goldwurm A., 2003, A&A, 411, L399
- [9] Goldwurm, A., David, P., Foschini, L., et al. 2003, A&A, 411, L223
- [10] Gros, A., Goldwurm, A., Cadolle-Bel, M., et al. 2003, A&A, 411, L179
- [11] Hynes, R.I., Charles, P.A., van Zyl, L., et al. 2004, MNRAS, 348, 100
- [12] Kuulkers, E. 2003, The observers’ view of (very) long X-ray bursts: they are super!, in proceedings of the 2nd BeppoSAX Meeting ”The Restless High-Energy Universe”, ed. E.P.J. van den Heuvel, J.J.M. in ’t Zand & R.A.M.J. Wijers, Nucl. Phys. B Suppl. Ser., in press [astro-ph/0310402]
- [13] Labanti, C., Di Cocco, G., Ferro, G., et al. 2003, A&A, 411, L149
- [14] Lebrun, F., Relay, J.P., Lavocat, P., et al. 2003, A&A, 411, L141
- [15] Liu, Q.Z., van Paradijs, J., & van den Heuvel, E.P.J. 2001, A&A, 368, 1021
- [16] Lund, N., Budtz-Jørgensen, C., Westergaard, N.J., et al. 2003, A&A, 411, L231
- [17] Mas-Hesse, J.M., Giménez, A., Culhane, J.L., et al. 2003, A&A, 411, L261
- [18] Masetti, N., Foschini, L., Palazzi, E., et al. 2004, A&A, submitted
- [19] Migliari, S., Fender, R.P., Rupen., M., et al. 2004, MNRAS, in press [astro-ph/0402600]
- [20] Oosterbroek, T., Barret, D., Guainazzi M., & Ford, E.C. 2001, A&A, 366, 138
- [21] Seon, K.-I., & Min, K.W. 2002, A&A, 395, 141
- [22] Skrutskie, M.F., Schneider, S.E., Stiening, R., et al. 1997, The Two Micron All Sky Survey (2MASS): Overview and Status, in The Impact of Large Scale Near-IR Sky Surveys, ed. F. Garzon, N. Epchtein, A. Omont, B. Burton, & P. Persi (Dordrecht: Kluwer Acad. Publ.), p. 25
- [23] Thorstensen, J.R., Charles, P.A., & Bowyer, S. 1980, ApJ, 238, 964
- [24] Titarchuk, L. 1994, ApJ, 434, 313
- [25] Ubertini, G., Lebrun, F., Di Cocco, G., et al. 2003, A&A, 411, L131
- [26] Vedrenne, G., Roques, J.-P., Schönfelder, V., et al. 2003, A&A, 411, L63
- [27] Wachter, S. 1997, ApJ, 490, 401
- [28] Wendker, H.J. 1995, A&AS, 109, 177
- [29] Winkler, C., Courvoisier, T.J.-L., Di Cocco, G., et al. 2003, A&A, 411, L1