On the nature of the flux variability during an expansion stage of a type I X-ray burst: Constraints on Neutron Star Parameters for 4U 1820-30
Abstract
Powerful Type I X-ray burst with strong radial expansion was observed from the low mass X-ray binary 4U 1820-30 with Rossi X-ray Timing Explorer on May 2, 1997. We investigate closely the flux profile during the burst expansion stage. Applying a semi-analytical model we are able to uncover the behavior of a photospheric radius and to simulate the evolution of neutron star (NS)-accretion disk system. We argue that although the bolometric luminosity is always the Eddington value , the photon flux at the bottom of the expanded envelope can decrease during the expansion stage. In fact, at the initial moment of explosion when the bottom burning temperature is K, the bottom flux is a few times the Eddington limit, because the electron cross-section is a few times less than the Thomson cross-section at such a high temperatures. The surplus of energy flux with respect to the Eddington, , goes into the potential energy of the expanded envelope. As cooling of the burning zone starts the surplus decreases and thus the envelope shrinks while the emergent photon flux stays the same . At a certain moment the NS low-hemisphere, previously screened by the disk, becomes visible to the observer. Consequently, the flux detected by the observer increases. Indeed, we observe to the paradoxical situation when the burning zone cools, but the apparent flux increases because of the NS-accretion disk geometry. We demonstrate a strong observational evidence of NS-accretion disk occultation in the behavior of the observed bolometric flux. We estimate the anisotropy due to geometry and find that the system should have a high inclination angle. Finally, we apply an analytical model of X-ray spectral formation in the neutron star atmosphere during burst decay stage to infer NS mass-radius relation.
1 Introduction
4U 1820-30 is one of the brightest low mass X-ray binaries (LMXB). It resides in the globular cluster NGC 6624. Extremely short 685-second orbital period discovered by Stella et al. (1987) from EXOSAT observations implied that the system is ultra-compact and the secondary is a low-mass helium reach degenerate star. Using the analysis of UV diagrams of NGC 6624 Vacca, Lewin & van Paradijs (1986, VLP hereafter) evaluate the distance to be 4U 1820-30 by kpc, while the optical observations give a distance estimate of 7.6 kpc (Rich, Minniti & Liebert, 1993). RXTE observations revealed 4U 1820-30 as a prominent source of kilohertz quasi-periodic oscillations (Smale, 1997). Type I X-ray bursts (Lewin, van Paradijs & Taam, 1993; Strohmayer & Bildsten, 2003) from 4U 1820-30 were discovered by (Grindlay et al., 1976). It is now well established that these short ( s) outbursts of energy are due to the unstable thermonuclear burning of hydrogen/helium mixture at the bottom of the NS atmosphere accumulated by accretion process. SAS-3 observations showed strong evidence that X-ray bursts are seen only in its low-intensity state (Clark et al., 1984). All bursts observed from 4U 1820-30 show the radial expansion with an apparent photospheric radius increase by a factor of . Such an expansion is accompanied by spectral softening which moves the spectrum completely out of X-ray bandwidth and results in a so called “precursor” effect (see Strohmayer & Bildsten, 2003, and references therein). A several hour long “superbursts” was observed from 4U 1820-30 on September 9, 1999. It is now believed that superbursts are caused by the burning in the carbon ashes produced by Type I bursts (Strohmayer & Brown, 2002).
Ebisuzaki, Hanawa & Sugimoto (1983) were first to study hydrodynamics of an illuminated atmosphere of X-ray burst at the peak (Eddington) flux. Subsequently, the X-ray spectral formation along with hydrodynamics during expansion and decay stage of Type I bursts were studied in Titarchuk (1994), hereafter T94. Further development of the expansion stage solution is presented in Shaposhnikov & Titarchuk (2002), hereafter ST02. In these papers the important effect of the radiative expansion was pointed out. Specifically, while the emergent photon luminosity is always the Eddington, , the photon flux at the bottom of the expanded envelope can reach a value of a few times greater than the Eddington limit. Indeed, at the initial moment of explosion when the bottom burning temperature is K the bottom flux is a few times more than Eddington luminosity, because the electron cross-section is a few times less than the Thomson cross-section for such a high temperatures (see below Eq. 1). The surplus of energy flux with respect to the Eddington limit, goes into the potential energy of the expanded envelope. As cooling of the burning zone starts, the surplus decreases and thus the envelope shrinks (contraction stage of the radial expansion phase) while the emergent photon flux stays the same . Shaposhnikov, Titarchuk & Haberl (2003), hereafter STH, draw attention to the fact that at the certain moment of the contraction stage the NS low-hemisphere becomes visible to the observer, having previously been screened by the disk. In this paper we provide more details into the physical insight of this phenomenon and its relation to the data.
The spectral formation theory, employed in the present work, accounts for the effects of Comptonization, free-free absorption and emission. Analytical expressions are derived for color factors, and the spectral shapes are presented as functions of the input parameters: atmospheric chemical composition, NS mass, radius and the source distance. This technique was first applied to EXOSAT data from 4U 1820-30 and 4U 1705-44 in Haberl & Titarchuk (1995), hereafter HT95. In case of 4U 1820-30 data from seven bursts was used. For fixed valued of NS mass within the range 0.8-1.8 authors constrained NS radius using assumed source distance of 6.4 kpc. In particular, for kpc and they obtained the radius value of 7 km. In Titarchuk & Shaposhnikov (2002), hereafter TS02 and STH where the technique is presented in detail, authors apply it to RXTE data from Cygnus X-2 and 4U 1728-34 respectively. In this Letter we apply this methodology in analyzing the burst from 4U 1820-30 observed by RXTE on May 2, 1997. High spectral and statistical quality of the data allows us to infer tight constrains on the NS parameters. We find strong a evidence of accretion disk-star geometry evolution, that closely resembles the behavior of 4U 1728-34. We compare our results for 4U 1820-30 with equations of state (EOSs) of NS matter.
We present the Letter in the following manner. A brief description of the data used in the analysis is given in §2. In §3 we consider the general burst phenomenology. We specifically address its behavior during the expansion stage in §3.1 and calculate photospheric radius and bottom temperature profiles. We discuss in detail different processes which may affect the behavior of the source flux during the burst expansion. We present the model and the results of its application to the burst data of 4U 1820-30 in §3.2. Specifically, we obtain the dependence of the NS mass on the radius as error contours, calculated for a set of distances to the system taken from the interval obtained by Vacca, Lewin & van Paradijs (1986). We discuss our results and come to conclusions in §4.
2 Observations
4U 1820-30 was observed by Proportional Array Counter (PCA, Jahoda et al., 1996) on May 2, 1997 under Observation ID 20075-01-05-00. All five detectors were operative during the observation. In addition to the permanent Standard1 (one energy channel, 1/8 sec time resolution) and Standard2 (129 energy channels, 16 sec time resolution) mode data, data in Event Mode with 125 s time resolution and 64 energy channels was recorded. Although the High resolution Event Mode overloaded the satellite telemetry system during the peak of X-ray bursts, this effect resulted in data loss only for three short intervals during the expansion stage and thus did not prevent us from being able to perform detailed spectral analysis of the event. The burst started at 17:33:50 Terrestrial Time. Prior the burst the source was in its low-intensity state with 3.3 erg cm-2s-1 flux in 2-10 keV energy range.
Lightcurve of the burst is presented in Strohmayer & Brown (2002) where authors compared its general properties to the characteristics of superburst. The apparent precursor in the burst lightcurve is an instrumental effect rather than being a real physical property of the burst. It is due to the significant spectral softening during strong radial expansion. Softening effect shifts the spectrum emitted by the expanded NS photosphere completely out of the PCA energy bandwidth, It is observed as a dip in PCA count rate. The initial rise of the photosphere is followed by the contraction stage when the spectrum hardens and becomes detectable by RXTE/PCA detector array. We start our spectral analysis of burst radiation beginning 2 seconds after start of the burst when the spectrum shifts back to PCA detection bandwidth.
3 Data analysis and results
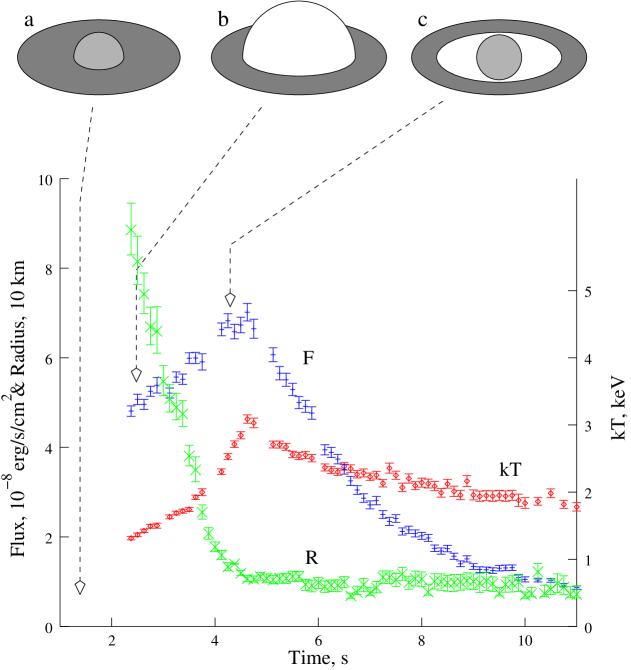
We use the standard method adopted for Type I X-ray burst temporal spectral analysis. In the reduction of RXTE spectral data we followed Recipes given in RXTE Cook Book. We first extracted spectrum of the persistent emission for 100 seconds immediately prior to the burst. We used the extracted persistent spectrum as a background for the burst spectra. During the burst we extract spectral slices for consecutive time intervals of 1/8 second. We used high resolution Event Mode for extraction of both persistent and burst spectra and we utilized Standard1 mode for calculating all appropriate count rates for deadtime corrections for the extracted spectra. Counts from all three detector layers were added during data reduction. We fitted burst spectra by the absorbed black body shape. Quality of the fits is good for the entire decay stage and for the most of the expansion episode with . We observe some excess in during particular episodes of expansion episode when goes up to . It is presumably due to the high dynamics of the atmosphere. This fact does not affect the results of our model fits for which we use only spectral data extracted from the burst decay stage. Temporal profiles of unabsorbed 0.001-100.0 keV model flux and temperature are given on Figure 1. The initial rise of the photosphere occurs in less than a second and the enormous expansion of NS atmosphere achieved within the first second of the burst. Subsequent contraction is accompanied by spectral hardening and bolometric flux growth. Temperature and flux reach their maxima of keV and erg/(cm2 s) simultaneously at the moment of photospheric “touchdown”. After that both profiles decay exponentially.
3.1 Expansion stage
The behavior of bolometric flux during the contraction of the burst atmosphere is of special importance for our analysis. As it is shown on the magnified view at the upper panel of Figure 1, observed flux gradually grows as the photosphere contracts and color temperature increases. This effect can not be explained by the gravitational redshift modulation due to collapsing radius. General relativistic (GR) effects should, conversely, result in decreasing flux. It also can not be explained by relativistic corrections for Thompson scattering opacity (Paczynski, 1983) expressed by
| (1) |
where cm2/g. Through the part of the expansion episode during which the burst spectrum is observable by PCA the photosphere temperature rises from 1 keV up to 3 keV. The corresponding factor due to the scattering opacity relativistic correction is while the flux rises by the factor .
Despite the fact that the amount of potential gravitational energy deployed into uplifted layers of the atmosphere is considerable (see discussion below), the possibility for its release in excess of the Eddintgton flux is highly questionable. The release should occur at the bottom of the atmosphere and become a part of radiation flux which is diffusing through the envelope and thus is subjected to the Eddington limit.
With any physical source of flux modulation being ruled out we conclude that the system geometry should play a leading role in determining flux behavior during photospheric contraction. Namely, one should consider the dynamic evolution of “NS-accretion disk” system geometry to understand the flux time dependence. The detailed discussion of the matter is presented in STH, where the effect of the NS-disk occultation is reported for bursts with radial expansion from 4U 1728-34. The proposed scenario of NS-accretion disk interaction proceeds in the following way. The expanded NS atmosphere effectively destroys the inner accretion disk by evaporating it and pushing it away from the star surface. The lower hemisphere of the photosphere, initially obscured from the observer by the disk, should now become visible. Radiation from the NS photosphere emerging from behind the disk inner edge results in the observed flux increase (see the top of Fig. 1 for graphical representation of different geometry states of the system). In this picture it is implicitly assumed that the build up of the inner accretion disk falls behind the photospheric contraction. This assumption is reasonable, because the near-Eddington radiation pressure should suppress the accretion until the touchdown, when radiative flux drops lower . Accretion disk comes back and reaches NS surface after several second after touchdown, presumably during decay stage of the burst (see below).
Pure helium burning is characterized by a quick and powerful energy release deeply at the bottom of the atmosphere on a time-scale of sec (for the details on nuclear burning on NS surface see review by Bildsten, 1998). The Eddington limit is exceeded and atmospheric expansion occurs. The structure of the expanded atmosphere during the burst is regulated by the bottom conditions (T94, ST02). In fact, the observed radial expansion episode lasts about seconds. Thus the photospheric contraction is not governed by free fall , but rather it is quasi-steady, since cooling off the burning zone is relatively slow process, of order seconds (see Spitkovsky et al. 2002). For the strong and extensive burst like in 4U 1820-30 the bottom temperature is K and thus the flux at the bottom is a few times larger than the Eddington limit because of the attenuation of the cross-section due to the relativistic corrections (see Eq. 1). This fact allows the super-Eddington energy rate to be effectively transfered into potential energy of the outer layers of the atmosphere which are more opaque due to lower temperatures (T94). Numerical results of ST02 show that overall energy outflow from expanded envelope stays within 1-2% of the Eddington radiation flux. In other words, the atmosphere acts as a reservoir for the surplus energy. It releases the stored energy at the Eddington rate until photosphere reaches NS surface. According to the model atmosphere the potential energy of the burst atmosphere during strong expansion can reach up to ergs. This energy supply is capable to explain the overall energetics of the event. Throughout this particular contraction stage of radial expansion episode the bottom cools off while photospheric temperature grows. The dynamic of the system can be described by a sequence of a models related to various bottom temperatures. All this picture is counterintuitive to the observer who detects only the flux at approximately the Eddington level and sees spectra that harden during this stage.
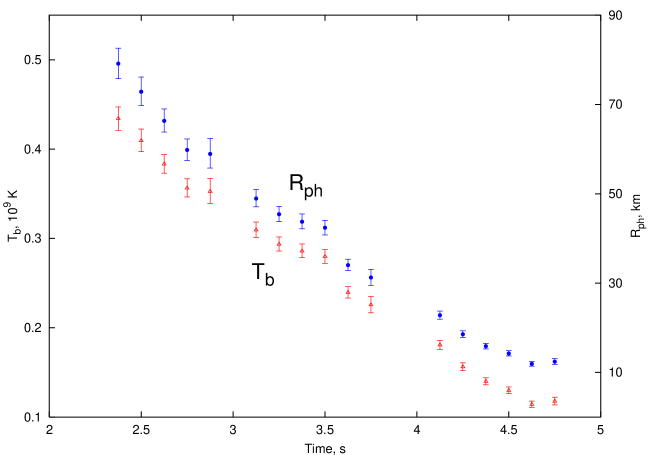
We investigate the behavior of the photospheric radius applying semi-analytical theory developed by ST02. Dependence of the various parameters of the expanded envelope is presented as functions of the observed temperature of the photosphere, its chemical composition and NS mass and radius. Using pure helium atmosphere and NS parameters obtained in the next Section for the source distance of 5.8 km (, km) we establish dependence of on and correspondingly on flux. The dependence of on is presented on Figure 2. It is important to note that these calculations are geometry independent because the color temperature is a geometry independent quantity. In fact, calculations of and (in the next section) are consistent with the geometry evolution. The hydrodynamic profiles, given by the model, allows us to evaluate the total mass of the expanded envelope. For the maximum temperature of K and given NS parameters g. The corresponding mass column of g/cm2 is an agreement with the column required for ignition (see e.g. Bildsten 1998).
The apparent flux increase during contraction of the photosphere is consistent with photospheric radius profile given by the theoretical model. In total the observed flux increase is a combination of three effects: increase due to geometry evolution, decrease due to gravitational redshift, and slight increase due to relativistic correction to opacity. The final expression for geometrical anisotropy is
| (2) |
We include this equation in our model to account for the anisotropy change during decay stage (see the next section).
3.2 Burst decay stage: NS mass and radius.
We utilized the theoretical model for the color temperature of the spectrum during the burst decay phase, i.e. after touchdown moment (see T94). Here we present the final formula for the color temperature as a function of input parameters of the problem
| (3) |
where is the NS mass in units of solar mass, is the NS radius in units of 10 km, is a helium abundance, is the dimensionless luminosity in units of the Eddington luminosity. is the color (hardening) factor, which depends on , and (TS02). Parameters of the model are , , and is the distance to the object in units of 10 kiloparsec. The luminosity is expressed by
| (4) |
where is anisotropy factor and erg/cm2s. There are strong indications that 4U 1820-30 is the pure helium accretor and bursts from this source originate in a helium-dominated environment (see Lewin, van Paradijs & Taam, 1993; Strohmayer & Bildsten, 2003; Bildsten, 1995; Cumming, 2003) so we put for the entire model fitting procedure. The model gives the functional dependence of upon which are two observables obtained from spectral fits. We fit our model to the data in the range , which approximately corresponds to , using the lower limit to exclude the data points with large errors and possible systematic effects due to prominent, persistent component. We put the upper limit on to distinguish safely from the fit the data points with where expansion of the atmosphere can occur and the validity of the model becomes restricted.
First we assume that the anisotropy of the system does not change throughout burst decay. In this case cannot be evaluated independently from distance because they come into model only as a product . We put and perform the model fits by minimizing . We use three fixed values for the distance 5,8, 6,4 and 7.0 according the error interval given by Vacca, Lewin & van Paradijs (1986), and obtain fits with . None of these fits are statistically acceptable, if we require . The model residuals have an apparent trend in their deviation from the model. For data points lie above the model while for they are below. The fit behavior for const is consistent with the disk occultation hypothesis mentioned in the previous section. According to this hypothesis the entire NS is exposed to the observer until some moment, when accretion disk returns to NS surface. We identify the time when the disk comes back with the moment of the flux drop. This occurs around seventh second of the burst when the flux falls down to erg/(cms). Just before this moment the neutron star is open viewed and thus the system has the geometry corresponding to , i. e. the disk subtends the lower NS hemisphere and the the system makes a transition to the geometry state with . We modify our model to include the effect of the disk occultation introducing two additional parameters: anisotropy during occultation and dimensionless flux at the moment when occultation occurs. In this analysis we consider only the dependence of upon the inclination angle, i. e. . We use expression (2) for a self-consistent calculation of during the model fitting. When the occultation effect is consistently incorporated into the model we obtain good quality fits with . The results are summarized in Table 1.
On Figure 3 we show the best-fit parameters and error contours for 68%, 90% and 99% confidence levels. Curves GM and FPS presents M-R relationships for nuclear matter equations of state calculated by Glendenning & Moszkovski (1991) and Friedman & Pandharipande (1981) respectively. A reader who is interested in this subject can find the details of recent developments in NS EOS theory in Heiselberg & Pandharipande (2000). These particular details are out of scope of our presentation.
The fact that during expansion stage the Eddington limit is achieved puts an additional constrain on the NS fundamental characteristics. One should observe gravitationally redshifted flux from the unocculted NS at the moment of the burst atmosphere touchdown, when both flux and temperature peak (i.e on the fifth second on Figure 1). Clearly, the dimensionless luminosity can be calculated as . Moreover, in this case the distance is not a parameter and we can calculate alternative domain in the M-R plane dictated by the observed Eddington flux. M-R values for 90% confidence level, obtained with this method, are shown by the dashed contour. M-R domains obtained with two methods depart from each other towards higher source distances. M-R domain is most consistent with distance of 5.8 kpc while the 90% contour obtained with two methods for 7.0 kpc does not overlap. This fact possibly indicates lower values for the source distance and, correspondingly, NS mass as more favorable. We fail to find the model parameters which describe the burst temperature-flux dependence for the distance of 7.6 kpc given by optical measurements.
4 Discussion and Conclusions
In this Letter we report the results of application of the theory of spectral formation during expansion and decay stage of a Type I X-ray burst using data from LMXB 4U 1820-30 collected with RXTE .
We investigate in detail the physics governing the burst properties during the expansion stage. The super-Eddington energy excess is deployed into gravitational potential energy of the expanded atmosphere which is a result of the dependence of the electron opacity on temperature. The emergent luminosity (cooling rate of the expanded atmosphere) is at the Eddington limit. When the bottom temperature drops and photospheric contraction occurs, one can intuitively expect the overall flux decrease. However the exact contrary situation is observed. The photospheric temperature increases and the bolometric flux grows presumably due to a geometrical NS recovery from behind the accretion disk inner edge. Simple arguments leads to the value of geometrically induced anisotropy of which corresponds to the local system inclination angle (see Table 1).
We infer the mass-radius relationship and error contours for a given distance by modeling the spectral temperature dependence on the bolometric flux. We include the effect of the radiation anisotropy due to change of the NS-disk geometry into consideration and we estimate the anisotropy coefficient from expansion stage behavior that is similar to 4U 1728-34 (STH). Because of the superior instrumental capabilities of RXTE mission with respect to EXOSAT satellite, the data even for one burst observed with RXTE provides us more stringent constrains on the mass-radius relation than several bursts from EXOSAT. Both statistical behavior of the model and Eddington flux limit strongly suggests that the distance to 4U 1820-30 close to 5.8 kpc, for which we obtain and km.
References
- Bildsten (1998) Bildsten, L., 1998, NATO APIC Proc. 515: The Many Faces of Neutron Stars., 419
- Bildsten (1995) Bildsten, L., 1995,ApJ, 438, 2, 852-875
- Clark et al. (1984) Clark, G.W., Li, F.K., Canizares, C., Haykava, S., Jernigan, G., Lewin, W.H.G., 1977, MNRAS, 179, 651
- Cumming (2003) Cumming, A., 2003, ApJ, 595, 2, 1077-1085
- Ebisuzaki (1987) Ebisuzaki, T., 1987, PASJ, 39, 287
- Ebisuzaki, Hanawa & Sugimoto (1983) Ebisuzaki, T., Hanawa, T., & Sugimoto, D., 1983, PASJ, 35, 17
- Friedman & Pandharipande (1981) Friedman, B., & Pandharipande, V.R., (1981), Nucl. Phys., A361, 502
- Glendenning & Moszkovski (1991) Glendenning, N., K., & Moszkovski, S., A., 1991, Phys. Rev. Lett., 67, 2414
- Grindlay et al. (1976) Grindlay, J. E., Gursky, H., Schnopper, H., 1976, ApJ, 205, L127-L130
- Haberl & Titarchuk (1995) Haberl, F., & Titarchuk, L. 1995, A&A, 299, 414 (HT95)
- Heiselberg & Pandharipande (2000) Heiselberg, H., & Pandharipande, V., 2000, Ann. Rev. Nucl. & Part. Science, 50, 481
- Jahoda et al. (1996) Jahoda, K., Swank, J.H., Giles, A.B., Stark, M.J., Strohmayer, T., Zhang, W., & Morgan, E.H., 1996, Proc. SPIE, 2808,59
- Lewin, van Paradijs & Taam (1993) Lewin, W. H. G., van Paradijs, J., & Taam, R.E., 1993, Space Sci. Rev., 62, 223
- Paczynski (1983) Paczynski, B., 1983, ApJ, 267, 315
- Rich, Minniti & Liebert (1993) Rich, R.M., Minniti, D., & Liebert, J. 1993, ApJ, 406, 489
- Shaposhnikov & Titarchuk (2002) Shaposhnikov, N., & Titarchuk, L., 2002, ApJ, 567, 1077 (ST02)
- Shaposhnikov, Titarchuk & Haberl (2003) Shaposhnikov, N., Titarchuk, L., & Haberl, F., 2003, ApJ, 593, L35 (STH)
- Spitkovsky et al. (2002) Spitkovsky, A., Levin, Y., & Ushomirsky, G., 2002, ApJ, 566, 1018
- Smale (1997) Smale, A. P., Zhang, W., White, N. E., 1997,ApJ, 483, L119
- Stella et al. (1987) Stella, L., Priedhorsky, W., White, N. E., 1987, ApJ, 312, L17-L21
- Strohmayer & Brown (2002) Strohmayer, T.E., Brown F.B., 2002, ApJ, 566, 2, 1045
- Strohmayer & Bildsten (2003) Strohmayer, T. E., Bildsten, L., 2003, in press, astro-ph/0301544
- Titarchuk (1994) Titarchuk, L., 1994, ApJ, 429, 330 (T94)
- Titarchuk & Shaposhnikov (2002) Titarchuk, L., & Shaposhnikov, N. 2002, ApJ, 570, L25 (TS02)
- Vacca, Lewin & van Paradijs (1986) Vacca, W.D., Lewin, W.H.G., & van Paradijs. J., 1986, MNRAS, 220, 339
| , kpc | , km | ||||
|---|---|---|---|---|---|
| 5.8 | 0.74 | 0.23 | |||
| 6.4 | 0.79 | 0.28 | |||
| 7.0 | 0.84 | 0.36 |