Field E+A Galaxies at Intermediate Redshifts
Abstract
We select E+A candidates from a spectroscopic dataset of field galaxies and measure the E+A fraction at to be %, a value lower than that in galaxy clusters at comparable redshifts (%). HST/WFPC2 imaging for five of our six E+A’s shows they have a heterogeneous parent population: these E+A’s span a range in half-light radius ( kpc) and estimated internal velocity dispersion ( km s-1), and they include luminous systems (). Despite their diversity in some aspects, the E+A’s share several common characteristics that indicate the E+A phase is an important link in the evolution of star-forming galaxies into passive systems: the E+A’s are uniformly redder than the blue, star-forming galaxies that make up the majority of the field, they are more likely to be bulge-dominated than the average field galaxy, and they tend to be morphologically irregular. We find E+A’s make up % of the absorption line systems in this redshift range, and estimate that % of passive galaxies in the local field had an E+A phase at .
1 Introduction
Studies show the universal star formation rate has been declining steadily since (Lilly et al. 1995; Cowie et al. 1996; Madau et al. 1996). However, why star formation in the universe has been decreasing for the last Gyr and why it ends for any given galaxy remain unanswered questions. Galaxies whose star formation ends abruptly in a burst can provide insight into these issues because they may be the link between star-forming and passive systems.
Identified in significant numbers in intermediate redshift galaxy clusters (Dressler & Gunn 1983; Couch & Sharples 1987; Tran et al. 2003a, hereafter T03a), “E+A” galaxies are characterized by strong Balmer absorption lines and weak or absent [OII] emission. They have been studied extensively in clusters (Dressler & Gunn 1983; Couch & Sharples 1987; Franx 1993; Wirth et al. 1994; Couch et al. 1994; Belloni et al. 1995; Couch et al. 1998; Fisher et al. 1998; Caldwell et al. 1999; Dressler et al. 1999; Balogh et al. 1999; Poggianti et al. 2004, T03a), and are also referred to as H-strong or “k+a” galaxies. Their distinctive spectral features are usually interpreted as being the result of a starburst (, where is the galaxy’s final total stellar mass) that ended within the last Gyr (Couch & Sharples 1987; Barger et al. 1996, although see Newberry et al. 1990 for an alternative scenario).
In addition to being in rich clusters, E+A galaxies have also been found in the field. The properties of field E+A’s have been studied extensively at low redshift (; Liu & Kennicutt 1995; Zabludoff et al. 1996; Chang et al. 2001; Norton et al. 2001; Goto et al. 2003; Quintero et al. 2004; Yang et al. 2004), but these low redshift field E+A’s do not trace star formation beyond because of the short lifetime of the E+A phase. To determine how important a role the E+A phase has in the evolution of field star-forming galaxies into passive systems, a population of field E+A galaxies at is needed.
Finding E+A galaxies is challenging because the E+A phase is visible for only Gyr (Couch & Sharples 1987; Barger et al. 1996) and E+A’s are only a small fraction of the total galaxy population at any given redshift. These difficulties are reflected in the highly uncertain estimates for the field E+A fraction at where values range from % (Hammer et al. 1997; Dressler et al. 1999; Balogh et al. 1999). Estimates of the field E+A fraction also can vary due to, e.g. selection criteria and spectral resolution. Assuming the E+A phase is associated with the transformation of an emission line galaxy into an absorption line system, a high E+A fraction would imply that the majority of passive galaxies in the nearby universe go through an E+A phase.
Given the formidable obstacle of even isolating the field E+A population at , it is no surprise then that we know very little about their physical characteristics and their progenitors. Studies of E+A’s in the nearby universe (Zabludoff et al. 1996; Caldwell et al. 1999; Galaz 2000; Norton et al. 2001; Poggianti et al. 2004; Yang et al. 2004) and in intermediate redshift clusters (Wirth et al. 1994; Dressler et al. 1999, T03a) indicate these E+A’s have a heterogeneous parent population. By examining their physical properties, we can determine if E+A’s in the intermediate redshift field are descended from a diverse population as well. This information also enables us to determine whether field E+A’s at can be the progenitors of early-type galaxies at lower redshifts.
What triggers the E+A phase remains an open question. Earlier studies suggest the E+A phase in the field is associated with galaxy-galaxy interactions (Liu & Kennicutt 1995; Yang et al. 2004; Zabludoff et al. 1996, hereafter Z96), a scenario consistent with galaxy formation models that predict interactions in the field are common (Somerville & Kolatt 1999), and that interactions trigger strong star formation episodes in gas-rich systems (Mihos & Hernquist 1994a, b). Because morphological signatures due to interactions remain visible for the duration of the E+A phase (Mihos & Hernquist 1994a, b), we should find E+A’s to be morphologically disturbed if the E+A phase is associated with galaxy-galaxy interactions.
To measure the field E+A fraction at intermediate redshifts, we draw from an extensive spectroscopic survey of four different fields. Our unique dataset contains an unsually large number of spectroscopically confirmed field galaxies () gathered over a total area of ; our survey is larger than that of any other previous field E+A study in this redshift range. Using the wide-field HST/WFPC2 imaging that we have obtained as part of our cluster program, we also characterize the physical properties of the field E+A population to better understand the role E+A’s have in the evolution of star-forming galaxies into passive systems.
We summarize our observations in §2, describe our E+A selection criteria and determine the field E+A fraction in §3, and detail the physical properties of the field E+A population in §4. We discuss the importance of the E+A phase in §5 and present our conclusions in §6. Unless otherwise noted, we use , and km s-1 Mpc-1 in this paper.
2 Summary of Observations and Data
We select E+A galaxies from a major program to study four fields with HST/WFPC2 imaging and ground-based spectroscopy. The three lower redshift fields are centered on X-ray luminous clusters at , and the fourth on a QSO at . Our dataset combines HST/WFPC2 mosaics of pointings in each field with extensive redshift surveys completed primarily with Keck/LRIS (Oke et al. 1995). From 1500 redshifts obtained in a total area of , we isolate 797 field galaxies. The observational details of each field are in Table 1. Here we describe briefly the spectra and photometry used in this paper.
2.1 Spectroscopy
As a significant benefit of our large program to study galaxy evolution in clusters, we have obtained redshifts for a large sample of field galaxies to . During multiple observing runs from June 1996 to July 2001, multi-slit spectra in the MS2053, MS1054, and 3C336 fields were obtained with Keck/LRIS. Targets in the MS2053 field were selected using a magnitude cut of , and in both the MS1054 and 3C336 fields the magnitude cut was . Spectra in the CL1358 field were collected at the WHT and MMT where the primary targets were selected to have . Details of the target selection, spectral reduction, wavelength calibration, sky subtraction, and removal of telluric absorption are in Fisher et al. (1998), Tran et al. (1999), van Dokkum et al. (2000), Tran (2002), and Magee et al. (2004).
Galaxies were assigned redshifts using IRAF cross-correlation routines as well as by visual inspection of each individual spectrum. Each redshift was given a quality flag where corresponded to definite, probable, and maybe (single emission line). In our analysis, we consider only galaxies with a redshift quality flag of ; this brings the cumulative field sample to 797 galaxies at . Figure 1 (bottom panel) shows the redshift distribution of our field sample for galaxies at . Note we do not include here the cluster members identified in these fields; all galaxies with redshifts within of a given cluster’s mean redshift were excised from the field sample.
2.2 HST/WFPC2 Imaging
The four fields were imaged by HST/WFPC2 in the F606W and F814W filters; each image mosaic was made of overlapping pointings. The image reduction and photometry are detailed for CL1358, MS2053, MS1054, and 3C336 in van Dokkum et al. (1998), Hoekstra et al. (2000), van Dokkum et al. (2000), and Magee et al. (2004) respectively. Following the method outlined in van Dokkum & Franx (1996), we transform from the WFPC2 filter system to redshifted Johnson magnitudes using:
| (1) |
where the constants depend on the galaxy’s redshift and were calculated for an E/S0 galaxy spectral energy distribution (Pence 1976). colors were measured using a diameter aperture.
3 Field E+A Sample
The E+A fraction depends strongly on how E+A galaxies are selected. Although authors generally include [OII] in their selection criteria, they differ on which Balmer lines to use and equivalent width limits to adopt (Dressler & Gunn 1983; Couch & Sharples 1987; Balogh et al. 1999; Dressler et al. 1999, Z96). For example, the E+A fraction in a given sample can differ by as much as a factor of two if [OII] and only H are used as selection criteria compared to a combination of [OII] and all three Balmer lines, and the E+A fraction from requiring a Balmer equivalent width of Å will be smaller than that measured using Å. Here we describe our stringent E+A selection criteria and estimate the field E+A fraction at intermediate redshifts ().
3.1 E+A Selection
To determine the field E+A fraction at intermediate redshifts, we define an average Balmer index
| (2) |
We consider only galaxies at with , and for which [OII], H, and H were included in the spectral range. These strict criteria reduce the original sample of 797 galaxies to 220 (Fig. 1, bottom). We select E+A galaxies as having HH Å and no significant [OII] emission ( Å). The bandpasses used to determine the equivalent widths of these features are the same as those used in Fisher et al. (1998) and T03a.
Although combining the three Balmer lines to select E+A’s is the most robust approach (Newberry et al. 1990), this is not possible for all the galaxies due to the large redshift range covered by our survey. In addition, H becomes severely compromised by skylines at . As in our cluster survey (T03a), we apply a signal to noise cut () to the entire field sample to ensure the E+A sample is not contaminated by nearby spectral types; this is comparable to selecting galaxies with [OII], H, and H equivalent width errors of Å.
Using these selection criteria, we identify ten E+A candidates in our field sample. Visual inspection of these candidates find four to be spurious due to, e.g., problems with removal of night sky features. We list the six field E+A galaxies that satisfy our stringent selection process with their [OII] and Balmer equivalent widths in Table 2. Their 1D spectra are shown in Fig. 2, and Fig. 3 shows their co-added spectrum where the mean redshift is .
3.2 Field E+A Fraction
The field E+A fraction at is %, a factor of four lower than typically found in galaxy clusters at comparable redshifts111Note that while the difference in the E+A fraction between field and cluster environment is secure, the overall frequency of E+A galaxies may vary depending on the luminosity limit of a given sample. (%; T03a). We emphasize that because the field and cluster E+A’s were selected using the exact same criteria, we circumvent problems associated with comparing between different surveys. The large difference in the field and cluster E+A fractions at is therefore unlikely to be the result of selection effects.
If we apply Z96’s more conservative definition of an E+A galaxy ([OII]Å, [HHHÅ) to our sample, only one galaxy (2053-2700) would be considered an E+A. In this case, the post-starburst fraction of % is comparable to the low value measured by Z96 from the LCRS (0.2%). Such a low fraction emphasizes the rarity of strong post-starburst galaxies even in the intermediate redshift field.
One unexpected result is how strongly the E+A fraction varies between the four fields. Given four of the six E+A’s lie in only one field (MS2053), it is not so surprising then that different groups sampling relatively small areas find widely varying E+A fractions for the intermediate redshift field (e.g. %; Hammer et al. 1997; Balogh et al. 1999; Dressler et al. 1999). This highlights the fact that large areas are needed to study E+A galaxies because they are so rare.
4 Physical Properties
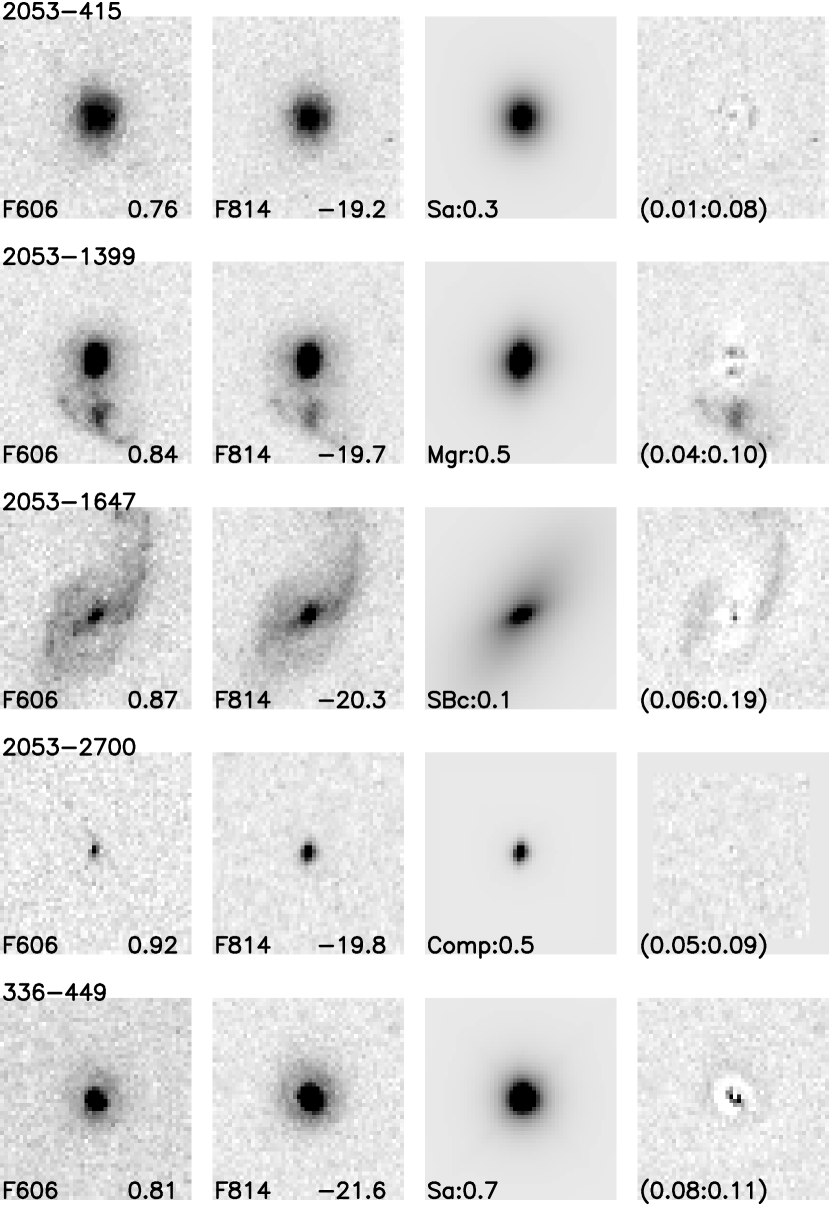
By pairing HST/WFPC imaging with extensive spectroscopic surveys, we have the unprecedented opportunity to study in detail the physical properties of the field E+A population at . The rarity of these objects has been a formidable obstacle in studying this population, so it is no surprise that the physical characteristics of intermediate redshift field E+A’s are virtually unknown. Here we examine their luminosities, colors, structural parameters, estimated internal velocity dispersions, and environment to better understand the origin of the E+A phase and its role in galaxy evolution. The properties of the five E+A’s that fall on the HST/WFPC2 imaging are listed in Table 3, and their thumbnail images are shown in Fig. 4.
4.1 Luminosity
Previous studies of E+A galaxies in both the field and in clusters suggest that E+A’s must have a heterogenous parent population because of their wide range in luminosity (e.g. Wirth et al. 1994; Caldwell et al. 1999, Z96). We cannot address this issue as our spectroscopic limits imply that we are biased towards the brightest E+A galaxies. However, we note that the E+A’s in our sample include very luminous systems (); even if the brightest E+A’s fade by as much as mag (Couch & Sharples 1987; Barger et al. 1996), they will remain systems.
4.2 Color
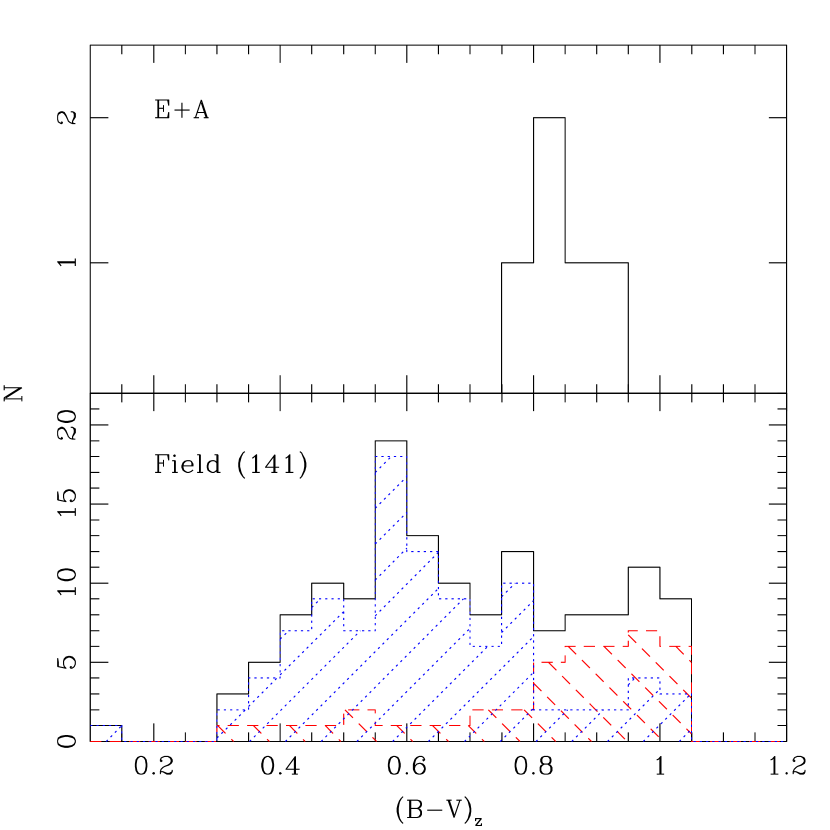
From the HST/WFPC2 imaging, we measure for 141 field galaxies (of 220; see §3.1 for selection) and five E+A’s; the color distribution of both populations are shown in Fig. 5. There is a striking difference in the E+A color distribution compared to the field: E+A’s are uniformly redder than the blue, star-forming galaxies that make up the majority of the field. Using the Kolmolgorov-Smirnov test (Press et al. 1992), we find the E+A color distribution differs from that of the field sample with % confidence. If we consider only the emission line galaxies ([OII]Å), the E+A color distribution differs with 99.7% confidence, whereas the E+A color distribution is indistinguishable from that of the absorption line galaxies ([OII]Å).
One might expect the E+A’s to be blue since the E+A phase is associated with a recent starburst. However, models show that E+A’s remain as blue as actively star-forming galaxies for only a fraction of the total time the E+A phase is visible ( Gyr vs. 1.5 Gyr; Barger et al. 1996). Thus E+A’s can evolve quickly away in color from the blue envelope of field galaxies at to join the red population at . The colors of our E+A galaxies are consistent with them being the progenitors of some absorption line galaxies. The fact that these E+A’s are red indicates that colors alone are not sufficient to identify galaxies that were recently star forming systems.
4.3 Half-light Radius
For galaxies that fall on the HST/WFPC2 imaging, our analysis includes structural parameters determined from 2D de Vaucouleurs bulge+exponential disk decompositions fit with GIM2D (Simard et al. 1999, 2002). From these surface brightness fits, we obtain bulge-to-total ratios () and half-light radii, as well as the galaxy residuals and . and are the residuals contained in an asymmetric and symmetric component, respectively, and quantify how much a galaxy’s profile deviates from a bulge+disk model; they are measured by subtracting the best-fit model from the galaxy image (Tran et al. 2001, 2003b).
The field E+A’s include both compact ( kpc) systems and large disks ( kpc). The half-light radii for four of the E+A’s is comparable to values measured for E+A’s in clusters ( kpc; T03a). However, we note the inclusion of one unusually large galaxy (2053–1647; kpc) that is also the most disky E+A in our sample. Because our spectroscopy is biased towards the central regions, the E+A phenomenon may be localized to 2053–1647’s “bulge”; only with fully integrated spectra can we determine if the entire galaxy is going through an E+A phase.
4.4 Morphology
From the de Vaucouleurs bulge+exponential disk fits, we find the E+A’s are more likely to be bulge-dominated systems (; Tran et al. 2001) than the average field galaxy: 60% of the E+A’s are bulge-dominated compared to % of the field (Simard et al. 2002). Interestingly, both Quintero et al. (2004) and Yang et al. (2004) also find that nearby post-starburst galaxies () tend to be bulge-dominated systems.
All the E+A’s have bright, centrally concentrated light profiles, similar to what Caldwell et al. (1999) find in their study of post-starburst galaxies in Coma. From the smooth light profiles of their E+A’s, Caldwell et al. (1999) suggested that the starburst preceding the E+A phase was probably an event localized in the galaxy’s center and not due to, e.g., clumpy star-forming regions spread throughout a larger disk. However, removal of the 2D model from the E+A’s in our field sample shows that three (2053-415, 2053-1399, & 2053-1647) have clumpy, non-axisymmetric structure in addition to a bright central region (Fig. 4, right). Unlike the E+A’s in Coma, our field E+A’s show both centralized bright regions and extended, clumpy star formation. As noted in §4.3, the E+A phenomenon may be associated primarily with the “bulge” component in these systems.
4.5 Evidence of Recent Interactions
Past studies of E+A’s in the nearby field suggest the E+A phenomenon is associated with galaxy-galaxy encounters (Liu & Kennicutt 1995; Yang et al. 2004, Z96). If the E+A phase was triggered by a recent interaction, we would expect the E+A’s to be morphologically disturbed because such features remain visible for the duration of the E+A phase (Mihos & Hernquist 1994a, b). We find four of the five field E+A’s with WFPC2 imaging have elevated degrees of galaxy asymmetry () and/or total residuals (; Schade et al. 1996; Tran et al. 2001); one is even visually typed as a merger. These results are consistent with the E+A phase being associated with galaxy-galaxy interactions.
4.6 Estimated Internal Velocity Dispersions
Because internal velocity dispersion () is a useful tracer of the galaxy’s total mass, we estimate for the E+A’s that have and structural parameters measured from HST/WFPC2 imaging. As described in Kelson et al. (2000) and T03a, we can use colors to correct the mass-to-light ratios of the galaxies and so estimate the internal velocity dispersions of these systems. In this method, we essentially evolve the E+A’s by fading and reddening them until they lie on the color magnitude relation (CMR) defined by a passively evolving galaxy population; here we use the CMR normalized to the early-type galaxies in MS1054 (). We also correct the E+A’s for simple fading as determined from the Fundamamental Plane (; van Dokkum et al. 1998).
We find the field E+A’s span a large range in estimated internal velocity dispersion: km s-1 (Table 3). The two field E+A’s with the largest are also the two highest redshift systems. It may be that 1) the mass distribution of field E+A’s evolves with redshift and/or 2) the fraction of field E+A’s increases with redshift. It is interesting to note that there are at least a few field E+A’s at with measured km s-1 (Norton et al. 2001). However, the current sample sizes are too small to determine whether the field E+A dispersion distributions differ between low and intermediate redshifts.
4.7 Environment
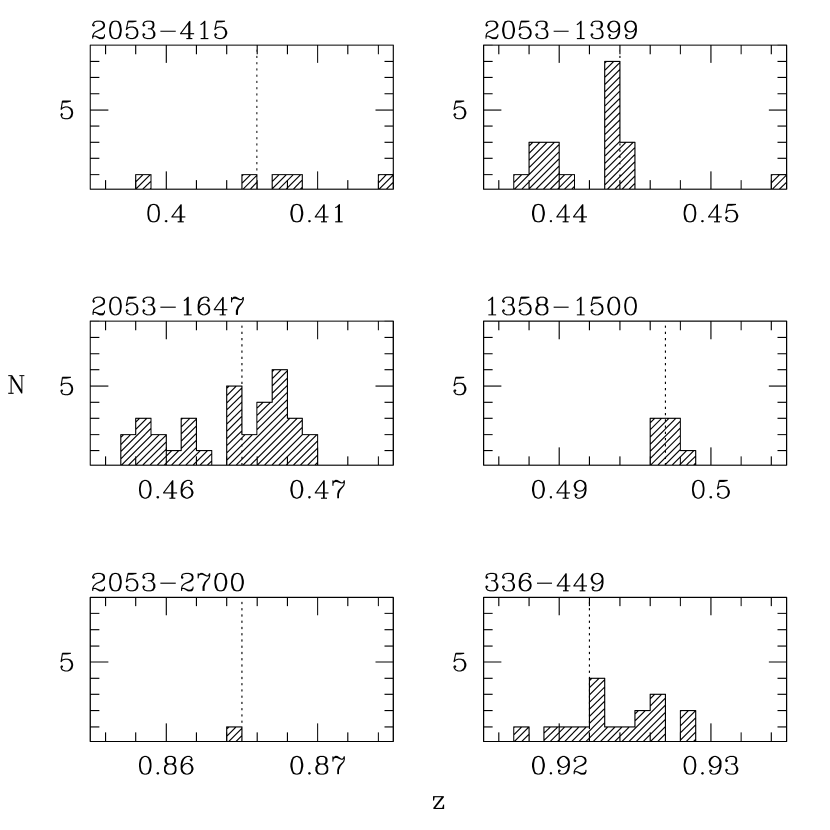
Z96 originally suggested that most E+A’s lie in galaxy groups because galaxy-galaxy interactions occur more frequently in groups than in the field. Because the majority of field galaxies are in groups, we would expect that most of the E+A’s are also in groups. To test whether our E+A’s lie in environments similar to that of a typical field galaxy, we use our entire field redshift sample at to estimate the average number of redshift neighbors each E+A has. Here we consider a galaxy to be a neighbor if its redshift is within km s-1 of the E+A and it is in the same field; the redshift distribution of galaxies near each E+A is shown in Fig. 6. The average field E+A in our survey has neighbors, a value consistent with the number of neighbors an average field galaxy has (); here we asssume a Poissonian distribution to estimate the errors. This indicates that like most field galaxies, field E+A’s tend to lie in galaxy groups even at intermediate redshifts.
5 Discussion
Because the E+A galaxies are found in both the field and clusters at redshifts up to , they can place constraints on galaxy formation models. Models must not only produce E+A’s but also how the E+A fraction varies with environment. Here we discuss in greater detail the importance of E+A galaxies and how they provide interesting constraints for galaxy evolution models.
5.1 Where Are the E+A’s?
Like E+A galaxies in the nearby universe (Z96; Quintero et al. 2004), the majority of E+A’s at are in the field/group environment. Assuming 10% of galaxies are in clusters (Gómez et al. 2003) and the E+A fraction in clusters and the field is 10% and 3% respectively, we find . However, the elevated E+A fraction in clusters indicates environment does have an important role in triggering the E+A phase. Most likely additional cluster processes, e.g. galaxy harassment and/or interactions with a hot intracluster medium (Caldwell et al. 1999; Poggianti et al. 2004), can also trigger an E+A phase.
5.2 Importance of the E+A Phase
To determine whether the E+A phase has an significant role in the conversion of emission line galaxies into absorption line systems, we estimate the fraction of absorption line systems in the field that have undergone an E+A phase by . In our field sample of 220 galaxies at , we have 66 absorption line ([OII]Å) and 154 emission line ([OII]Å) systems. The field E+A fraction when considering only absorption line galaxies is %. Combining this fraction with the elapsed time between and ( Gyr; km s-1 Mpc-1, , ) and assuming the E+A phase is visible for 1.5 Gyr (Couch & Sharples 1987; Barger et al. 1996), we estimate % of absorption line galaxies in the local field had an E+A phase at . These results show that E+A’s can be an important link in the evolution of star-forming galaxies into passive systems in the field.
If all E+A’s evolve into early-type galaxies, they play a vital role in the evolution of these objects. If we consider only the field galaxies morphologically typed as early-types (E/S0; 24), the fraction that have undergone an E+A phase since increases to %. Thus E+A’s can be as important to the evolution of early-type galaxies in the field as in galaxy clusters.
It is interesting to compare the fraction of early-type galaxies that have undergone an E+A phase at to early-type field galaxies at . From a co-added spectrum of 10 early-types in the HDF-N (), van Dokkum & Ellis (2003) find enhanced H absorption and postulate that these early-types experienced a recent starburst. Our estimate that % of early-type galaxies in the nearby field had an E+A phase since shows that early-types can have starbursts at as well.
5.3 Major versus Minor Mergers
The high fraction of morphologically irregular field E+A’s (%) suggests these systems are associated with galaxy-galaxy interactions, e.g minor or major mergers. Here we attempt to distinguish between the two types of interactions. All the field E+A’s have the bright, centrally concentrated light profiles normally associated with minor mergers (Mihos & Hernquist 1994a) but some also have the clumpy, extended star forming regions that are usually created in major mergers (Barnes & Hernquist 1996). Using their bulge/disk values, it may be possible to discriminate between these two viable mechanisms: minor mergers can trigger a central starburst but allow the disk to survive (Walker et al. 1996) whereas major mergers effectively destroy any disk component (Barnes & Hernquist 1992, 1996; Naab et al. 1999).
Of the five E+A’s in our sample with WFPC2 imaging, four have significant disk components (). The retention of these disks suggests that minor mergers are the primary driver of the E+A phase in the field. However, we stress that a considerably larger field E+A sample is needed to test this hypothesis since, e.g., we may not be observing the E+A’s in their final morphological state.
5.4 E+A Frequency: A Constraint on Formation Models
We find the field E+A fraction at is %, but is this too low for current galaxy formation models? Hierarchical models conservatively predict % of field galaxies () have had a minor/major merger since (Lacey & Cole 1994; Somerville & Kolatt 1999, Gyr). Assuming 1) 5% of field galaxies had a galaxy-galaxy interaction at ( Gyr) within the last 2 Gyr of it being observed and 2) that these interactions trigger strong episodes of star formation (Mihos & Hernquist 1994a, b), we would expect to have starburst/post-starburst galaxies in our sample. Using a timescale of 0.5 Gyr for the starburst and 1.5 Gyr for the post-starburst phase (Dressler & Gunn 1983; Barger et al. 1996) implies we should have field E+A’s, a value consistent with the number we actually find.
While our approach has several caveats, this exercise illustrates how the field E+A fraction at intermediate redshifts can be an interesting constraint on galaxy formation models. A viable model cannot significantly over/under-predict the field E+A fraction, and it must account for the % of absorption line galaxies in the nearby field that had an E+A phase at . It should also account for the % of early-type galaxies in clusters that had an E+A phase at (T03a).
6 Conclusions
We select E+A galaxies from a spectroscopic dataset of field galaxies and measure the E+A fraction in the intermediate redshift field () to be %. Because we select the field E+A’s in the exact same manner as E+A’s in galaxy clusters at comparable redshifts, we can compare directly how the E+A fractions differ between the two environments. We find the E+A fraction in the field is a factor of four smaller than that observed in intermediate redshift galaxy clusters (%; T03a). However, most E+A galaxies (%) lie in the field because only a small fraction of galaxies are in clusters.
From HST/WFPC2 imaging, we present first results on the physical properties of field E+A’s at . The five E+A galaxies that fall on the WFPC2 mosaics include luminous systems (), and they span a range half-light radius ( kpc) and estimated internal velocity dispersion ( km s-1). These properties indicate that like their lower redshift counterparts, the E+A’s in the intermediate redshift field have a heterogeneous parent population.
Despite being descended from a variety of progenitors, these E+A’s have several characteristics in common. Compared to the general field population, the E+A’s are uniformly redder than the blue, star-forming galaxies that make up the majority of the field. These E+A’s also are more likely than the average field galaxy to be a bulge-dominated system, and they tend to be morphologically irregular. These characteristics indicate the E+A phase is associated with galaxy-galaxy interactions, and that E+A’s are an important link between star-forming and passive galaxies.
We find E+A’s make up % of the absorption line galaxies at . Combining this with timescale arguments, we estimate that % of passive galaxies in the nearby field had an E+A phase at . This fraction increases to % if we consider only galaxies that are morphologically typed as E/S0’s. Our study demonstrates that the E+A phase can have as significant a role in how galaxies evolve into early-type systems in the field as in galaxy clusters. However, we recognize our results are based on a small sample of E+A’s, and we stress that additional studies of this interesting population are needed.
References
- Balogh et al. (1999) Balogh, M. L., Morris, S. L., Yee, H. K. C., Carlberg, R. G., & Ellingson, E. 1999, ApJ, 527, 54
- Barger et al. (1996) Barger, A. J., Aragon-Salamanca, A., Ellis, R. S., Couch, W. J., Smail, I., & Sharples, R. M. 1996, MNRAS, 279, 1
- Barnes & Hernquist (1992) Barnes, J. E. & Hernquist, L. 1992, ARA&A, 30, 705
- Barnes & Hernquist (1996) —. 1996, ApJ, 471, 115
- Belloni et al. (1995) Belloni, P., Bruzual, A. G., Thimm, G. J., & Roser, H.-J. 1995, A&A, 297, 61
- Caldwell et al. (1999) Caldwell, N., Rose, J. A., & Dendy, K. 1999, AJ, 117, 140
- Chang et al. (2001) Chang, T., van Gorkom, J. H., Zabludoff, A. I., Zaritsky, D., & Mihos, J. C. 2001, AJ, 121, 1965
- Couch et al. (1998) Couch, W. J., Barger, A. J., Smail, I., Ellis, R. S., & Sharples, R. M. 1998, ApJ, 497, 188
- Couch et al. (1994) Couch, W. J., Ellis, R. S., Sharples, R. M., & Smail, I. 1994, ApJ, 430, 121
- Couch & Sharples (1987) Couch, W. J. & Sharples, R. M. 1987, MNRAS, 229, 423
- Cowie et al. (1996) Cowie, L. L., Songaila, A., Hu, E. M., & Cohen, J. G. 1996, AJ, 112, 839
- Dressler & Gunn (1983) Dressler, A. & Gunn, J. E. 1983, ApJ, 270, 7
- Dressler et al. (1999) Dressler, A., Smail, I., Poggianti, B. M., Butcher, H., Couch, W. J., Ellis, R. S., & Oemler, A. J. 1999, ApJS, 122, 51
- Fabricant et al. (2004) Fabricant, D., Franx, M., & van Dokkum, P. 2004, in prep
- Fisher et al. (1998) Fisher, D., Fabricant, D., Franx, M., & van Dokkum, P. 1998, ApJ, 498, 195+
- Franx (1993) Franx, M. 1993, PASP, 105, 1058
- Gómez et al. (2003) Gómez, P. L., Nichol, R. C., Miller, C. J., Balogh, M. L., Goto, T., Zabludoff, A. I., Romer, A. K., Bernardi, M., Sheth, R., Hopkins, A. M., Castander, F. J., Connolly, A. J., Schneider, D. P., Brinkmann, J., Lamb, D. Q., SubbaRao, M., & York, D. G. 2003, ApJ, 584, 210
- Galaz (2000) Galaz, G. 2000, AJ, 119, 2118
- Goto et al. (2003) Goto, T., Nichol, R. C., Okamura, S., Sekiguchi, M., Miller, C. J., Bernardi, M., Hopkins, A., Tremonti, C., Connolly, A., Castander, F. J., Brinkmann, J., Fukugita, M., Harvanek, M., Ivezic, Z., Kleinman, S. J., Krzesinski, J., Long, D., Loveday, J., Neilsen, E. H., Newman, P. R., Nitta, A., Snedden, S. A., & Subbarao, M. 2003, PASJ, 55, 771
- Hammer et al. (1997) Hammer, F., Flores, H., Lilly, S. J., Crampton, D., Le Fevre, O., Rola, C., Mallen-Ornelas, G., Schade, D., & Tresse, L. 1997, ApJ, 481, 49
- Hoekstra et al. (2000) Hoekstra, H., Franx, M., & Kuijken, K. 2000, ApJ, 532, 88
- Kelson et al. (2000) Kelson, D. D., Illingworth, G. D., van Dokkum, P. G., & Franx, M. 2000, ApJ, 531, 184
- Lacey & Cole (1994) Lacey, C. & Cole, S. 1994, MNRAS, 271, 676
- Lilly et al. (1995) Lilly, S. J., Tresse, L., Hammer, F., Crampton, D., & Le Fevre, O. 1995, ApJ, 455, 108
- Liu & Kennicutt (1995) Liu, C. T. & Kennicutt, R. C. 1995, ApJ, 450, 547
- Madau et al. (1996) Madau, P., Ferguson, H. C., Dickinson, M. E., Giavalisco, M., Steidel, C. C., & Fruchter, A. 1996, MNRAS, 283, 1388
- Magee et al. (2004) Magee, D., Tran, K., Illingworth, G., Kelson, D. D., van Dokkum, P., & Franx, M. 2004, in prep
- Mihos & Hernquist (1994a) Mihos, J. C. & Hernquist, L. 1994a, ApJ, 425, L13
- Mihos & Hernquist (1994b) —. 1994b, ApJ, 431, L9
- Naab et al. (1999) Naab, T., Burkert, A., & Hernquist, L. 1999, ApJ, 523, L133
- Newberry et al. (1990) Newberry, M. V., Boroson, T. A., & Kirshner, R. P. 1990, ApJ, 350, 585
- Norton et al. (2001) Norton, S. A., Gebhardt, K., Zabludoff, A. I., & Zaritsky, D. 2001, ApJ, 557, 150
- Oke et al. (1995) Oke, J. B., Cohen, J. G., Carr, M., Cromer, J., Dingizian, A., Harris, F. H., Labrecque, S., Luciano, R., Schaal, W., Epps, H., & Miller, J. 1995, PASP, 107, 375
- Pence (1976) Pence, W. 1976, ApJ, 203, 39
- Poggianti et al. (2004) Poggianti, B. M., Bridges, T. J., Komiyama, Y., Yagi, M., Carter, D., Mobasher, B., Okamura, S., & Kashikawa, N. 2004, ApJ, astro-ph/0309449
- Press et al. (1992) Press, W. H., Teukolsky, S. A., Vetterling, W. T., & Flannery, B. P. 1992, Numerical recipes in FORTRAN. The art of scientific computing (Cambridge: University Press, —c1992, 2nd ed.)
- Quintero et al. (2004) Quintero, A. D., Hogg, D. W., Blanton, M. R., & et al. 2004, ApJ, submitted
- Schade et al. (1996) Schade, D., Lilly, S. J., Le Fèvre, O., Hammer, F., & Crampton, D. 1996, ApJ, 464, 79
- Simard et al. (1999) Simard, L., Koo, D. C., Faber, S. M., Sarajedini, V. L., Vogt, N. P., Phillips, A. C., Gebhardt, K., Illingworth, G. D., & Wu, K. L. 1999, ApJ, 519, 563
- Simard et al. (2002) Simard, L., Willmer, C. N. A., Vogt, N. P., Sarajedini, V. L., Phillips, A. C., Weiner, B. J., Koo, D. C., Im, M., Illingworth, G. D., & Faber, S. M. 2002, ApJS, 142, 1
- Somerville & Kolatt (1999) Somerville, R. S. & Kolatt, T. S. 1999, MNRAS, 305, 1
- Tran (2002) Tran, K. H. 2002, PhD thesis, Univ. California at Santa Cruz
- Tran et al. (2003a) Tran, K. H., Franx, M., Illingworth, G., Kelson, D. D., & van Dokkum, P. 2003a, ApJ, 599, 865
- Tran et al. (1999) Tran, K. H., Kelson, D. D., van Dokkum, P., Franx, M., Illingworth, G. D., & Magee, D. 1999, ApJ, 522
- Tran et al. (2003b) Tran, K. H., Simard, L., Illingworth, G., & Franx, M. 2003b, ApJ, 590, 238
- Tran et al. (2001) Tran, K. H., Simard, L., Zabludoff, A. I., & Mulchaey, J. S. 2001, ApJ, 549, 172
- van Dokkum & Ellis (2003) van Dokkum, P. G. & Ellis, R. S. 2003, ApJ, 592, L53
- van Dokkum & Franx (1996) van Dokkum, P. G. & Franx, M. 1996, MNRAS, 281, 985
- van Dokkum et al. (2000) van Dokkum, P. G., Franx, M., Fabricant, D., Illingworth, G. D., & Kelson, D. D. 2000, ApJ, 541, 95
- van Dokkum et al. (1998) van Dokkum, P. G., Franx, M., Kelson, D. D., Illingworth, G. D., Fisher, D., & Fabricant, D. 1998, ApJ, 500, 714+
- Walker et al. (1996) Walker, I. R., Mihos, J. C., & Hernquist, L. 1996, ApJ, 460, 121
- Wirth et al. (1994) Wirth, G. D., Koo, D. C., & Kron, R. G. 1994, ApJ, 435, L105
- Yang et al. (2004) Yang, Y., Zabludoff, A. I., Zaritsky, D., Lauer, T., & Mihos, J. C. 2004, ApJ, astro-ph/0402062
- Zabludoff et al. (1996) Zabludoff, A. I., Zaritsky, D., Lin, H., Tucker, D., Hashimoto, Y., Shectman, S. A., Oemler, A., & Kirshner, R. P. 1996, ApJ, 466, 104+


| Field | ( | aaThe total number of spectroscopically confirmed field galaxies. We do not include cluster galaxies in this number for the three cluster fields. | bbThe number of field galaxies in the redshift range with spectral , and whose spectra include [OII], H, and H. | %E+A | Reference | |
|---|---|---|---|---|---|---|
| CL 1358+62 | (13:59:50.7, 62:31:05.4) | 156 | 76 | 1 | 1.3 | Fisher et al. (1998) |
| MS 2053–04 | (20:56:21.4, –4:37:51.5) | 215 | 83 | 4 | 4.8 | Tran (2002) |
| MS 1054–03 | (10:57:00.0, –3:37:37.0) | 186 | 42 | 0 | 0.0 | Tran et al. (1999) |
| van Dokkum et al. (2000) | ||||||
| Tran (2002) | ||||||
| 3C336 | (16:24:39.1, 23:45:12.1) | 240 | 19 | 1 | 5.3 | Magee et al. (2004) |
| 797 | 220 | 6 | 2.7 |
| Galaxy | [OII] | H | H | H | |
|---|---|---|---|---|---|
| 2053–415 | 0.406 | ||||
| 2053–1399 | 0.444 | ||||
| 2053–1647 | 0.465 | ||||
| 1358–1500 | 0.497 | ||||
| 2053–2700 | 0.865 | ||||
| 336–449 | 0.922 |
| Galaxy | aaDistance moduli determined for km s-1Mpc-1 , and cosmology. | T-typebbMorphologically typed by Fabricant et al. (2004) and K. Tran. | ccStructural parameters determined by fitting a de Vaucouleurs bulge+exponential disk to the galaxy’s surface brightness profile (Tran 2002; Tran et al. 2003b). Half-light radii are in kpc. | ccStructural parameters determined by fitting a de Vaucouleurs bulge+exponential disk to the galaxy’s surface brightness profile (Tran 2002; Tran et al. 2003b). Half-light radii are in kpc. | ccStructural parameters determined by fitting a de Vaucouleurs bulge+exponential disk to the galaxy’s surface brightness profile (Tran 2002; Tran et al. 2003b). Half-light radii are in kpc. | ccStructural parameters determined by fitting a de Vaucouleurs bulge+exponential disk to the galaxy’s surface brightness profile (Tran 2002; Tran et al. 2003b). Half-light radii are in kpc. | ddInternal velocity dispersions are in km s-1 and are estimated using the method outlined in Tran et al. (2003a). | |||
|---|---|---|---|---|---|---|---|---|---|---|
| 2053–415 | 40.9 | 21.7 | –19.2 | 0.76 | Sa | 0.3 | 2.1 | 0.01 | 0.08 | 51 |
| 2053–1399 | 41.2 | 21.5 | –19.7 | 0.84 | Mgr | 0.5 | 1.8 | 0.04 | 0.10 | 121 |
| 2053–1647 | 41.3 | 21.0 | –20.3 | 0.87 | SBc | 0.1 | 8.2 | 0.06 | 0.19 | 68 |
| 1358–1500 | 41.5 | |||||||||
| 2053–2700 | 42.9 | 23.1 | –19.8 | 0.92 | Compact | 0.5 | 0.8 | 0.05 | 0.09 | 210 |
| 336–449 | 43.1 | 21.5 | –21.6 | 0.81 | Sa | 0.7 | 1.4 | 0.08 | 0.11 | 219 |