New light on the S235A-B star forming region††thanks: Based on observations carried out with the IRAM Plateau de Bure Interferometer. IRAM is supported by INSU/CNRS (France), MPG (Germany) and IGN (Spain)
The S235A-B star forming region has been extensively observed in the past from the radio to the near IR, but what was happening in the immediate surroundings of the water maser, placed in between the two nebulosities, was still unclear because of insufficient resolution especially in the spectral range from the Far IR to the mm, even though there were sound indications that new young stellar objects (YSOs) are being formed there. We present here new high resolution maps at mm wavelengths in different molecules (HCO+, C34S, H2CS, SO2 and CH3CN), as well as in the 1.2 and 3.3 mm continuum obtained with the Plateau de Bure interferometer, and JCMT observations at 450 m and 850 m that unambiguously reveal the presence of new YSOs placed in between the two Hii regions S235A and S235B and associated with the water maser. A molecular core and an unresolved source in the mm and in the sub-mm are centred on the maser, with indication of mass infall onto the core. Two molecular bipolar outflows and a jet originate from the same position. Weak evidence is found for a molecular rotating disk perpendicular to the direction of the main bipolar outflow. The derived parameters indicate that one of the YSOs is an intermediate luminosity object () in a very early evolutionary phase, embedded in a molecular core of , with a temperature of 30 K. The main source of energy for the YSO could come from gravitational infall, thus making of this YSO a rare example of intermediate luminosity protostar representing a link between the earliest evolutionary phases of massive stars and low mass protostars of class 0–I.
Key Words.:
Stars: formation – Hii regions – ISM: clouds – ISM: molecules – radio lines – Infrared: stars1 Introduction
S235A and S235B are two close-by (separation 1′) small patches of nebulosity (20′′ and 10′′ in diameter, respectively), so called because they are located about 10′ south of the more extended Hii region S235 (Sharpless S (1959); Felli & Churchwell FC (1972)), but most probably not directly related to it (Israel & Felli IF (1978)). About 3.5 arcmin south of S235A-B there is another patch of nebulosity called S235C and identified with a small Hii region (Israel & Felli IF (1978)).
Early interferometric radio continuum observations have shown that S235A is a young Hii region, even though far beyond the earliest ultracompact (UC) evolutionary phase, while no radio continuum emission comes from S235B (Israel & Felli IF (1978)). The interest in these two nebulosities was increased by the fact that an H2O maser is present in the same area (Henkel et al. HHG (1986); Comoretto et al. COMORE (1990)), a well known landmark of recent star formation (see e.g. Tofani et al. tof95 (1995)). With the resolution available at that time it was not clear whether the maser was associated with S235A, S235B or simply happened to be in the same star forming region (Israel & Felli IF (1978)). Single dish observations have also revealed the presence of a methanol maser (Nakano & Yoshida NY (1986); Haschick et al. HMB (1990)) and of an SiO maser (Harju et al. HLBZ (1998)).
To ascertain the true relationship between S235A-B and the water maser and establish which is the source of energy supply for the water maser emission, high resolution radio observations were performed with the VLA in the A configuration in the water line and in the continuum (Tofani et al. tof95 (1995)), which led to the result that the H2O maser is well outside the boundary of the S235A Hii region, away from S235B and that no point-like radio continuum source (down to a flux density of 0.5 mJy and with a resolution of 03) is associated with it, i.e. no trace of a UC Hii region near the maser was found.
At that time it was becoming clear that water masers without associated compact radio continuum emission could trace one of the earliest phases in the formation of a young stellar object (YSO), in which the UC Hii region ionized by the early type star (if at all present) is so dense and optically thick to escape detection at radio wavelengths (Codella et al. cfn (1994), ctc (1997)).
The presence of a molecular cloud in the S235A-B region was known from earlier low resolution observations in several molecular lines (Evans & Blair EB (1981); Lafon et al. LDBL (1983); Nakano & Yoshida NY (1986)). To test the hypothesis that the water maser indicated the location of one or more new YSOs independent from S235A-B, and get more information on the environment in which the water maser was located, new maps in molecular tracers of high density gas (Cesaroni et al. 1999b ) and near-IR observations of the region (Felli et al. FTVW (1997)) were made.
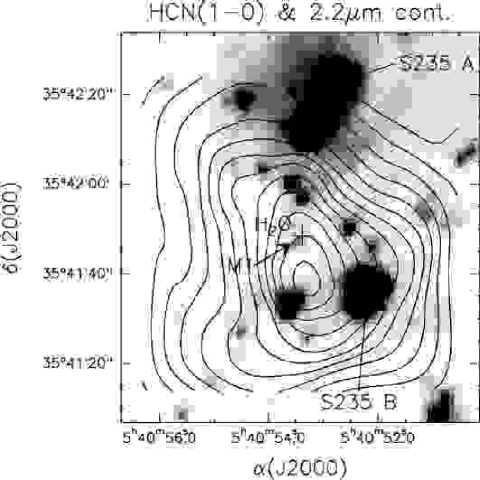
The results confirmed the validity of the hypothesis: the water maser is located at the centre of a high density small diameter molecular core, which peaks just between the S235A and S235B nebulosities. A cluster of near-IR sources is also located in the same area. The source with the largest IR excess (called M1) is placed close to the water maser. The picture before the present observations is summarized in Fig. 1 which shows the overlay of the HCN map obtained with a resolution of 27′′ (Cesaroni et al. 1999b ) with a K-band (2.2 m) map of the same area (Felli et al. FTVW (1997)). All the indications suggest that the water maser, M1 (both indicated in Fig. 1) and the HCN clump are all part of a much younger episode of star formation with respect to the S235A-B nebulosities, not necessarily directly related to them.
For completeness it should be noted that the VLA observations of the water maser (Tofani et al. tof95 (1995)) refer to the component at km s-1, which happened to be flaring at the time of the observations (1992) and was the only feature above the noise in the observed bandwidth (from –78 to –40 km s-1). During the continuing patrol of the water maser emission with the Medicina radiotelescope, started in 1988, this velocity component has very seldom emerged again from the noise level, while two other velocity components between and 2.5 km s-1 are frequently observed (Felli et al., in preparation). A partial report of the results of the Medicina patrol is given in Felli et al. (FTVW (1997)).
In the present work we investigate with better resolution the region around the water maser to study in more detail the YSOs that presumably are harboured in the centre of the molecular cloud. We present arcsec resolution maps at mm wavelengths in different molecules that trace high density gas (HCO+, C34S, H2CS, SO2 and CH3CN), as well as in the 1.2 and 3.3 mm continuum sensitive to thermal dust emission.
To obtain the bolometric luminosities of the YSOs and their spectral energy distribution (SED), high resolution far IR observations are needed, since at these wavelengths YSO spectra are expected to have their maximum. We inspected the IRAS HIRES maps (Aumann et al. afm (1990)) of the region around the water maser (which contains IRAS 05375+3540) in the four IRAS bands, but the resolution is inadequate for separating the contribution of S235A and S235B from that of the YSO.
We also present here archive JCMT observations at 450 m and 850 m that unambiguously demonstrate that the sub-mm emission peaks on the YSO associated with the water maser and separate its emission from that of S235A-B.
For consistency with previous work a distance of 1.8 kpc will be assumed (Nakano & Yoshida NY (1986)).
2 Observations and results
2.1 Plateau de Bure observations
The interferometric observations were carried out on November 22, 1997 and March 25, 1998 in the CD set of configurations of the IRAM five element array at Plateau de Bure, France (Guilloteau et al. iram (1992)). The five 15-m antennas were equipped with 82–116 GHz and 210–245 GHz SIS receivers operating simultaneously with double-sideband (DSB) noise temperatures of 35 K at 3.3 mm and 50 K at 1.2 mm. The receivers were tuned DSB at both wavelengths. The facility correlator was centred at 89.014 GHz in the lower side-band at 3.3 mm and at 241.102 GHz in the lower side-band at 1.2 mm. We show the frequency set-up of the correlator and list the detected spectral lines in Table 1. The six units in the correlator were placed in such a way that a frequency range free of lines could be used to measure the continuum flux. The effective spectral resolution is about twice the channel spacings given in Table 1. Source visibilities were phase calibrated by means of interspersed observations (every 20 minutes) of nearby point sources.
| Line | Frequency | Band | Channel spacinga | |
|---|---|---|---|---|
| (MHz) | (MHz) | (MHz) | (km s-1) | |
| 3.3 mm continuum | 90494 | 160 | 2.5 | 8.29 |
| HCO+(1–0) | 89189 | 20 | 0.078125 | 0.26 |
| CH3CN(5–4) | 91987 | 40 | 0.15625 | 0.51 |
| 1.2 mm continuumb | 242631 | 160 | 2.5 | 3.09 |
| C34S(5–4) | 241016 | 40 | 0.15625 | 0.19 |
| H2CS 7(1-6)–6(1,5) | 244048 | 160 | 2.5 | 3.07 |
| SO2 14(0,14)–13(1,13) | 244254 | 40 | 0.15625 | 0.192 |
a the effective spectral resolution is about twice the nominal channel spacing
b the 1.2 mm continuum was obtained by averaging two 160 MHz bandwidths in the lower and upper side bands
The bandpass, amplitude and phase calibration was carried out in the standard antenna based manner. The flux of the primary calibrator was bootstrapped from IRAM monitoring measurements and used to derive the absolute flux density scale. Table 2 gives a list of the main parameters for our Plateau de Bure interferometer observations. The phase centre position is that of the water maser (Tofani el al. tof95 (1995)).
| Parameter | Value |
|---|---|
| Centre of phase (water maser) | |
| Observing mode | continuum+line; double side-band at 3.3 mm and at 1.2 mm |
| Number of antennas | 5 |
| Baseline range | 15–150 m |
| Band centre | 89.014 GHz (LSB); 241.102 GHz (LSB) |
| Number of sections in the correlator | 6 |
| Primary HPBW | 55′′; 20′′ |
| Synthesised HPBW (P.A.) | 3.3 mm: 54 42 (61°) |
| 1.2 mm: 22 18 (45°) | |
| Primary flux density and | 0415+379 (5.5–6.7 Jy at 3.3 mm; 3.4–4.1 Jy at 1.2 mm) |
| bandpass calibrators | 3C 273 (25.3–29.8 Jy at 3.3 mm; 13.2–26.2 Jy at 1.2 mm) |
| 3C 345 (4.1 Jy at 3.3 mm; 1.1 Jy at 1.2 mm) | |
| Phase calibrators | 2013+370 (1.8–2.2 Jy at 3.3 mm; 0.4–1.3 Jy at 1.2 mm) |
| 2005+403 (0.65–0.75 Jy at 3.3 mm; 0.08–0.24 Jy at 1.2 mm) |
The calibration and data reduction were made using the GAG software developed at IRAM and Observatoire de Grenoble. Continuum subtraction was performed in the UV plane by using the integral over the line-free channels of the 160 MHz units. Finally, channel maps were produced for all the lines. The conversion factor from flux to brightness temperature in the synthesized beam is K (Jy/beam)-1 at 3.3 mm and K (Jy/beam)-1 at 1.2 mm.
2.1.1 Continuum
The 3.3 mm and 1.2 mm continuum maps (uncorrected for primary beam attenuation) are shown in Fig. 2.
In the 3.3 mm map, S235A is clearly detected as an extended source at the edge of the primary beam. The total flux density (corrected for primary beam attenuation) is 54 mJy. This value is lower than the optically thin extrapolation of the free-free emission observed at lower frequencies (200 mJy using the flux densities of Israel & Felli IF (1978)), but confirms that the radio continuum emission comes from the ionized gas of the S235A Hii region, with negligible contribution from dust emission. The reason for the lower observed flux density must probably be searched for in the higher resolution of the present observations (5 compared with 12′′) which misses lower surface brightness extended emission. The overlay with the K-band image (Felli et al. FTVW (1997)), not shown here, indicates that the S235A mm emission is centred on the western edge of a K-band nebulosity, where a sharp drop in surface brightness suggests the presence of a foreground dust front.
S235B is not detected at 3.3 mm with an upper limit to a point source at the same position of 1 mJy and also undetected at 1.2 mm, but in this case it is also well outside the primary beam. The nondetection is consistent with previous upper limits at lower frequencies (Israel & Felli IF (1978)) and confirms that no radio emission either from ionized gas or dust is coming from S235B. This behaviour of S235B at radio wavelengths is surprising, since the source has been detected in H (Glushkov et al. GDK (1975)) and Br (Krassner et al. KPSH (1982)). Possible explanations for this effect in terms of an ionization-bounded expanding envelope have already been discussed by Felli et al. (FTVW (1997)).
S235C is totally outside the primary beam both at 3.3 and 1.2 mm.
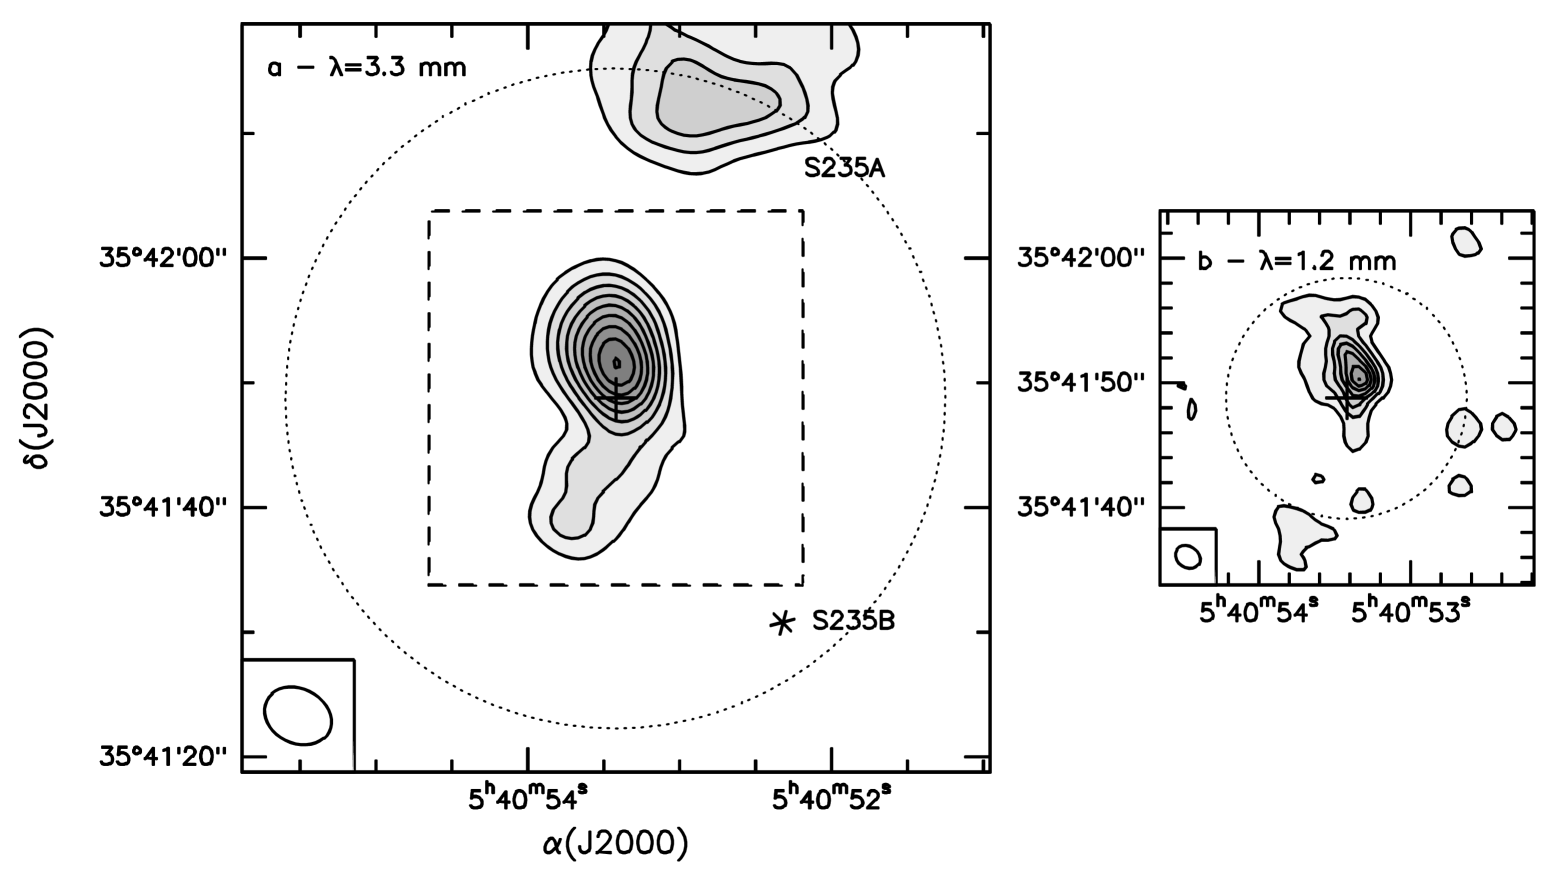
The new important result of the present observations, in connection with the hypothesis of YSOs associated with the water maser, is the detection at 3.3 and 1.2 mm of an almost unresolved core slightly to the north (2′′) of the water maser. At the highest resolution of the 1.2 mm observations the core diameter is 3′′, only slightly larger than the synthesized beam. There is also a tail protruding approximately to the south of the core, more evident in the 3.3 mm map, but also partly visible in the 1.2 mm map, extending for 10′′ in the longest direction and almost unresolved in the other.
Because of the core-tail morphology we have tried to separate the flux density of the core from that of the tail. The flux densities of the core (corrected for primary beam attenuation) are 20 and 245 mJy at 3.3 and 1.2 mm, respectively. The spectral index between 3.3 and 1.2 mm is 2.5. Since we cannot estimate the possible contribution to the 3.3 mm continuum by free-free emission, this is a lower limit to the dust spectral index, but it clearly indicates that most of the emission comes from the dust that surrounds the YSOs. The extrapolated flux density of the core dust emission at 8.4 GHz is 0.06 mJy, well below the sensitivity of the VLA observations of Tofani et al. (tof95 (1995)). Thus the contribution of dust emission at 8.4 GHz is likely to be negligible with respect to free-free emission, so that the upper limit of 0.5 mJy (Tofani et al. tof95 (1995)) can still be used to constrain the emission of a UC Hii region at the position of the water maser.
For the tail, the flux densities are 7.0 and 13 mJy at 3.3 and 1.2 mm, respectively, with some uncertainty in the 1.2 mm flux density because of the weakness of the emission. The spectral index of the tail between 3.3 and 1.2 mm is 0.6, definitely different from that of the core and identical to that expected either from an ionized stellar wind (Panagia & Felli PF (1975)) or a thermal jet (Reynolds R (1986)), and suggests that the emission comes from an ionized jet, presumably departing from the core, with very small or null contribution from dust emission. As a counter-check, the predicted flux density of the jet at 8.4 GHz using a spectral index 0.6 is of the order of 1.7 mJy, so the fact that it was not detected in previous observations at lower frequencies is consistent with their sensitivities and resolution. Deeper radio continuum observations at cm wavelengths are essential to better define the parameters of the thermal jet.
2.1.2 HCO+
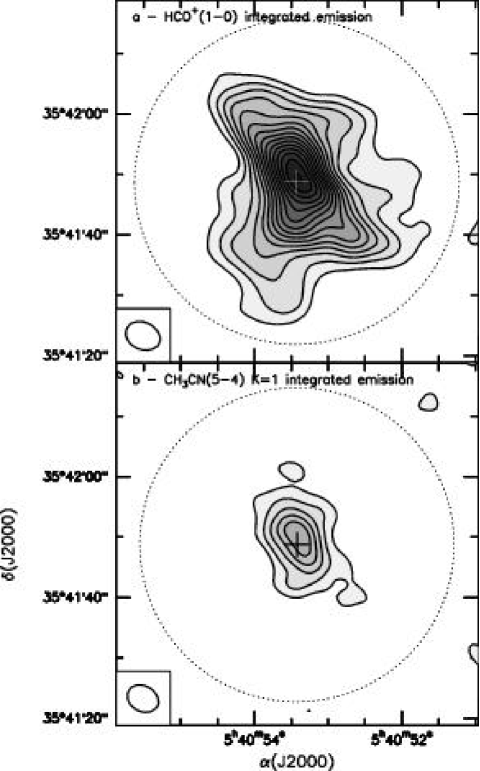
The HCO+(1–0) map of the emission averaged over the entire velocity range (from –49 to 11.5 km s-1) is shown in Fig. 3a. The line emission peaks at the position of the water maser, making tighter the connection between water maser and molecular core than what was found at lower resolution in other molecular lines (Cesaroni et al. 1999b ). The molecular core has a FWHM diameter of 11′′ and is surrounded by a more extended lower intensity region with a FWHM size of 30′′.
Comparison of the HCO+ and the 3.3 mm continuum maps does not show any obvious evidence of connection between the molecular core and S235A (e.g. no sharp rim either in the molecular cloud or in the Hii region at the location where the two are closest), thus making it very unlikely that the ionized gas of S235A and the HCO+ molecular cloud might be interacting.
Inspection of the line profiles at two different positions near the water maser (see Fig. 4) reveals three distinct features: 1) extended wings suggesting the presence of an outflow; 2) a shift in the velocity of the peak with position, which suggests the presence of two distinct molecular components at different velocities; and 3) a dip of emission on the red side of the profile at –15.5 km s-1, suggestive of red-shifted self-absorption and hence of infall inside the core.

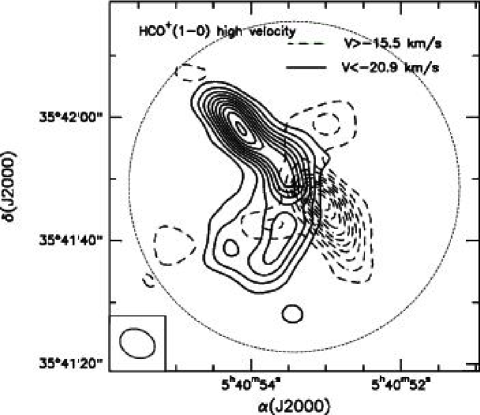
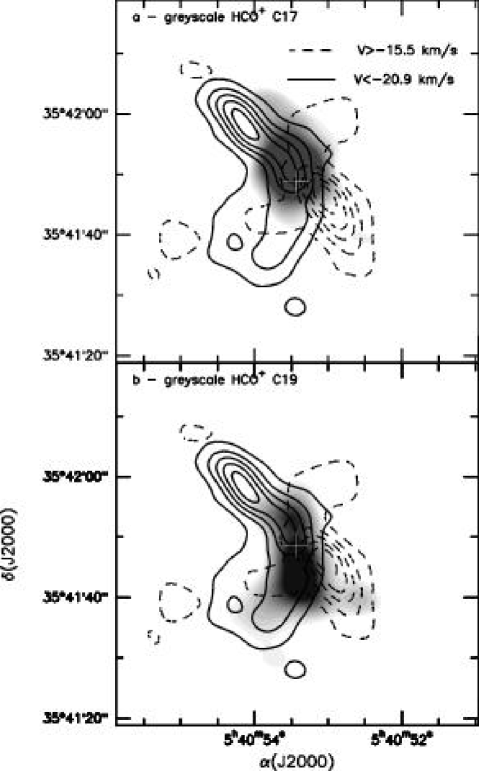
To study the morphology of the outflow we have inspected carefully the channel maps and produced a map averaging all channels up to the edge of the band with –15.8 km s-1 for the red lobe and with –20.8 km s-1 for the blue lobe (see full lines in Fig. 4). The result is shown in Fig. 5. Two bipolar outflows are evident: 1) a more extended one oriented in the NE–SW direction and 2) a smaller one oriented in the NNW–SSE direction. Within the uncertainty on the separation of the two outflows, both seem to originate from the position of the water maser. The flux contained in the NE–SW outflow lobes is 12% of that over the entire velocity range. The presence of a larger scale bipolar outflow in the S235A-B region had also been reported by Nakano & Yoshida (NY (1986)) using the 12CO line and by Cesaroni et al. (1999b ) and Felli et al. (FTVW (1997)) with 13CO observations. However there is very little correspondence between those maps and the map of Fig. 5: most probably the different resolutions and the fact that the CO line is much more affected by the large scale, lower density molecular gas make it impossible to compare the results of Cesaroni et al. (1999b ) and Felli et al. (FTVW (1997)) to the map in Fig. 5.
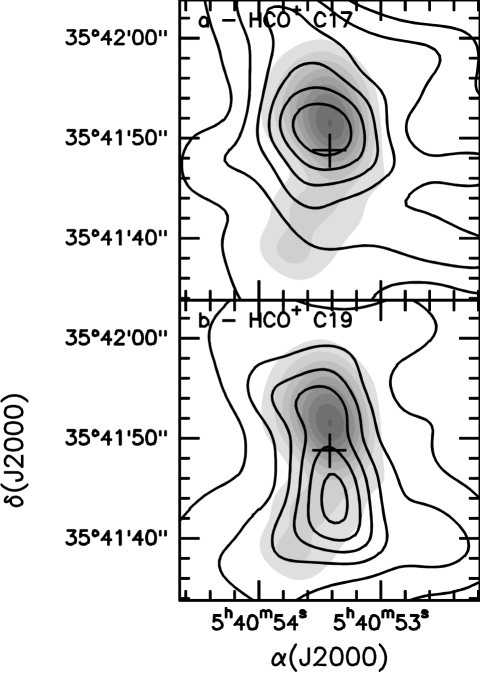
To investigate the origin of the emission at different velocities (see Fig. 4), we produced two maps in two small velocity intervals centred around the velocities marked with dotted lines in Fig. 4, (approximately –17 and –19 km s-1). The two maps are shown in Fig. 6a–b and cover the velocity intervals from –18.16 to –15.8 km s-1 and from –20.8 to –18.16 km s-1; each of them presents a peak, but at a different position, suggesting the presence of two distinct cores which will be referred to as C17 and C19. The separation between C17 and C19 is 7′′ in the NS direction, with C17 (the most intense) slightly to the north of the water maser position and C19 (the weaker one) to the south of it.
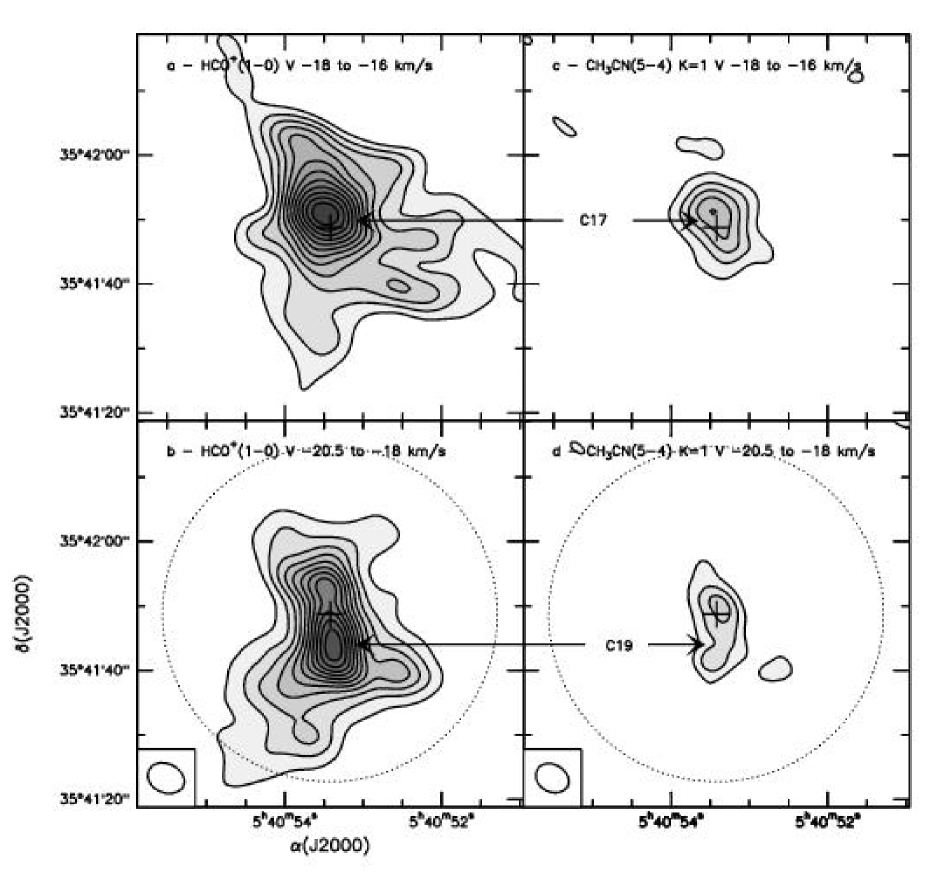
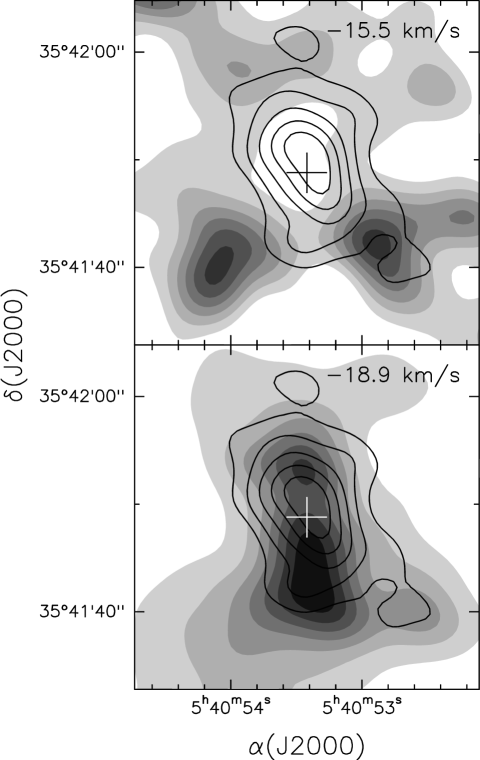
Finally, to establish if the dip on the red side of the profile is due to infalling material, we have produced two maps from channels symmetrically placed in velocity with respect to the peak HCO+ velocity (–17.2 km s-1), i.e. at –15.5 km s-1 (the velocity of the dip) and –18.9 km s-1 (the symmetric velocity). The two maps are shown in Fig. 7 in grey scale, overlaid on the CH3CN map (contours), which traces the densest part of the molecular core. The dip clearly coincides with the peak of the CH3CN emission, while at the symmetric velocity there is no decrease of HCO+ emission at the position of the CH3CN peak (apart from some complication due to the presence of the HCO+ C19 peak discussed above). This indicates that the dip is a signature of infall in the core.
The velocity of the infalling gas can be estimated using the model of Myers et al. (myers (1996)) and applying their Eq. (9), which for the case of (the brightness temperature of the dip) much smaller than (the height of the blue peak above the dip) and (the height of the red peak above the dip) simplifies to:
| (1) |
where is the velocity dispersion of the line and (–) is the difference between the velocities of the red and blue peaks. From Fig. 4, =2.4 K, =0.12 K, -=4 km s-1 and from Fig. 10 =2.6 km s-1. The derived is 5 km s-1.
Using and making plausible assumptions on the radius () to which refers and the corresponding density (), one can estimate the mass infall rate:
| (2) |
For and we have used the values derived from the mm continuum observations, given in Table 4. The derived value is y-1.
2.1.3 CH3CN
The CH3CN(5–4) =1 map averaged from –20.63 km s-1 to –15.03 km s-1 is shown in Fig. 3b. The diameter of the emitting region is 7′′ after beam deconvolution. The two maps in the velocity intervals from –17.58 to –15.54 km s-1 and from –19.10 to –17.58 km s-1 are shown in Fig. 6c-d. The CH3CN line profile obtained by averaging over the synthesized beam is shown in Fig. 8.

The two bipolar outflows seen in the HCO+ line are not detected in the CH3CN line since it is not possible to use the stronger =0 and =1 transitions because of blending of the lines, while the higher order transitions, where blending is less severe, are too weak. Also, CH3CN is a tracer of high density gas and not of bipolar outflows.
As in the HCO+ line the CH3CN emission shows two distinct velocity peaks (once allowance is made for the lower intensity of the line, see Fig. 6c-d). Correspondingly, the two components C17 and C19 can be found in the same velocity intervals and at the same position as those observed in the HCO+ line.
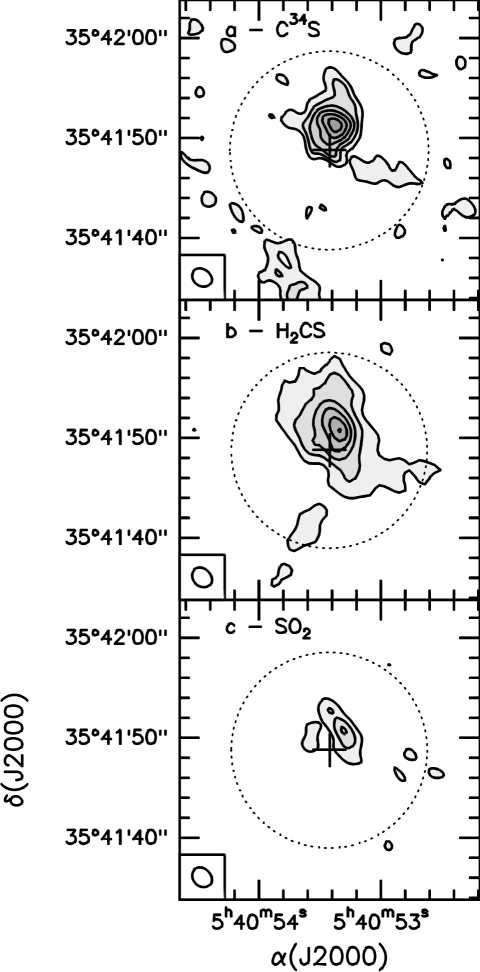
2.1.4 C34S, H2CS and SO2
The maps in the 1.2 mm lines of C34S, H2CS and SO2 (see Table 1 for the frequency set-ups) are shown in Fig. 9, not corrected for primary beam attenuation. All of these confirm that the molecular emission peaks at the position of the water maser. The diameter of the core in the C34S line is 35.
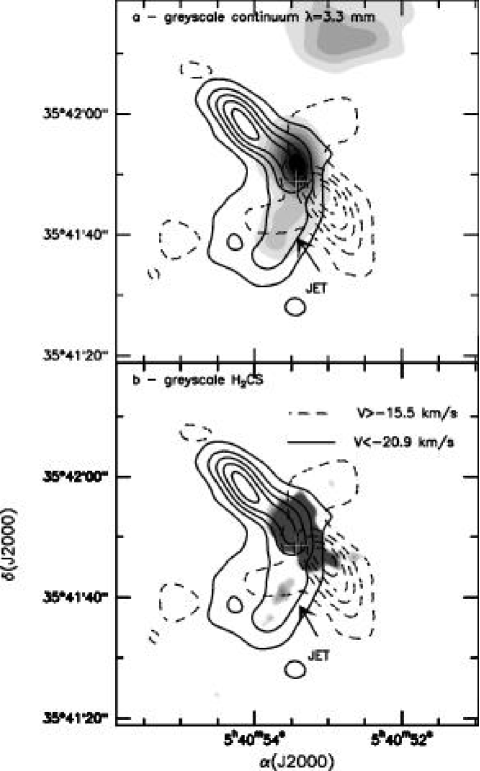
Most of the H2CS emission appears to be centred at km s-1 and clearly traces C17. The H2CS map shows also a tail (at a 3 level) in the same direction and position as the jet observed in the continuum at 3.3 and 1.2 mm, with emission concentrated around –19 km s-1 and partly overlapping with C19.
SO2 is very faint, so no velocity structure can be derived from our data. It is concentrated towards C17, but it can be noted that its emission seems to be stretched in the NE–SW direction, roughly along the NE–SW outflow.
The comparison between the C34S line profile observed at Pico Veleta and that at Plateau de Bure is shown in Fig. 10. Most of the C34S flux comes from structures resolved out in the interferometric observations. Hence, the molecular core detected in our high resolution observations represents just a small (high density) part of the molecular cloud present in the S235A-B region.

2.2 James Clerk Maxwell Telescope – SCUBA
The submillimetre observations were carried out with the Submillimetre Common-User Bolometer Array (SCUBA; Holland et al. scuba (1999)) on the James Clerk Maxwell Telescope on Mauna Kea, Hawaii on October 24, 2000 and were obtained from the public archive at the CADC. SCUBA consists of a short wavelength array containing 91 pixels and a long wavelength array containing 37 pixels arranged in a close-packed hexagon. Both arrays have approximately the same field-of-view (2.3 arcmin) and can be used simultaneously. These observations used the 450- and 850-micron filters and were taken using the “Emerson II” scanning technique (Emerson emerson (1995); Jenness et al. jhcld (2000)) where the telescope is scanned in Nasmyth coordinates (in order to generate fully-sampled images) at 24′′/sec whilst the secondary is chopped in fixed directions on the sky. Six chop configurations were used: 30″, 44″, and 68′′ in right ascension and similarly in declination. A single map was taken for each chop configuration, covering a region of 3 by 10 arcmin and took approximately 35 minutes. CRL 618 was used for flux calibration (Jenness et al. jsaejr (2002)) with minor corrections applied using pointing observations on 0552+398 straddling the science observations. The zenith atmospheric opacity was obtained using a fit to the CSO 225 GHz tipping radiometer data as described in Archibald et al. (ajh (2002)) and was approximately 0.07 (225 GHz). The data were reduced using the standard SCUBA User Reduction Facility (SURF; Jenness & Lightfoot JL98 (1998)) software. The half power beam widths (HPBWs) are 14′′ at 850 and 7.5′′ at 450 m.
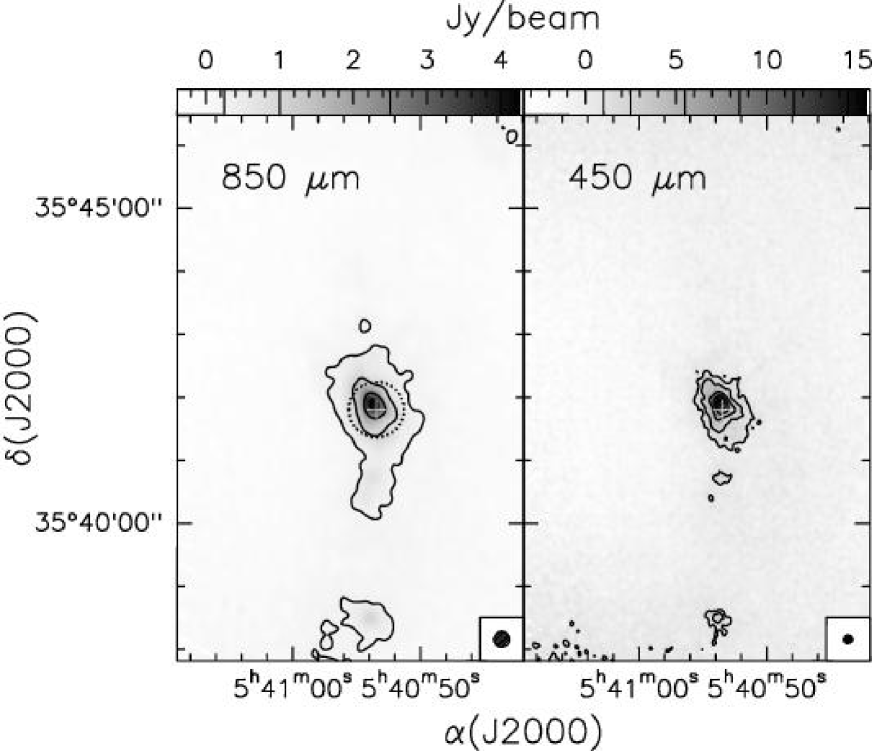
The SCUBA maps at 850 m and 450 m are shown in Fig. 11. At both wavelengths the peak coincides with the water maser.
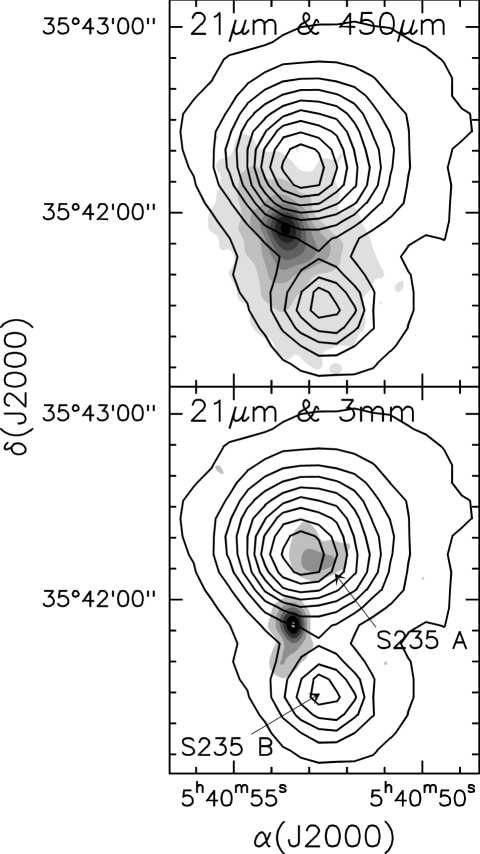
To show the relationship between the mm and sub-mm peaks with the mid-IR emission we have overlaid in Fig. 12 the 450 m and 3.3 mm maps with the 21 m map of the Midcourse Space Experiment (MSX, resolution 20′′). It is clear that the 21 m emission comes predominantly from the S235A and S235B nebulosities, with very little contribution (if any) from the YSO associated with the water maser, the mm core and the 450 m core.
The two SCUBA maps show a compact source at the centre, surrounded by a more extended halo. This is more evident at 850 m. To separate the two components, a radial profile of the emission was obtained at the two wavelengths by measuring the flux density contained in circular rings with increasing radii departing from the peak position. The profile at 850 m is shown in Fig. 13, together with its decomposition into two gaussians of half power width (HPW) equal to 12′′ and 56′′. The corresponding flux densities for the compact source and the entire source are 5 Jy and 24 Jy at 850 m and 11 Jy and 84 Jy at 450 m.

The Spectral Energy Distribution (SED) from 3.3 mm to 8 m is shown in Fig. 14. In view of the different resolutions of the MSX and IRAS data with respect to the present observations and the results of the overlays of Fig. 12, the IRAS and MSX data refer essentially to the S235A-B nebulosities and will not be considered further. The fits to our data will be explained in Sect. 3.1.

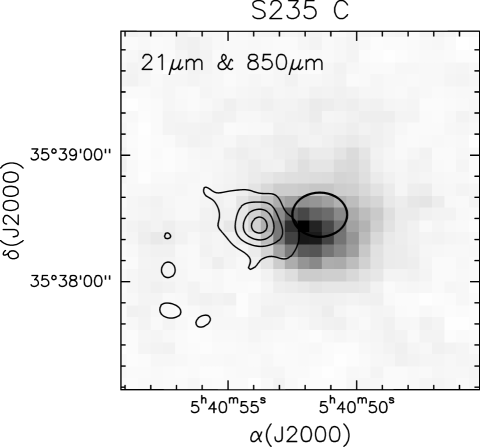
At the southern edge of the maps in Fig. 11, well outside the primary beam of the interferometric observations, another sub-mm source is present. This source coincides with S235C. The radio continuum flux densities of S235C at 21 and 6 cm are 70 and 60 mJy (Israel & Felli IF (1978)), and indicate that S235C is an Hii region, presumably ionized by a B0.5 star. In the same area there are also IRAS 05375+3536 and an MSX source. The flux densities at 850 m and 450 m are 1.0 0.1 Jy and 3.5 0.5 Jy, respectively. This new result clearly indicates the presence of dust associated with S235C. In Fig. 15 we show an overlay of the 850 m map with the 21 m image derived from MSX. The position and size of the 6 cm radio continuum source are marked with an ellipse. The not perfect match between the 850 m emission and the 21 m and radio continuum emission shows that two close-by YSOs in different evolutionary stages may be present in this area: the S235C Hii region and the 850 m source, representing most probably the emission from dust associated with a YSO in an earlier evolutionary phase. The situation is very similar to that occurring in the S235A-B complex. However, given the lack of interferometric information on S235C, no further discussion of this star forming region is possible.
3 Discussion
3.1 The molecular core
One of the main results of the present work is the confirmation that a high density molecular and dusty core, part of the larger scale molecular complex detected in the CO lines (see e.g the 13CO observations of Cesaroni et al. 1999b ), is located close to the water maser. This morphology is typical of the earliest stages in the evolution of a YSO and proves that a new episode of star formation is occurring near the water maser, while other star formation events like those associated with S235A and S235B occurred in the past and in S235A have had sufficient time to create a well developed Hii region.
The temperature of the molecular core can be derived from the CH3CN(5–4), =0,1,2,3 lines measured towards the peak position by means of the rotation diagram method (Boltzman plot), which assumes that all energy levels of CH3CN are populated according to local thermodynamic equilibrium (LTE) with a single excitation temperature. The results of the fit are shown in Fig. 16 and give a temperature of 30 K. This value is smaller than the 43 K peak main beam brightness temperature of the 13CO(2 – 1) line (Felli et al. FTVW (1997)) and suggests that the optically thick CO emission of the larger scale molecular cloud might be heated from outside by the radiation of the star exciting the S235A Hii region, while the molecular core around the water maser is shielded from the Hii region radiation and excited only by the YSOs placed inside.
As noted in Sect. 2.1.4, the molecular core is also traced by H2CS and SO2, which are predominantly found towards hot cores (Hatchell et al. htmm (1998)) or the envelopes of massive stars (van der Tak et al. tbbd (2003)). In particular, van der Tak et al. (tbbd (2003)) found that H2CS arises from regions with excitation temperatures of K, which is not too different from our estimated temperature, whereas SO2 shows a higher excitation temperature ( K).
A large fraction of SO2 is usually found in high-velocity gas (van der Tak et al. tbbd (2003)); this aspect might be consistent with the NE–SW elongated shape of the SO2 emission along the direction of the NE–SW outflow. Indeed, sulphur-bearing molecule production is believed to originate either from grain evaporation in the dense hot environment around protostars, or from shocked gas (Hatchell et al. htmm (1998); Bachiller et al. bgkt (2001); van der Tak et al. tbbd (2003)). From our observations with only one transition per molecule, we cannot state whether they mostly arise from warm gas or from shocked gas around the protostar, although part of the emission of H2CS is clearly related with the outflows (hence, with shocked gas).

To derive the luminosity of the YSOs and the mass of the molecular cloud we use the mm and sub-mm flux densities. Figure 14 shows grey-body fits to our data, with the assumption of constant density and constant temperature in the molecular cloud. The best fit is obtained using a dust opacity and the temperature derived from the CH3CN lines. Larger dust opacities () produce worse fits to the mm and sub-mm data.
The lower dotted curve in Fig. 14 shows a fit to the mm data alone. In this fit no distinction was made between core and jet and total flux densities were used. It should also be noted that the 1.2 mm observations may resolve out, and consequently miss, some of the extended emission. With these premises, the luminosity is 24 and the total mass 16 . These values of mass and luminosity might refer to a possible disk around the YSO and should be considered as an upper limit to the true disk values since contamination from the dust in the core that surrounds the disk might occur. The middle dashed curve is a fit to the two sub-mm flux densities of the compact source (see Sect. 2.2). The luminosity is 160 and the mass 101 . These values should refer to the densest part of the molecular core. Finally, the upper full line is a fit to the two total sub-mm flux densities (compact source + halo) and gives a luminosity of 920 and a mass of 690 . These values are representative of the total luminosity of the YSO (or cluster of YSOs) and the total mass of the molecular core in which the YSO(s) is (are) harboured.
There are two other ways to derive the mass of the molecular core: the first (virial mass) is from the width of the line (from gaussian fits) and the source size. We used the relation of MacLaren et al. (mrw (1988)) for a homogeneous sphere. The second uses the intensity of optically thin lines and assumes LTE and a given molecular abundance with respect to H2. The derived masses are given in Table 3 and Table 4, respectively. The values obtained from HCO+ which refer to a resolved source of 0.1 pc in size, are similar and consistent, within the approximation of the present estimates, with the mass of the dense core derived from the fit to the JCMT flux densities. Those derived from C34S (similar for the two methods) refer to a smaller and probably denser central component and are consistent with the disk mass obtained from the fit to the mm flux densities. Finally, the CH3CN estimates are not fully consistent with each other, very likely due to the large uncertainty in the molecular abundance assumed.
| Line | Diameter | Virial Mass | |
|---|---|---|---|
| (pc) | (km s-1) | () | |
| HCO+(C17) a | 0.1 | 2.4 | 58 |
| HCO+(C19) a | 0.08 | 3.1 | 77 |
| C34Sa | 0.03 | 1.49 | 7 |
| CH3CN | 0.06 | 2.85 | 53 |
a Line wings were excluded from fits.
| Tracer | Diameter | Mass |
| (pc) | () | |
| HCO+ (C17)a | 0.1 | 31 |
| HCO+ (C19)a | 0.08 | 10 |
| C34Sa | 0.03 | 7 |
| CH3CNa | 0.06 | 2.3 |
| mm continuum | 0.054 | 16 |
a Tex=30 K, [HCO+]/[H2], [C34S]/[H2], [CH3CN]/[H2].
3.2 The YSOs
In this section we examine the possible implications that can be derived for the YSOs predicted to exist in the molecular core from the NIR observations of Felli et al. (FTVW (1997)).
The NIR source closest to the water maser is M1 (Felli et al. FTVW (1997)) and it is also the reddest one in the entire field. M1 is the stellar object with the largest near-IR excess in the region and it was proposed by Felli et al. (FTVW (1997)) as the powering source of the water maser. As shown in Fig. 1 it is located SSE of the maser position and only east of C19 and it lies projected on the thermal jet. However, its distance from the C17 core () is greater than the possible uncertainty in the near-IR astrometry and makes a direct correspondence of M1 with the YSO in the centre of C17 very unlikely. M1 could still be associated with the YSO in C17 if it is due to reflected radiation from the embedded star, as has been suggested to be the case for the (proto)star IRAS 20126+4104 (Cesaroni et al. cesa1 (1997)) and W75N (Moore et al mmym (1991); Hunter et al. htft (1994); Shepherd et al. sts (2003)), where the NIR emission is not coincident with the location of the YSO. This would imply the existence of a low density channel with lower extinction through which NIR photons emitted by the YSO can escape from the dense core.
We can check the nondetection of a K band source in the C17 core by estimating the required stellar extinction AV and consequent column density, and comparing it with the column density derived from our mm observations. An appropriate lower limit to the K magnitude in the region around M1 is 15. To derive AV we shall assume the pre-main sequence (PMS) star to have at least a mass of 6 (see Sects. 3.6 and 4). Using the evolutionary tracks of Palla & Stahler (ps (1999)), a yr old PMS star of such mass at 1.8 kpc would have K=10.9 mag, yielding =37 mag. The corresponding column density is cm-2. The average column density for C17 is cm-2 from HCO+ and cm-2 from the mm dust emission. These values are mutually consistent and confirm that a 6 YSO hidden inside the core could not be observed in the K band.
Given the proximity of M1 to C19, there is still another possibility to consider, namely that M1 is instead coincident with a different YSO located in C19 and powering the thermal jet. The column density in C19 is lower than in C17 ( cm-2 from HCO+), but could even be overestimated since no thermal mm continuum is found at the same position. This would allow one to detect a lower mass star, considering that the putative YSO in C19 must have a lower luminosity, but no quantitative statement can be made at this stage. In conclusion, it cannot be excluded that M1 may be the powering source of the thermal jet and the NIR counterpart of a YSO in C19. Higher resolution, deeper NIR observations with more accurate astrometry are needed to settle this issue.
3.3 The molecular outflows
The map of the high velocity HCO+ gas (Fig. 5) shows that this is distributed in two outflows, both of them originating approximately from the position of the water maser. The longest, better defined and more collimated one is in the NE–SW direction, with little overlap between the red and blue lobes. The collimation is rather high; using the water maser as centre position and the HPW of the lobes transverse to the maximum length we obtain an opening angle of the lobes of 15°.
The other outflow is in the NNW–SSE direction, it is slightly less extended, less intense and less collimated. Its southern blue lobe coincides with the thermal jet seen at 3.3 mm and with the H2CS tail, as shown in Fig. 18. Sulphur-bearing molecules are expected (and found) in shocked gas within outflows (Bachiller et al. bgkt (2001)), so the presence of H2CS along the NNW–SSE outflow confirms that the molecular tail is part of the outflow.
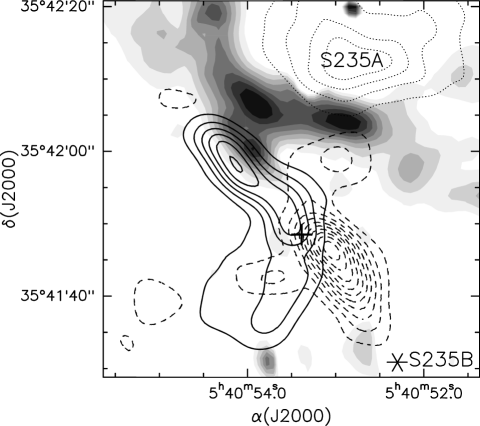
Collimated outflows are often associated with shock excited H2 emission (see e.g. Cesaroni et al. 1999a ). A comparison of Fig. 5 with the H2 emission map from Felli et al. (FTVW (1997)) is shown in Fig. 17. Within the uncertainties of the respective astrometry, the northern blue lobe of the NE–SW outflow seems to coincide with a distinct feature of the H2 emission that clearly deviates from the H2 half ring that surrounds the S235A Hii region. There are three other possible associations in Fig. 17 between H2 features and the bipolar outflows, even though they should be checked with more accurate astrometry and more sensitive H2 observations: in the northern part, the red lobe of the NNW–SSE outflow seems to end up in a bright feature of the H2 emission and, in the south, two weaker H2 spots are located at the end of the blue lobe of the NNW–SSE outflow and of the red lobe of the NE–SW outflow.
The possible implication is that part of the H2 (the ring around S235A) could be excited in the photo dissociation region at the interface between the Hii region and the molecular cloud, while the H2 associated with the outflows could be shock excited. Near-IR spectroscopy of the H2 features is needed to settle this point.
The parameters of the two outflows were derived assuming [HCO+]/[H2] = 10-9, an excitation temperature of 30 K and optically thin emission, and are given in Table 5. The main uncertainty in these values comes from the artificial separation of the two outflows in the regions where they overlap. All the derived parameters are smaller than those of the outflow found in IRAS 20126+4140 (Cesaroni et al. cesa1 (1997)), as expected considering that IRAS 20126+4140 has a bolometric luminosity about an order of magnitude greater.
The maximum expansion velocities of the two lobes of the NE–SW outflow are not equal. The blue lobe velocity reaches up to 15 km s-1 from the molecular core peak velocity, while that of the red lobe is at least twice as high. This explains the larger dynamical time scale found for the blue lobe, given the fact that the two lobes have almost equal sizes.
| Time scale | Mass | Mass loss rate | Momentum | Mech. Lum. | |
|---|---|---|---|---|---|
| (yr) | () | ( yr-1) | ( km s-1) | () | |
| NE–SW blue lobe | 14700 | 3 | |||
| NE–SW red lobe | 6 | ||||
| NNW–SSE blue lobe | 15000 | 3 | |||
| NNW–SSE red lobe | 20000 | 1 |
3.4 The two velocity peaks
To study the significance of the two velocity peaks displayed in the HCO+ and CH3CN spectra and outlined in Sects 2.1.2 and 2.1.3, we have overlaid the HCO+ C17 and C19 cores with the 3.3 mm continuum emission (Fig. 19) and the HCO+ outflow (Fig. 20).
C17 is associated with the 3.3 mm core, the water maser, and the centre of the NE–SW outflow. There is little doubt that the NE–SW outflow originates from the YSO hidden within the 3.3 mm core.
C19 instead does not have an associated 3.3 mm core and is located along the axis of the thermal jet observed at 3.3 mm and the blue lobe of the NNW–SSE outflow. At the same position and in the same velocity interval (from –18 to –20 km s-1) one sees the jet observed in the H2CS line.
The interpretation of this complex morphology is far from clear. The most obvious one is that the molecular core is composed of two distinct components with different velocities. However, in this case there would be a major difference between C17 and C19 due to the lack of mm continuum emission from C19: either the temperature of the dust in C19 is much lower than in C17 or the abundance of HCO+ and CH3CN in C19 is much higher than in C17. If this were the case it would be of interest to know if the thermal jet and the NNW–SSE outflow originate from C19, but this cannot be derived from the present data.
An alternative explanation might be that the acceleration of the molecular gas from its interaction between the thermal jet and the molecular outflow is capable to alter in this area the velocity observed in the HCO+ and CH3CN lines, which would be the weighted mean of the gas entrained and the quiescent surrounding molecular gas. In IRAS 18162–2048 Benedettini et al. (bmtn (2003)) have found that the momentum deposited by the outflow can break the molecular cloud apart, shifting part of the emission towards bluer or redder velocities. If all the momentum in the blue lobe of the NNW–SSE outflow (13 km s-1) is deposited in the molecular cloud, given the velocity offset between C17 and C19 (2 km s-1), up to 6 can be moved. This mass is not too different from that of C19 (see Table 4) and, if accelerated, would definitely create a secondary velocity peak in the molecular line emission.
3.5 The thermal jet
The detection of thermal jets in YSOs is by no means a new discovery since many have been found in low luminosity YSOs (Anglada et al. anglada (1998)). Usually they are associated with molecular outflows, even though on a much smaller scale, and are elongated along the axis of the outflow. The origin of the ionization of the thermal jet is not photoionization, because at the low bolometric luminosities the implied stellar temperatures are too low. The alternative mechanism proposed is ionization from UV photons produced in the shock of the neutral wind from the YSO against the surrounding high density gas (Curiel et al. curiel1 (1987), curiel2 (1989); Torrelles et a. torr (1985)). Anglada et al. (anglada (1998)) have found an empirical relation between the momentum rate in the molecular outflow () and the radio continuum luminosity of the jet at centimeter wavelengths (). Using their Eq. (3) and the extrapolated centimeter flux density of the thermal jet, we derive . This value can be compared to that derived for the blue lobe of the NNW–SSE outflow using the values of Table 5, i.e. . Although the two values differ by almost a factor 10, we believe that they are in reasonable agreement within the uncertainties. In fact, on the one hand the relation by Anglada et al. (anglada (1998)) has a spread of about an order of magnitude, on the other the masses (and hence the momenta) in Table 5 depend on the HCO+ abundance, which may differ significantly from the value adopted by us.
3.6 The disk
Highly collimated bipolar outflows have been found to be associated with disks in several YSOs, as for instance in HH 30 (Burrows et al. burr (1996)) and IRAS 201026+4140 (Cesaroni et al cesa1 (1997), 1999a ). The detected disks rotate around the central (proto)star and lie in a plane perpendicular to the bipolar outflows. One way to detect the disk is by revealing the change of the LSR velocity along a direction perpendicular to the bipolar outflow. To search for the possible presence of a disk in the centre of the HCO+ outflow we have used the highest resolution available in our data and the strongest molecular line, i.e. the C34S observations.
As pointed out in Sect. 2.1.4 from the comparison of single dish and interferometric observations, the C34S emission is dominated by the quiescent gas of the extended molecular cloud. Therefore, in order to avoid confusion we have selected the extreme velocity ranges where the emission is still above the noise level, thus averaging the emission from –20.86 to –18.9 km s-1 (blue side) and from –15.81 to –13.86 km s-1 (red side). The flux density contained in these intervals is 17% of that within the above velocity limits. The resulting maps are shown in Fig. 21. Two unresolved components are found (Fig. 21a) very close to the water maser and to the 1.2 mm core (Fig. 21b), which also coincide with the centre of the NE–SW outflow (Fig. 21c). The red and blue peaks are offset by 3.5′′ and the line that connects them is almost perpendicular to that of the NE–SW outflow. This might suggest that one is observing a disk rotating around the YSO and perpendicular to the outflow axis. One could possibly object that the two unresolved components represent the feet of the NNW–SSE outflow, given also the good correspondence in velocity and position. While we cannot exclude this hypothesis, we do not feel this is the case because the C34S molecule is a good tracer of high-density gas. To confirm our hypothesis we have made a velocity–position plot along the direction of the plane of the disk. This is shown in Fig. 22 which clearly indicates the existence of a velocity gradient.
Assuming that we are dealing with a rotating disk, it is possible to estimate the mass of the star+disk system from the measured radius and corresponding rotation velocity and check if this value is consistent with the other indications. The radius can be computed from the separation between the red- and blue-shifted C34S gas in Fig. 21c, which at the assumed distance of 1.8 kpc corresponds to 3150 AU. The rotation velocity is taken equal to the maximum velocity offset between the most blue- and red-shifted channels in which the C34S emission is still above the noise, and turns out to be 5 km s-1. The inferred dynamical mass of the disk+star system is 22 . Although this is not a demonstration of the existence of a disk, such a value compares well to the disk mass found in other YSOs with similar mass, as for instance IRAS 20126+4104 (Cesaroni et al. cesa1 (1997)).
The lower limit comes from the unknown inclination angle of the disk with respect to the line of sight. This value is larger than the disk mass derived from the fit to the mm flux densities. Given all the uncertainties, this result is consistent with the hypothesis of a disk of mass 16 , as derived from the fit to the SED (see Sect. 3.1), rotating around a YSO of 6 .

4 The nature of the YSOs in the molecular core

The outflows observed in the HCO+ line witness the existence of embedded YSOs powering them. The question we want to address here is whether these are low- or high-mass stars. The molecular core is significantly colder (30 K) than a “hot core”, whose temperature is typically above 100 K, and also the line width is smaller than that found in hot cores: since hot cores are believed to host newly born massive stars (see Kurtz et al. kcchw (2000)), such a temperature and line width difference might suggest that one is observing lower mass YSOs in the molecular core. To find out whether this is the case, one has to obtain a better constrained estimate of the luminosity of the YSOs.
The presence of two outflows guarantees that at least two distinct YSOs must be present in the core. The possibility that multiple outflows may originate from the same YSO, although it cannot be excluded a priori, seems less supported by the orthogonal position of the two outflows.
According to Churchwell (churc (1997)), the luminosity of the star powering the outflow can be inferred from the mass loss rate. Using his Eq. (1) and our results from Table 5, one obtains 3400 and 170 for the YSOs powering respectively the NE–SW and NNW–SSE outflows. Clearly, the second cannot contribute significantly to the total luminosity estimated in Sect. 3.1, which is dominated by the most massive YSO.
Another luminosity estimate can be calculated from the temperature obtained from the CH3CN lines. We measure 30 K at a distance of 0.03 pc (the radius of the CH3CN emitting region; see Table 3) from the core centre. If the gas is heated by a central star, then it is possible to compute the stellar luminosity. The result depends on the geometry of the core. If this is spherically symmetric, one can use the relation of Scoville & Kwan (sk (1976)), which gives a luminosity of 220 for . Much higher luminosities are predicted, up to 2700 , if instead we use the more canonical value of and Eq. (31) of Goldreich & Kwan (gokw (1974)). For a disk-like geometry, instead, even an O3 star cannot justify a temperature as large as 30 K at a distance of 0.03 pc from the star. It must be noted that this result does not rule out the possibility that one is indeed observing a circumstellar disk, as discussed in Sect. 3.6, but this must be “active”, namely heated internally by viscosity.
Finally, one can infer the luminosity from the mass of the star estimated in Sect. 3.6. The latter is 6 , which implies 1000 for a zero-age main-sequence star or alternatively 3100 for a massive protostar (Behrend & Maeder bema (2001)).
All previous luminosity estimates must be compared to the value obtained from the SED in Fig. 14, which ranges from 160 to 900 . However, the uncertainty in this value is not negligible, as the SED is known only in the millimeter and sub-millimeter regions of the spectrum. On the other hand, the other luminosity estimates are also affected by significant errors. In fact, the relationship used to derive the luminosity from the mass loss rate has a spread of a factor 3, while the value obtained from the core temperature is proportional to , which makes it very sensitive to small errors on . In conclusion, we believe that the estimates obtained are consistent with each other within the uncertainties and that the YSO powering the NE–SW flow is likely to be a B (proto)star with luminosity in the range 1000–3500 , while the NNW–SSE outflow originates from a less massive (proto)star.
We note that for this range of luminosities, the mass infall rate derived from the relation of Churchwell (churc (1997)) and Behrend & Maeder (bema (2001)) turns out to be of the order of 10-3 yr-1, not too different from the mass infall rate derived from the infall velocity. Even though the close correspondence between the two numbers should be taken with caution, given the large uncertainties in the derived quantities and the approximations used, it suggests that gravitational energy might be the main source of luminosity for the YSO powering the water maser.
5 Conclusions
The detection of a mm and sub-mm core at the position of the water maser in S235A-B, as well as of a core in all the molecular lines finally settles the question which is the source that provides the energy for the maser emission and indicates that a new YSO (or a cluster of YSOs) is located in this region and is the powering source of the maser emission. The two close-by nebulosities S235A-B do not seem to be directly related to the YSO, even though belonging to the same star forming complex. Consequently, star formation has not been occurring simultaneously in the extended CO molecular cloud, but rather progressing slowly from the outer parts of the molecular cloud, where S235A and B are placed, to the denser inner part of it, where new YSOs are just being formed.
The present example and a look at the literature on this star forming region indicated the complexity in finding new intermediate luminosity YSOs when they are located in regions where high-mass star formation is already in progress and where their emission is completely obliterated by that of the more evolved regions, especially when the search occurs in the classical domains which were originally used to find them, e.g. cm radio continuum, near IR and H emission. Only water masers, as well as other masers, e.g. methanol (Walsh et al. wmabl (2003)), have remained as good indicators of YSOs (when they are present) and only high resolution mm continuum and molecular line observations are able to pinpoint the YSO emission from that of other close-by more evolved sources (Jenness et al. jsp (1995)).
The detection of two bipolar outflows in S235 is another good indicator of recent star formation. It indicates that more than one YSO might be present or, but more difficult to explain with the present data, multiple episodes of bipolar outflow might originate from the same YSO. Larger scale bipolar outflows detected in this region with lower resolution might be remnants of previous episodes of star formation, but do not seem to be directly related to the two outflows produced by the presently detected YSOs.
Sulphur-bearing molecules (H2CS and SO2) have been detected, similarly to hot cores. Part of the emission appears related with the outflows, suggesting a shock origin, but most of it clearly arises from the molecular core.
The luminosity of the YSO powering the NE–SW flow is estimated to be in the range 1000–3500 , less than that of S235A (1.1 104 ) and the dynamical time of the order of 104 yr, much younger than that of the Hii region around S235A (the canonical value for well developed Hii region is 106 yr). The temperature of the molecular gas of the core (30 K) is smaller than that found in hot cores (100 K) further confirming that the newly detected YSO is intermediate between the massive objects found in hot cores (Kurtz et al. kcchw (2000)) and the low mass class 0 objects (André et al. awb (1999)).
In conclusion, the newly found YSO in between S235A and S235B is a rare example of an intermediate luminosity object and its morphology may be used to connect early evolutionary phases of massive stars with those of low mass protostars of class 0–I.
We find weak evidence for a possible disk in the C34S line, perpendicular to the direction of the main bipolar outflow. If confirmed, this is a further proof of how the complex morphology of star forming regions in the earliest phases can be unveiled only by high resolution molecular observations in high density tracers that can separate the weak emission of the disk from the overwhelming emission of the molecular cloud.
While revealing a new wealth of information, at the same time the latest observations leave some unanswered questions, as for instance the origin of the thermal jet and the nature of the two-velocity structure of the molecular cloud. Are there multiple YSOs in the region of the mm core or a single YSO with multiple episodes of outflows? Why there is no thermal jet associated with the main bipolar outflow? Why is the velocity of the water maser features so different from that of the molecular core? Work is in progress to try to give an answer to these questions.
Acknowledgements.
This research made use of data products from the Midcourse Space Experiment (MSX). Processing of the data was funded by the Ballistic Missile Defense Organization with additional support from NASA Office of Space Science. IRAS HIRES images were obtained from the NASA/IPAC Infrared Science Archive, which is operated by the Jet Propulsion Laboratory, California Institute of Technology, under contract with the National Aeronautics and Space Administration. The James Clerk Maxwell Telescope is operated by the Joint Astronomy Centre in Hilo, Hawaii on behalf of the parent organizations PPARC in the United Kingdom, the National Research Council of Canada and The Netherlands Organization for Scientific Research. T.J. acknowledges the support software provided by the Starlink Project which is run by CCLRC on behalf of PPARC.References
- (1) André, P., Ward-Thompson, D., & Barsony, M., 1999, in Protostar and Planets IV, ed. S. Mannings, A. Boss & S. Russel, Tuscon University Press, 59
- (2) Anglada, G., Villuendas, E., Estalella, R., et al., 1998, ApJ, 116, 2953
- (3) Archibald, E. N., Jenness, T., Holland, W. S., et al. 2002, MNRAS, 336, 1
- (4) Aumann, H.H., Fowler, J.W., & Melnyk, M., 1990, AJ, 99, 1674
- (5) Bachiller, R., Pérez Gutiérrez, M., Kumar M. S. N., & Tafalla, M., 2001, A&A, 372, 899
- (6) Behrend, R., & Maeder, A., 2001, A&A, 373, 190
- (7) Benedettini, M., Molinari, S., Testi, L., & Noriega-Crespo, A., 2003, MNRAS, in press
- (8) Burrows, C.J., Stapelfeldt, K.R., & Watson, A.M., 1996, ApJ, 473, 437
- (9) Cesaroni, R., Felli, M., Testi, L., Walmsley, & C.M., Olmi, L., 1997, A&A, 325, 725
- (10) Cesaroni, R., Felli, M., Jenness, T., et al., 1999a, A&A, 345, 949
- (11) Cesaroni, R., Felli, M., & Walmsley, C.M., 1999b, A&AS, 136, 333
- (12) Churchwell, E., 1997, in Herbig-Haro Flows and the Birth of Low Mass Stars, ed. B. Reipurth & C. Bertout, IAU Symposium 182, Kluwer Academic Publishers, 525
- (13) Codella, C., Felli, M., & Natale, V., 1994, A&A, 284, 233
- (14) Codella C., Testi L., & Cesaroni R., 1997, A&A, 325, 282
- (15) Comoretto, G., Palagi, F., Cesaroni, R., et al., 1990, A&AS, 84, 179
- (16) Curiel, S., Cantó, J., & Rodríguez, L.F., 1987, RevMexAA, 14, 595
- (17) Curiel, S., Rodríguez, L.F., Cantó, J., et al., 1989, Ap. Letters & Comm., 27, 299
- (18) Emerson, D.T., 1995, in Multi-Feed Systems for Radio Telescopes. Eds. Emerson, D. T. & Payne, J. M., ASP Conf. Ser. 75, 309
- (19) Evans, N.J., & Blair, G.N., 1981, ApJ, 246, 394
- (20) Felli M., & Churchwell E., 1972, A&AS, 5, 369
- (21) Felli M., Testi L., Valdettaro R., & Wang, J., 1997, A&A, 320, 594
- (22) Glushkov, Yu.I., Denisyuk, E.K., & Karyagina, Z.V., 1975, A&A, 39, 481
- (23) Goldreich, P. & Kwan, J. 1974, ApJ, 206, 718
- (24) Guilloteau S., Delannoy J., Downes D., et al., 1992, A&A, 262, 624
- (25) Harju, J., Lehtinen, K., Booth, R.S., & Zinchenko, I., 1998, A&AS, 132, 211
- (26) Haschick, A.D., Menten, K.M., & Baan, W.A., 1990, ApJ, 354, 556
- (27) Hatchell, J. Thompson, M. A., Millar, T. J., & Macdonald, G. H., 1998, A&A, 338, 713
- (28) Henkel, C., Haschick, A.D., & Güsten, R., 1986, A&A, 165, 197
- (29) Holland, W.S., Robson, E.I., Gear, W.K., et al., 1999, MNRAS, 303, 659
- (30) Hunter, T.R., Taylor, G.B., Felli, M., & Tofani, G., 1994, A&A, 284, 215
- (31) Israel, F.P., & Felli, M., 1978, A&A, 63, 325
- (32) Jenness, T., Scott P.F., & Padman, R., 1995, MNRAS, 276, 1024
- (33) Jenness, T., & Lightfoot, J.F., 1998, in Astronomical Data Analysis Software and Systems VII, Eds. Albrecht R., Hook R.N. & Bushouse H.A., ASP Conf. Ser. 145, 216
- (34) Jenness, T., Holland, W. S., Chapin, E., Lightfoot, J. F., Duncan, W. D., 2000, Astronomical Data Analysis Software and Systems IX, Eds. Manset, N., Veillet, C., & Crabtree, D., ASP Conf. Ser. 216, 559
- (35) Jenness, T., Stevens, J. A., Archibald, E. N., et al., 2002, MNRAS, 336, 14
- (36) Krassner, J., Pipher, J.L., Sharpless, S., & Herter, T., 1982, A&A, 109, 223
- (37) Kurtz, S., Cesaroni, R., Churchwell, E., Hofner, P., & Walmsley, C.M., 2000, Protostars and Planets IV, ed. Mannings V., Boss A., Russel S. (Tucson: Univ. of Arizona Press), 299
- (38) Lafon, G., Deharveg, L., Baudry, A., & de La Noë, J., 1983, A&A, 124, 1
- (39) MacLaren, I., Richardson, K. M., & Wolfendale, A. W., 1988, ApJ, 333, 821
- (40) Moore, T.J.T., Mountain, C.M., Yamashita, T., & McLean, L.S., 1991, MNRAS, 248, 337
- (41) Myers, P.C., Mardones, D., Tafalla, M., Williams, J.P., & Wilner, D.J., 1996, ApJ, 465, L133
- (42) Nakano, N., & Yoshida, S., 1986, Pub. Astron. Soc. Japan, 38, 531
- (43) Palla, F., & Stahler, S.W., 1999, ApJ, 525, 772
- (44) Panagia, N., & Felli, M., 1975, A&A, 39, 1
- (45) Reynolds, S. P., 1986, ApJ, 304, 713
- (46) Scoville, N.Z., & Kwan, J., 1976, ApJ, 206, 718
- (47) Sharpless, S., 1959, ApJS, 6, 257
- (48) Shepherd, D.S., Testi, L., & Stark, D.P., 2003, ApJ, 584, 882
- (49) Tofani, G., Felli, M., Taylor, G.B., & Hunter, T.R., 1995, A&AS, 112, 299
- (50) Torrelles, J.M., Ho, P.T.P., Rodríguez, L.F., & Cantó, J., 1985, ApJ, 288, 595
- (51) van der Tak, F. F. S., Boonman, A. M. S., Braakman, R., & van Dishoek, E. F., 2003, A&A, 412, 133
- (52) Walsh, A.J., Macdonald, G.H., Alvey, N.D.S., Burton, M.G., & Lee, J.-K., 2003, A&A, 410, 597