HST/WFPC2 morphologies and color maps of distant luminous infrared galaxies
Using HST/WFPC2 imaging in F606W (or F450W) and F814W filters, we obtained the color maps in observed frame for 36 distant (0.41.2) luminous infrared galaxies (LIRGs, Lm) L⊙), with average star formation rates of 100 M⊙ yr-1. Stars and compact sources are taken as references to align images after correction of geometric distortion. This leads to an alignment accuracy of 0.15 pixel, which is a prerequisite for studying the detailed color properties of galaxies with complex morphologies. A new method is developed to quantify the reliability of each pixel in the color map without any bias against very red or blue color regions.
Based on analyses of two-dimensional structure and spatially resolved color distribution, we carried out morphological classification for LIRGs. About 36% of the LIRGs were classified as disk galaxies and 22% as irregulars. Only 6 (17%) systems are obvious ongoing major mergers. An upper limit of 58% was found for the fraction of mergers in LIRGs with all the possible merging/interacting systems included. Strikingly, the fraction of compact sources is as high as 25%, similar to that found in optically selected samples. From their K band luminosities, LIRGs are relatively massive systems, with an average stellar mass of about 1.11011 M⊙. They are related to the formation of massive and large disks, from their morphologies and also from the fact that they represent a significant fraction of distant disks selected by their sizes. If sustained at such large rates, their star formation can double their stellar masses in less than 1 Gyr. The compact LIRGs show blue cores, which could be associated with the formation of the central region of these galaxies. We find that all LIRGs are distributed along a sequence which relate their central color to their concentration index. This sequence links compact objects with blue central color to extended ones with relatively red central color, which are closer to the local disks. We suggest that there are many massive disks which are still forming a large fraction of their stellar mass since = 1. For most of them, their central parts (bulge?) were formed prior to the formation of their disks.
Key Words.:
galaxies: formation — galaxies: evolution — infrared: galaxies1 Introduction
The evolution of the cosmic star formation density (CSFD) exhibits the history of the stellar mass assembly averaged over all galaxies. A sharp decline of the CSFD since 1 has been found, whereas large uncertainties still remain at higher redshifts, particularly due to the uncertainties and biases regarding dust extinction (e.g. Madau et al. Madau (1996); Hammer et al. Hammer97 (1997)). Investigations of global stellar mass density as a function of redshift indicate that more than one quarter, probably up to half of the present day stars were formed since 1 (Dickinson et al. Dickinson (2003) and references therein). This is in agreement with an integration of the CSFD if the latter accounts for all the light re-radiated at IR wavelengths (Flores et al. Flores (1999)). Hence the star-forming activities since 1 still play an important role in the formation of the galaxy Hubble sequence seen in the local universe.
Hubble Space Telescope (HST) observations show that the merger rate increases significantly at 1, compared with that in the local universe (Le Fvre et al. Fevre (2000); Conselice et al. Conselice (2003)). Such events were claimed to be related to dwarf galaxies while massive systems have almost formed before redshift 1 (Brinchmann & Ellis BrinchmannEllis (2000); Lilly et al. Lilly98 (1998); Schade et al. Schade (1999)). However, with Infrared Space Observatory (ISO) mid-infrared imaging, Flores et al. (Flores (1999)) inferred that a substantial fraction of star formation since 1 is associated with the LIRGs. These objects are luminous star-forming galaxies at intermediate redshifts (0.5 to 1), different from the faint blue galaxy population (Genzel & Cesarsky Genzel (2000); Franceschini et al. Franceschini03 (2003)). It is widely accepted that merger/interaction is very efficient in pushing gas into nuclear region and triggering violent star formation. Therefore LIRGs are suspected to be merging systems and the evolution of these galaxies is linked to the decline of the merger rate (Elbaz et al. Elbaz (2002)). Although HST imaging showed that most of the LIRGs are luminous disk/interacting galaxies (Flores et al. Flores (1999)), systematic investigation of their properties is still required to understand their formation and evolution, as well as link them to the counterparts in the local universe.
Morphological classification is essential to revealing the nature of the distant LIRGs. However, at high redshifts, it becomes difficult to classify galaxy morphology securely because, the images of the high-z galaxies suffer from reduced resolution, band-shifting and cosmological surface brightness dimming effects, compared with the local objects. With HST Wide Field Planet Camera 2 (WFPC2) high resolution imaging in two or more bands, spatially resolved color distribution can be used to investigate the distribution of the stellar population, which is complementary to addressing the appearance in single band. Furthermore, the star-forming regions and dusty regions can stand out in the color map. This is very important to the study of LIRGs, in which these regions are expected to be numerous.
Canada-France Redshift Survey (CFRS) fields are among the most studied fields at various wavelengths. Two CFRS fields 0300+00 and 1415+52 had been observed deeply by ISOCAM at 15 m (Flores et al. Flores (1999); 2004 in preparation) and by HST (Brinchmann et al. Brinchmann (1998)). Aimed at performing detailed analyses of morphology, photometry and color distribution for distant LIRGs, additional HST images through blue and red filters have been taken to complement the color information for the two CFRS fields (PI: Hammer, Prop. 9149). In this work, we present the preliminary results of the color distribution of the distant LIRGs. We correct additional effects in HST images and recenter them accurately, which allow us to access the color maps of complex galaxies. We also implement a method to quantify the signal-to-noise (S/N) ratio of the color image in order to give a reasonable cut for the target area in color maps.
This paper is organized as follows. Sect. 2 describes the HST imaging observations and the archive data we adopt. In Sect. 3, we describe the various effects which have to be corrected for aligning images in different WFPC2 filters. In Sect. 4, we describe a method we use to generate the color maps. In Sect. 5, we summarize the morphological properties of the distant LIRGs. The results we obtained of the LIRGs are discussed in Sect. 6. Brief conclusions are given in Sect. 7. Throughout this paper we adopt H0 = 70 km s-1 Mpc-1, = 0.3 and = 0.7. Unless specified, we exclude PC chip and the unit of pixel refers to that in WF chips. The bands B450, V606 and I814 refer to HST filters F450W, F606W and F814W, respectively. Vega system is adopted for our photometry.
| Field | BlueFilter | Total Exp. | Na | Ditherb | RedFilter | Total Exp. | Na | Ditherb | Prop.IDc |
|---|---|---|---|---|---|---|---|---|---|
| 030226+001348 | F606W | 6400 | 5 | 20 | F814W | 6000 | 5 | 20 | 9149 |
| 030227+000704 | F450W | 7000 | 5 | 20 | F814W | 6700 | 5 | 20 | 6556,5996 |
| 030233+001255 | F450W | 6600 | 6 | 0 | F814W | 6400 | 6 | 0 | 5449 |
| 030237+001414 | F606W | 6400 | 5 | 20 | F814W | 6400 | 5 | 20 | 9149 |
| 030240+000940 | F606W | 6400 | 5 | 20 | F814W | 7000 | 5 | 12.5 | 9149,8162 |
| 030243+001324 | F450W | 6600 | 6 | 0 | F814W | 6400 | 6 | 0 | 5449 |
| 030250+001000 | F606W | 6400 | 5 | 20 | F814W | 7000 | 5 | 12.5 | 9149,8162 |
| 141743+523025 | F450W | 7800 | 6 | 0 | F814W | 7400 | 6 | 0 | 5449 |
| 141803+522755 | F606W | 6400 | 5 | 20 | F814W | 6800 | 5 | 20 | 9149 |
| 141809+523015 | F450W | 7800 | 6 | 0 | F814W | 7400 | 6 | 0 | 5449 |
| 141724+522512 | F606W | 2800 | 4 | 0 | F814W | 4400 | 4 | 0 | 5090 |
| 141731+522622 | F606W | 2800 | 4 | 0 | F814W | 4400 | 4 | 0 | 5090 |
| 141737+522731 | F606W | 2800 | 4 | 0 | F814W | 4400 | 4 | 0 | 5090 |
| 141750+522951 | F606W | 2800 | 4 | 0 | F814W | 4400 | 4 | 0 | 5090 |
| 141743+522841 | F606W | 24400 | 12 | 0 | F814W | 25200 | 12 | 0 | 5109 |
| 141757+523101 | F606W | 2800 | 4 | 0 | F814W | 4400 | 4 | 0 | 5090 |
| 141803+523211 | F606W | 2800 | 4 | 0 | F814W | 4400 | 4 | 0 | 5090 |
-
a
Number of exposures.
-
b
Dither offset among the consecutive exposures, aimed to remove cosmic-rays and hot/bad pixels. Here the largest offset in unit of pixel along x axis is present.
-
c
HST Proposal ID. One ID means that both the blue and the red observations were carried out in the same proposal. Two IDs refer to the proposals that the blue and the red observations were observed respectively.
2 Observations
In the CFRS, ground-based spectroscopic redshift identification was carried out with CFHT telescope for objects brighter than 22.5 mag (IAB) in five 10 fields (see Crampton et al. Crampton (1995) for details). With improved data reduction, Flores et al. (Flores04 (2004)) present the updated catalogs of the deep ISOCAM observations at 15 m for the two CFRS fields 0300+00 and 1415+52 (see also Flores et al. Flores (1999)).
Using high resolution HST/WFPC2 imaging, the distant galaxies up to z1 can be spatially resolved. Three HST fields were observed in F606W and F814W filters in the two CFRS fields with ISOCAM observations (in Cycle 10, PI: Hammer, Prop. 9149), and two fields in F606W filter were observed to complement the observations in F814W during Cycle 8 (PI: Lilly, Prop. 8162). F606W and F814W filters respectively correspond to rest-frame U (3634 Å) and V (4856 Å) at a redshift 0.65. Those fields were chosen so that to maximize the number of LIRGs contained in each field. We also collected the HST imaging data with two bands observations in the CFRS fields. A detailed description of the previous CFRS field HST imaging survey was presented in Brinchmann et al. (Brinchmann (1998)). The CFRS 1415+52 field partially overlaps the Groth Strip Survey (GSS, Groth et al. Groth (1994)). We included the GSS imaging data into our analysis.
Table 1 summarizes the HST imaging data used in this analysis. The total exposure time is usually more than 6000 seconds, in which the surface brightness corresponding to 1 above the background is 25.5 mag arcsec-2. Note that the GSS is relatively shallow except for one very deep field. Here we list the seven of 28 GSS fields covering the CFRS 1415+52 field. The 28 GSS fields are composed of 27 fields observed in Prop. 5090 (PI: Groth) and one very deep field in Prop. 5109 (PI: West Phal). Simard et al. (Simard (2002)) carried out a detailed morphological analysis on the GSS observations. They also provided the physical scale and absolute magnitude for objects with spectroscopic redshift identification using the Keck telescope. We quoted these results directly and further details can be found in their paper. The observation was divided into N exposures (col. 4 and 8 in Table 1) aimed at removing cosmic-rays and correcting the bad/hot pixels.
3 Image alignment
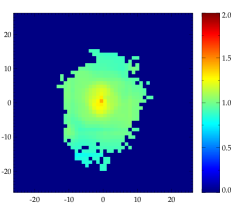
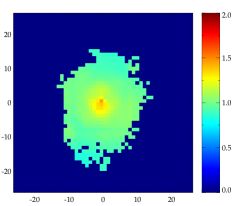
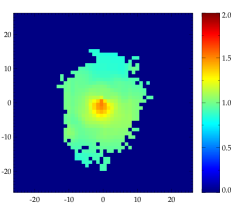
Studies have been reported on investigating color maps for the spheroidal galaxies at intermediate redshifts (e.g. Abraham et al. Abraham (1999); Ellis et al. Ellis (2001)). In generating the color map, a difficulty is to align two images accurately in order to keep each pixel of the same object at the same position in two images. For the spheroidal galaxies, generally the brightness peaks at the galaxy center in different bands. It would be technically easy to correct relative shifts between two images if the galaxy center is used to be a reference. For the galaxies with complex morphologies, however, caution should be taken in determining the relative shifts because their irregular morphologies as well as contamination from star-forming regions could easily blank the efforts of finding a reliable reference point (e.g. the galaxy center in spheroidal galaxies). Such a difficulty becomes more serious for galaxies at intermediate redshifts when band-shifting effect becomes significant. The uncertainty in aligning two images is required to be much smaller than one pixel in addressing color distribution pixel-by-pixel. We model the color map VI814 to imitate the effect of the alignment offset on the color map. We use the modeled HST/WFPC2 images of an elliptical galaxy at redshift 0.299 with a de Vaucouleurs bulge+exponential disk structure (B/T = 0.84) given by GIM2D (Simard et al. Simard (2002)), in order to avoid the contamination by the intrinsic color fluctuation. Fig. 1 illustrates that an offset as small as 0.3 pixel will cause false structure “half-blue and half-red” in the color map (right panel), compared with the color map with zero offset (left panel). Such effect becomes marginal when the offset decreases to 0.15 pixel (middle panel), which is the typical uncertainty in our image alignment. Instead of operating on individual objects, we dealt with the whole images in data processing. The main efforts in data reduction to align images are summarized below.
The raw HST images were processed using the standard STScI pipeline. For HST/WFPC2 observations in integer-pixel dither mode with telescope relative offsets larger than a few pixels, camera geometric distortion will cause an additional shift (increasing toward the CCD corners, see HST/WFPC2 handbook for more details). We correct the geometric distortion for each individual exposure in a data set before combining them. Table 1 tabulates the dither offsets, usually twenty pixels (at which, an additional shift of about half pixel due to the geometric distortion is present at the WF chip corners) except for those in Proposal 5449 and GSS, in which consecutive exposures were taken at the same position and the distortion correction was not applied. The shifts between the exposures were obtained using two approaches, cross-correlation and point source reference. The cross correlation technique is to shift and/or rotate one image relative the other to maximize the cross-correlation between the two images, i.e. the best match. In the later approach, the shifts are derived from a comparison of the locations of a number of point and point-like sources in individual exposures. In our work, the point and point-like sources refer to the objects satisfying Full Width at Half Magnitude (FWHM) 2.5 pixels, 17 22, 17 23 and 17 23. These criteria exclude the extended objects and those saturated or faint. For each WFPC2 field, at least three reference sources are used to derive the relative shifts between the different exposures. Both of the two approaches use real images/objects to derive the shifts and hence are free from guide star acquisition uncertainties. In general, the derived shifts are remarkably consistent with each other within 0.08 pixel and even better for crowded fields. For sparse fields and some fields with large dither offsets, the cross-correlation is not the best approach and the measurement using the point source reference will be adopted. The cross-correlation is also not suitable to find the rotation angle and the shifts between images in different bands. The morphologies and brightness of the astronomical sources may differ in one wavelength window from those in another. The cross-correlation would be biased by the sources with a real center offset between different bands, which is often seen in spiral and irregular galaxies. Geometric distortion correction, cosmic-ray removement, image combination are accomplished using the STSDAS/DITHER package (version 2.0, Koekemoer et al. Trauger (1995)).


In some of the fields, blue images and red images were taken in different cycles, i.e. HST telescope pointings in two bands were not the same, which results in different relative rotations and shifts between them. We have used point-like sources as references to determine the rotations and the shifts. In practice, we obtain the relative rotation angle from astrometric information recorded in the image header. The keyword ORIENTAT provides the position angle of the telescope pointing. Normally the uncertainty of the position angle determination is 0.003 degree, compared to an rotation deviation 0.01 degree causing 0.1 pixel offset at the corners of a WF chip. Table 2 lists the shift and the rotation angle of the blue image relative to the red one for the WF3 chip. Note that in image combination, the first image of the data set is always taken as reference to stack images.
To exhibit the advantages of the point source reference method, it is worth showing that a systematic shift exists between V606 image and I814 image in the observations of the 27 GSS fields in Prop. 5090. The observation of each field was splitted into 8 exposures in V606 and I814 bands alternately at the same location, i.e. no offset between consecutive exposures and 4 exposures for each filter. For the 8 exposures of each field, we derive the shifts relative to the first I814 exposure by comparing the positions of point and point-like sources in individual exposures. It is assumed that there is no relative shift/rotation among individual chips during each exposure. At least 3 reference sources (usually 7 , even more than 10 for some fields) in three WF chips are used to give median shifts in X and Y axes. Fig. 2 illustrates the distribution of the relative shifts of the rest 7 exposures to the first one for all the 27 GSS fields. It reveals the systematic offset between V606 and I814 images. The shifts for each field are tabulated in Table 2. Combining the 27 fields, we get median shift of x = 0.20 pixel and y = 0.08 pixel.
Fig. 3 shows the distribution of the position offsets of 178 point/point-like sources in two aligned images for 11 CFRS fields and 28 GSS fields. The median of X offset is 0.006 pixel with a corresponding semi-inter-quartile range (SIQR) of 0.036 pixel and the median of Y offset is 0.004 pixel with an SIQR of 0.070 pixel. The figure shows that the systematic offsets have been corrected. The center offset, , can be used to measure the uncertainty of an alignment. For the 178 point/point-like sources, the mean value of the center offset is 0.117 pixel. This denotes that the images are well aligned and can be used for generating color maps.


It is worth noting that many sources do show a center offset in different band images. Fig. 4 shows the center offset against the distance from the chip center for all sources (left panel) with I814 brighter than 22 mag, compared to the distribution for point/point-like sources (right panel). It is clear that a) the offset is free from the position-dependent effect (e.g. geometric distortion); b) a substantial fraction of sources show a large center offset (up to a few pixels), as shown in the histogram of the center offset (middle panel). In addition, we also plot the center offset distribution for our ISOCAM detected sample (see Sect. 5.1). On average, ISOCAM galaxies present larger offsets than other sources, which can be related to their intrinsic morphological properties. We use the software Sextractor (Bertin & Arnouts Bertin (1996)) to extract source catalogs, including central positions and integrated fluxes. For galaxies with complex morphologies, the central positions given in Sextractor are not always their brightness peaks. An aperture of 3 is adopted in our photometry. The updated Charge Transfer Efficiency (CTE) correction (Dolphin Dolphin02 (2002)) and updated photometric zeropoints are adopted in WFPC2 photometry calibration in Vega system (Dolphin Dolphin00 (2000)).
| Field | x(pixel) | y(pixel) | () |
|---|---|---|---|
| CFRS Fields | |||
| 030226+001348 | 2.28 | 2.50 | 0.550 |
| 030227+000704 | 4.31 | 14.00 | 0.188 |
| 030233+001255 | 0.00 | 0.15 | 0.000 |
| 030237+001414 | 5.54 | 5.37 | 1.200 |
| 030240+000940 | 9.76 | 8.90 | 0.185 |
| 030243+001324 | 0.05 | 0.36 | 0.000 |
| 030250+001000 | 20.65 | 7.04 | 0.070 |
| 141743+523025 | 0.35 | 0.32 | 0.000 |
| 141803+522755 | 6.47 | 7.15 | 1.600 |
| 141809+523015 | 0.03 | 0.36 | 0.000 |
| 221755+001715 | 8.59 | 3.99 | 0.188 |
| Groth Strip Fields | |||
| 141527+520410 | 0.25 | 0.05 | 0.000 |
| 141534+520520 | 0.19 | 0.08 | 0.000 |
| 141540+520631 | 0.19 | 0.13 | 0.000 |
| 141547+520741 | 0.18 | 0.05 | 0.000 |
| 141553+520851 | 0.18 | 0.08 | 0.000 |
| 141600+521001 | 0.29 | 0.08 | 0.000 |
| 141606+521111 | 0.17 | 0.07 | 0.000 |
| 141613+521222 | 0.19 | 0.05 | 0.000 |
| 141619+521332 | 0.21 | 0.04 | 0.000 |
| 141626+521442 | 0.23 | 0.17 | 0.000 |
| 141632+521552 | 0.26 | 0.13 | 0.000 |
| 141638+521702 | 0.22 | 0.10 | 0.000 |
| 141645+521812 | 0.31 | 0.10 | 0.000 |
| 141651+521922 | 0.31 | 0.03 | 0.000 |
| 141658+522032 | 0.19 | 0.07 | 0.000 |
| 141704+522142 | 0.10 | 0.10 | 0.000 |
| 141711+522252 | 0.20 | 0.11 | 0.000 |
| 141717+522402 | 0.15 | 0.02 | 0.000 |
| 141724+522512 | 0.21 | 0.08 | 0.000 |
| 141731+522622 | 0.20 | 0.01 | 0.000 |
| 141737+522731 | 0.20 | 0.03 | 0.000 |
| 141750+522951 | 0.02 | 0.11 | 0.000 |
| 141757+523101 | 0.21 | 0.09 | 0.000 |
| 141803+523211 | 0.25 | 0.02 | 0.000 |
| 141810+523320 | 0.27 | 0.08 | 0.000 |
| 141816+523430 | 0.26 | 0.05 | 0.000 |
| 141823+523540 | 0.09 | 0.06 | 0.000 |
4 Color map
To obtain the color map image of an extended source, a key point is to quantitatively select the pixels in the color map with reliable color determination. Instead of adopting a semi-empirical noise model (Williams et al. Williams (1996)), a method is developed to obtain the signal-to-noise (S/N) ratio of the color map image pixel-by-pixel. Using this S/N ratio image, the color map area can be constrained for the extended source. Adopting an approximation that the Poisson noise distribution function in an HST image is close to a Log-normal law, we can obtain that for two images with signals , and noises , , the noise of the their color image satisfies
| (1) |
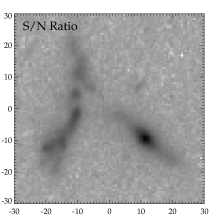
Here, the signals and the noises include the ones from both source and sky background. A detailed explanation can be found in Appendix. The inverse of the noise is proportional to the S/N ratio. Applying this formula to blue and red images pixel-by-pixel, an S/N ratio image associated with the color image can be obtained. This S/N ratio image is indeed for the “color image” of source+sky background. In the pixels that the source’s signal is weak, the noise is dominated by that from the sky background. In the S/N ratio image, the fluctuation of the background reflects the uncertainty in the color map image caused by the sky background noise. The color map pixels with S/N ratio value much higher than the mean S/N ratio background should be much less affected by the noise from the sky background and have reliable color determination. A criterion of 4 above the mean background of the S/N ratio image is adopted as the detection threshold in the color map image and conjunct pixels consist of the color map for a target. The color map is given in the HST Vega system and zero background is set in the area below the threshold.
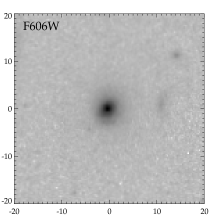
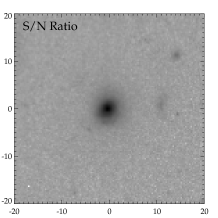
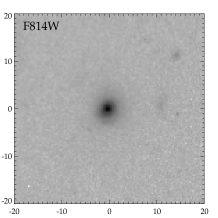
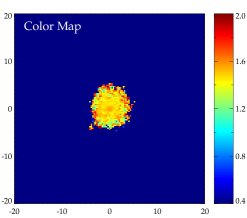
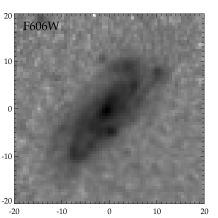
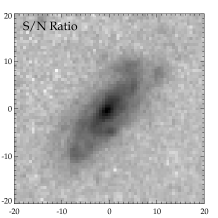
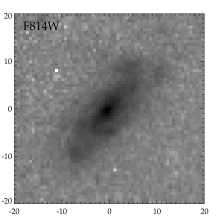
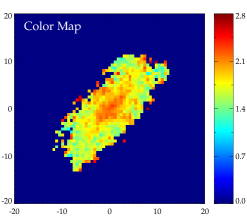
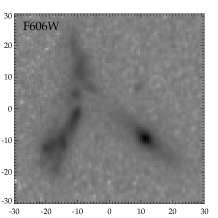
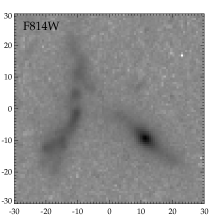
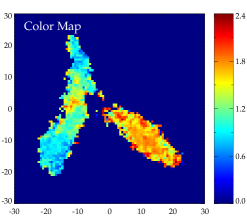
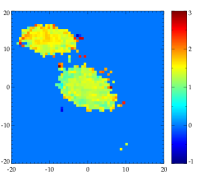
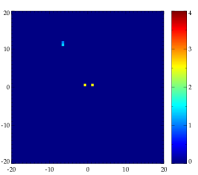
The S/N ratio image can give a quantitatively measurement of the reliability of each pixel in the color map image. The S/N ratio image does not introduce any bias against very red or very blue color regions because it accounts for both the S/N of the two WFPC2 images. The S/N ratio image is shown with V606 and I814 images in three typical cases, elliptical galaxy (Fig. 5), spiral galaxy (Fig. 6) and merging system (Fig. 7). The resulted color map image with the S/N ratio image is displayed as well. The color bar next the color map stamp shows the color scheme in the observed frame. The color range is adjusted for a best visualization. Each stamp is labeled at its top-left corner. In Fig. 5 and Fig. 6, each stamp has a size of 4040 kpc while in Fig. 7 the size of each stamp is 6060 kpc.
5 Morphologies of LIRGs
5.1 LIRG sample
The 17 HST imaging fields cover about 87 of 200 square arcminute area of the CFRS fields 0300+00 and 1415+52. We obtained either BI814 or VI814 color maps for 265 galaxies (I). Among them, 169 have spectroscopic redshifts given in the CFRS redshift catalog or in the literature. ISOCAM observations detected 60 objects and 77 objects brighter than 300 Jy at 15m with S/N 5 in the CFRS fields 0300+00 and 1415+52, respectively. Of the 137 objects, color map is available for 33 objects in the 0300+00 field and 26 objects in the 1415+52 field. In the 137 ISOCAM detected objects, 82.5% (113) have optical counterparts brighter than 22.5 mag and 94.2% (129) brighter than 23.5 mag in IAB band. For objects fainter than IAB = 22.5 mag, the imaging sample points are limited for deriving reliable morphological parameters and color distribution. Therefore they are not included in this analysis. Since the vast majority of ISOCAM detected objects are indeed optically bright, this would not cause a significant bias. Note that the fraction of ISOCAM sources imaged by HST (59 among 113 I galaxies, 52.2%) is larger than the area fraction of HST imaging of the two CFRS fields (87 against 200 square arcminute, 43.5%), because our survey includes complementary data aimed at investigating ISO source morphologies.
In the 59 ISOCAM detected galaxies, 53 objects are with known redshifts, including 2 objects at z 1.2 which have been removed from our sample.
Table 3 lists the complete sample of ISOCAM galaxies which have been imaged by HST in two bands. The objects are organized into three groups, 6 with unknown redshift, 15 in nearby () and 36 in distant () universe. Nearby galaxies are not IR luminous (L L⊙) and can not be taken as the local counterparts of the distant LIRGs. The 36 distant objects are used to reveal the morphological properties of the distant LIRGs. In each group, the objects are tabulated in the order of their CFRS identifications. In Table 3, the apparent magnitudes (Col. 3), (Col. 4) and (Col. 5) are given in HST Vega system. An aperture of 3 is adopted for the HST image photometry. Absolute B band magnitude (Col. 6) and K band magnitude (Col. 7) are provided in AB system, using isophotal magnitudes from the ground-based imaging (Lilly et al. Lilly95 (1995)). The K-correction is calculated based on ground-based B, V, I and K band CFRS photometry (see Hammer et al. Hammer01 (2001) for details). IR luminosity is tabulated in Col. 8. Three models are used to calculate the IR luminosity and derive proper uncertainties (see Flores et al. Flores04 (2004) for details). Fig. 8 shows the IR luminosity distribution for the 36 distant LIRGs.

5.2 Morphological classification
Based on HST imaging, two-dimensional fitting has been carried out to derive structural parameters which are used to quantify the morphological features. With the structural parameters and information derived from color maps, morphological classification is performed by two researchers independently.
5.2.1 Structural parameters
The two-dimensional fitting is performed using the software GIM2D (see Simard et al. Simard (2002) for more details). Two components, bulge and disk, are used to fit the surface brightness distribution. The fractions of bulge luminosity in total B/T and are listed in Table 3 (from Col. 9 to Col. 14) . The parameter B/T is correlated with the Hubble type increasing for early type galaxies. In addition to the “quality” parameter , the residual image, which is a difference between the observed image and the modeled image, is also used to estimate the quality of the fitting. Good fitting is characterized by a close to unity and a residual image with random-distributed little residual emission. However, in the case of spiral galaxy with visible arms, the residual image exhibiting regular arms will refer to the fitting as good one even though value is biased to be different from unity due to the presence of arms. Inclination angle of the disk is also derived from the two-dimensional fitting.
5.2.2 Color distribution properties
With information provided by color distributions, morphological classification can be improved dramatically. The appearance in a color map is free from the arbitrary adjustment in visualization of an image. Physical properties can be derived from the color map including whether some regions are dusty or star-forming. Apart from the usual way of the morphological classification based on the brightness distribution, the color information provides a new window to compare distant galaxies with local galaxies in the Hubble sequence.
We obtain color map for each LIRG in the observed frame. Instead of applying K-correction and deriving the color in rest frame, we compare the observed color with the modeling color. Fig. 9 illustrates the modeled color-redshift curves for VI814 and BI814. Using GISSEL98 (Bruzual & Charlot Bruzual (1993)), the observed colors in HST Vega system are given at different redshifts for four galaxy models, corresponding to elliptical (single burst), S0 (Gyr), Sbc (Gyr) and irregular galaxy (constant star formation rate with a fixed age of 0.06 Gyr). We assume a formation epoch at a redshift of . Distant LIRGs are compared with the models using their integrated colors. Almost all LIRGs are redder than an Sbc galaxy. Using the modeled color-redshift relations, we investigate the colors of specified regions. We refer to the region in outskirts as red as or redder than an elliptical galaxy as dusty region and the region off the central area bluer than an Sbc galaxy as star-forming region.


5.2.3 Morphology labels
By visually examining galaxy morphologies, we have tried to label each target with ‘Hubble type’. For the galaxies well fitted by bulge+disk two-dimensional structure, we divide them mainly into five types in terms of the fraction of bulge luminosity in total: E/S0 (0.8 B/T 1), S0 (0.5 B/T 0.8), Sab (0.15 B/T 0.5), Sbc (0 B/T 0.15) and Sd (B/T = 0). We also introduce three additional types to describe the compact (C) galaxy which is too concentrated to be decompositioned, irregular (Irr) galaxy and ‘tadpole’ (T) galaxy. Quality factor is provided to represent our confidence of our classification: 1 – secure, 2 – merely secure, 3 – insecure and 4 – undetermined. We also provide a classification for galaxies which show signs of interacting or merging: M1 – obvious merging, M2 – possible merging, I1 – obvious interaction, I2 – possible interaction and R – relics of merger/interaction.
Machine is not flexible and the experienced eye is essential to classify the objects differing significantly from the adopted models in machine. With information from the two-dimensional structure fitting and the color map, the visual examination is carried out by two of the authors F.H. and X.Z.Z. independently, aimed to reduce some arbitrariness from different viewers. The classifications are consistent with each other for most objects. After fully discussing on a few objects, a final morphological classification for the LIRG sample is available. In Table 3, galaxy type (Col. 15), quality factor (Col. 16) and Interaction/merging type (Col. 17) are listed.
5.3 Individual description
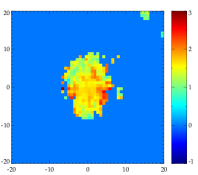
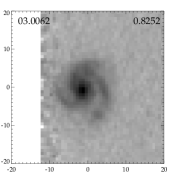
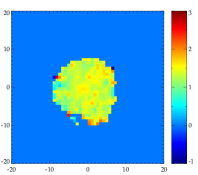
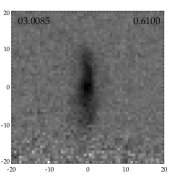
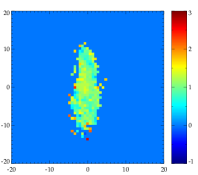
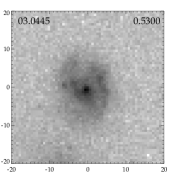
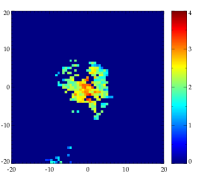
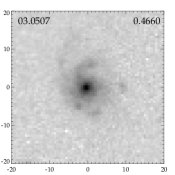
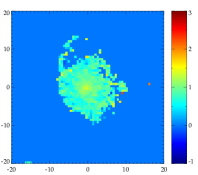
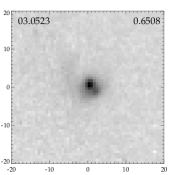
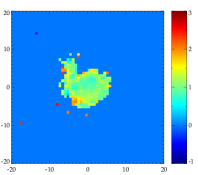
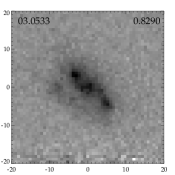
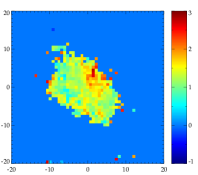
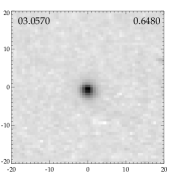
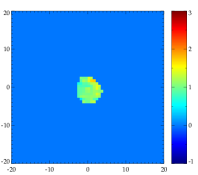
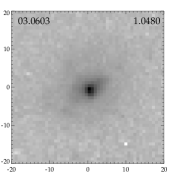
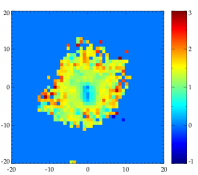
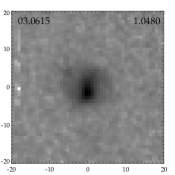
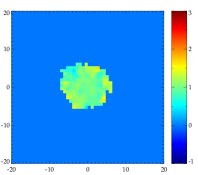
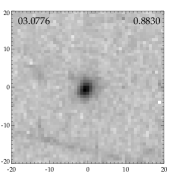
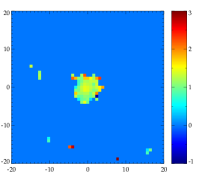
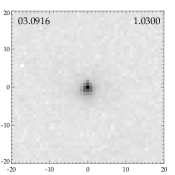
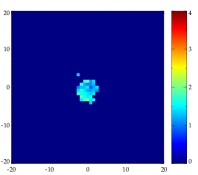
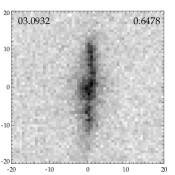
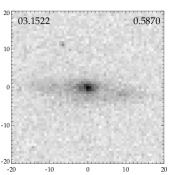
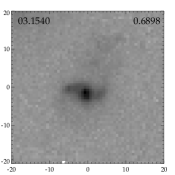
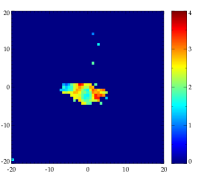
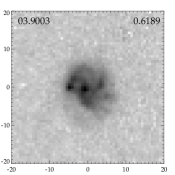
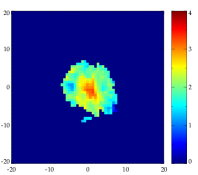
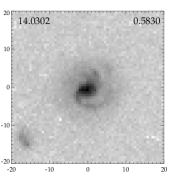
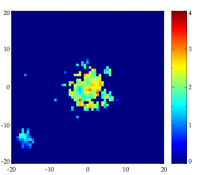
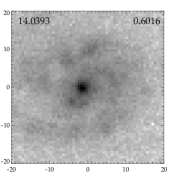
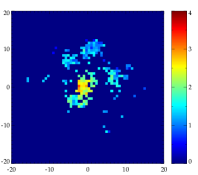
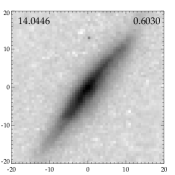
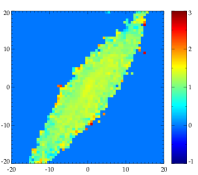
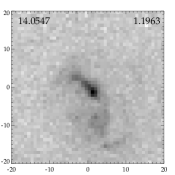
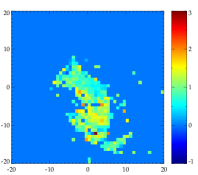
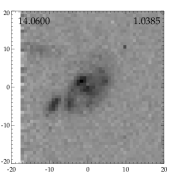
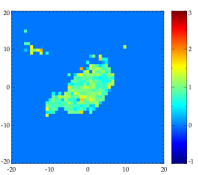
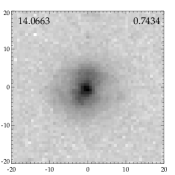
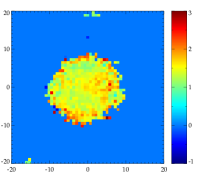
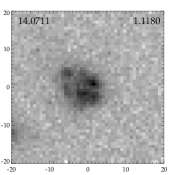
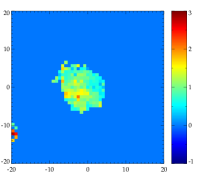
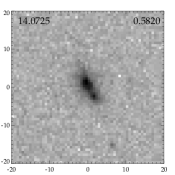
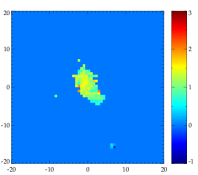
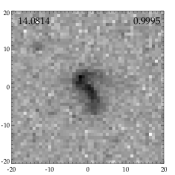
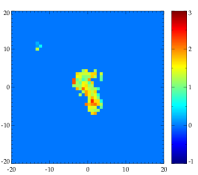
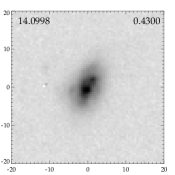
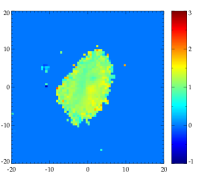
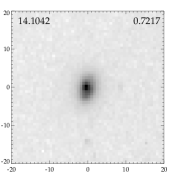
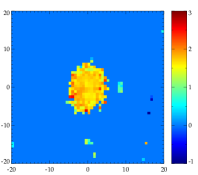
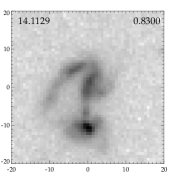
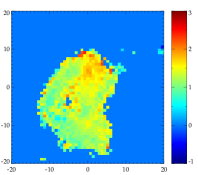
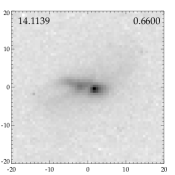
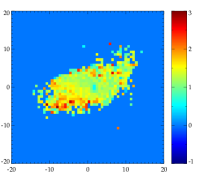
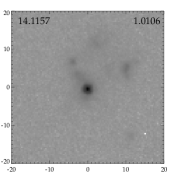
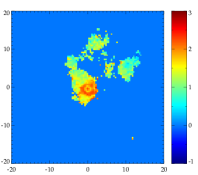
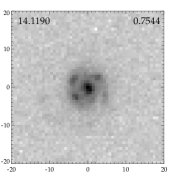
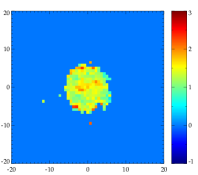
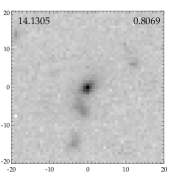
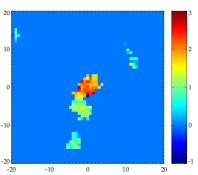
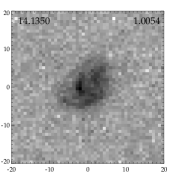
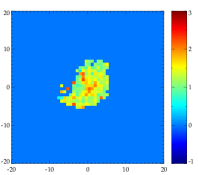
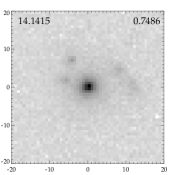
In Fig. 10, color map stamps (right) of the 36 LIRGs are shown, along with I814 imaging negative greylevel stamps (left). The stamps are given in an order of CFRS identification (from left to right, top to bottom). Color bar in each color map stamp shows the color range. The same color ranges over 1 to 3 and 0 to 4 are applied to all objects in VI814 and BI814, respectively. For the 36 LIRGs, the morphologies as well as the color distributions are remarkably different. A description of each target is present in turn.
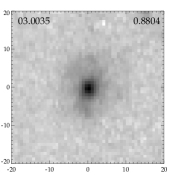
- 03.0035
-
This galaxy has a morphology of a bright bulge surrounded by diffuse emission. Spiral arm-like structures, or tidal tails are perceptible in the diffuse region. Color map shows that the bulge has a color comparable to that of an S0 galaxy. Dusty regions and star-forming regions are revealed in the color map.
- 03.0062
-
Its clear and regular spiral arms surrounding a spheroid core as well as its round appearance suggest that this is a face-on spiral galaxy. Color map confirms the red central region to be a bulge with color close to that of an S0 galaxy. Star-forming regions are distributed along the arms.
- 03.0085
-
This is an edge-on spiral galaxy (75). This galaxy is imaged close to the chip border and the light distribution is not completely recorded. However, the light distribution can still reveal that the central bright region is not a bulge. Color map exhibits symmetric arc structures with color close to that of an irregular galaxy, suggesting star formation in the disk.
- 03.0445
-
WFPC2 image and color map show a spheroidal component in the center surrounded by blue diffuse emission. Arm structures are visible in the surrounding regions. This galaxy is classified as an Sbc galaxy. The arms are asymmetric and it is not clear whether such asymmetric arms are related to an interaction/merger event.
- 03.0507
-
This is a face-on spiral galaxy with a red bulge surrounded by blue diffuse emission. Arm structures and star-forming knots can be seen around the red bulge. A striking long filament, different from a spiral arm, could be associated with a stripe remnant of an infalling dwarf galaxy.
- 03.0523
-
This is a “tadpole” galaxy. It is widely believed that such “tadpole” feature is an indicator of major merger in advanced phase. The tidal tail is clearly seen in WFPC2 image. Color map exhibits a conspicuous color gradient that the central region is bluer than the outer region. The concentrated light distribution suggests this object to be a compact galaxy.
- 03.0533
-
The morphology of this galaxy is complex and shows multiple components. Clumpy structure suggests an irregular classification. It is however possible that this galaxy would be a nearly edge-on spiral galaxy, with a long tidal tail roughly parallel to the disk. If this is the case, the tidal tail is bluer than the disk. The central region of this spiral galaxy is dusty and some star-forming regions are detected along the arms and the long tidal tail.
- 03.0570
-
This is a compact galaxy with integrated color close to that of an Sbc galaxy. The light distribution is dominated by a bright and compact nuclear component.
- 03.0603
-
An extremely blue core dominates this galaxy and red diffuse emission extends about 10 kpc. The blue core is even bluer than an irregular galaxy. Broad Mg II 2799 line is detected with CFHT spectroscopy. This galaxy is classified as a compact galaxy. However, the faint surrounding region appears round. This object could be a galaxy with very faint face-on disk.
- 03.0615
-
This galaxy is compact and with round and smooth morphology. The global color is comparable to that of a spiral galaxy earlier than Sbc type. A star-forming region is visible in color map 5 kpc off from the nucleus.
- 03.0776
-
The morphology of this galaxy is elongated and compact. Distorted fuzzy emission is detected. Color map reveals a relatively red core surrounded by blue regions. The integrated color of this galaxy is close to that of a Sbc galaxy.
- 03.0916
-
This is a compact galaxy. The light distribution is too compact to obtain the structural parameters. Broad emission lines detected in CFHT spectroscopy suggests that this galaxy as a type I AGN.
- 03.0932
-
From WFPC2 I814 image, we can see that this is an extremely edge-on galaxy with a bulge in the center. However, the bulge is not detected in B450 band image.
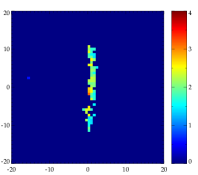
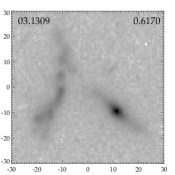
- 03.1309
-
This chain galaxy is a merging system. In this system, the edge-on disk galaxy has a dominant bulge with color close to that of an elliptical galaxy. Along the chain, star-formation regions are visible.
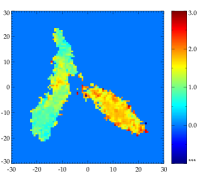
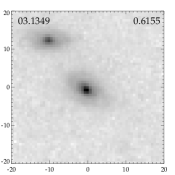
- 03.1349
-
Regular appearance and a dominant bulge suggest a Sab classification for this galaxy. The bulge is compact and relatively blue, comparable to the disk. Our spectroscopy confirms that the companion galaxy 20 kpc off is an interacting system. .
- 03.1522
-
This is an edge-on spiral galaxy. It is not detected in deep WFPC2 B450 band (6600s exposure time) implying a heavy extinction (dust screen). CFRS ground-based photometry reveals that this object is 0.3 mag redder than an elliptical galaxy at the same redshift.
- 03.1540
-
This is a compact galaxy. Luminous component is surrounded by fuzzy extended region (a disk?). The compact component looks like a giant bar. Color map reveals a distinct blue core surrounded by dusty regions. Off the blue core, a blue region appears at one end of the bar. The strong IR emission should relate to the central star-forming regions. While the starburst can be triggered due to the instability of a bar, it is also conceivable to ascribe the distinctive morphology to merger/interaction.
- 03.9003
-
The brightness distribution of this galaxy is quite complex and irregular. From color map, it can be seen that blue star-forming regions surround a red central region (a bulge?).
- 14.0302
-
This galaxy is a face-on spiral galaxy with clear arms and bulge/bar detected in WFPC2 image. In color map, star-forming regions are revealed surrounding the center and the arms.
- 14.0393
-
This is a face-on spiral galaxy with wide star formation spread over the arms. This galaxy is very extended and with a small bulge which is distinctive in color map with a color 1.5 mag redder than that of the star-forming regions on the arms.
- 14.0446
-
This galaxy is a nearly edge-on () pure disk galaxy. Color map confirms that no such color red central region similar to a bulge is detected. This disk galaxy is rather giant characterized by a disk scale length of 6.8 kpc in I814 band. The mean VI814 color is close to that of an Sbc galaxy at that redshift.
- 14.0547
-
Heavily distorted morphology showing two main components and tidal tail features suggests that this is a pair system undergoing a major merger episode. One component is elongated and blue, while the other is relatively red.
- 14.0600
-
This galaxy is a system with complex morphology and clumpy light distribution. The clumpy knots are bluer than an Sbc galaxy, and are associated with star formation. While it is classified as an irregular galaxy, this galaxy is probably undergoing a minor merger event.
- 14.0663
-
This galaxy shows a round appearance. The central region exhibits a peanut-like structure, which could be linked to a giant bar. The color distribution shows blue regions surrounding both ends of the “peanut”.
- 14.0711
-
The complex, clumpy structure seen in WFPC2 image suggests a classification of irregular galaxy. Dust regions and star-forming regions are revealed in color map.
- 14.0725
-
This galaxy has elongated morphology and shows a color gradient. Color map shows two conjunctive regions. A large region has a color close to that of an elliptical galaxy while a small region is as blue as an Sbc galaxy. It is not clear whether the elongated morphology is due to two merging galactic nuclei since no tidal tail features appear in the surrounded diffuse emission.
- 14.0814
-
This is a system with S-shape structure. This galaxy could be a barred spiral rather than a major merger because it shows no evidence for two components. While it is labeled as an irregular galaxy, it could be associated with the relics of merger/interaction.
- 14.0998
-
This system has a peculiar morphology, composed of two very close components surrounded by diffuse emission. Peculiar substructures like two tidal tails can still be seen. The minor component is bluer than the major one by about 1 magnitude. The color distribution of this galaxy is quite complex. Broad dusty regions and star-forming regions can be viewed in color map.
- 14.1042
-
Round, smooth and elongated morphology can be seen from WFPC2 image. This galaxy is as red as an elliptical galaxy. while its brightness distribution is more concentrated.
- 14.1129
-
This system consists of two comparable components separated by 12 kpc. Strikingly, a distinct tidal tail and a bridge connecting the two components suggest that this system is undergoing a major merger episode. The tidal tail is bluer than the two galactic nuclei.
- 14.1139
-
From WFPC2 image, a peculiar appearance showing the merging of two galaxies can be seen. The two galactic nuclei are as close as 3.5 kpc, surrounded by diffuse and extended emission. Substructures like tidal tails are visible in the surrounding regions. The major component has a blue core.
- 14.1157
-
This is a system composed of multiple components. Material streams connecting the components are detected. The brightest component is very red. This object is detected by PC chip in the GSS very deep field. The higher resolution color map reveals a ring structure associated with a point source in a very red region, suggesting a heavily obscured AGN inside it.
- 14.1190
-
The morphology of this galaxy is round and clumpy. Spiral arms are visible around the center with several bright blue knots on them. There is no dominant central components and this galaxy is classified as an Sd galaxy.
- 14.1305
-
This system is a merging system showing a dominant component and a conjoint one. Seen in the color map, the dominant component is even redder than an elliptical galaxy, suggesting that it is very dusty. Within 20 kpc, there are two other components with color comparable to that of an Sbc galaxy. It is unclear whether they belong to the same physical system.
- 14.1350
-
This galaxy is classified as an irregular galaxy due to a complex morphology and irregular light distribution. The bright components/knots are as blue as an Sbc galaxy and the central region is very red (dust?).
- 14.1415
-
Dominated by a major component, this galaxy is classified as a compact galaxy. The central dominant component is surrounded by diffuse emission. Four minor components reside in the surrounding emission, which suggests that this galaxy is possibly the relics of a merger event. The main component is dusty.

6 Discussion
6.1 Morphological properties
From Table 3, we can derive the global morphological properties for distant LIRGs. Of the 36 galaxies, 13 (36%) are classified as disk galaxies with ‘Hubble type’ from Sab to Sd. For these disk galaxies, their morphological classifications are secure (Q 2). An extremely red edge-on disk galaxy is 03.1522. This galaxy is so red that almost no light is detected in B450 band, which leads to few pixels available in its color map. We label this galaxy simply “Spiral” due to the large uncertainty in determining the bulge fraction. Of the 13 disk galaxies, 4 of them are very edge-on. Morphological classification exhibits that 25% (9 in 36) of the LIRGs are compact galaxies as they show concentrated light distribution (see the definition in Hammer et al. Hammer01 (2001)). Such a high fraction is strikingly similar to that derived from optical samples (Guzmn et al. Guzman (1997); Hammer et al. Hammer01 (2001)). Their two-dimensional structure fitting suffers from large uncertainties. Of the 36 galaxies, 8 (22%) are classified as irregular galaxies which show complex morphology and clumpy light distribution. In the 36 LIRGs, only 6 cases (17%) are major ongoing mergers showing multiple components and apparent tidal tails. Five (either compact or irregular) LIRGs are possibly linked to merging (labeled by M2) and one spiral LIRG is probably an interacting system (labeled I2). Signs of merging or relics of interactions (possibly) occur in 9 LIRGs (labeled R and R?). Accounting for them and for major mergers, the total fraction of merging/interacting systems is estimated to be 58% (21 in 36) of the LIRGs.
For galaxies at redshift 1, the cosmological dimming effect becomes significant and the morphological classifications might have some uncertainties since faint features are hardly detected at the detection limits of our WFPC2 imaging data. Some irregular galaxies could be indeed spiral galaxies. The objects classified as spiral galaxies and major mergers are free from those uncertainties because their main structure properties have already been recognized. Hence, in the present LIRG sample, the fraction for spiral galaxies is well estimated or slightly underestimated if there are spirals misclassified as irregular galaxies. HST I814 band imaging is available for all LIRGs. Thus the compactness of each galaxy can be well determined and the fraction of the compact galaxies is reliable (see e.g. Hammer et al. Hammer01 (2001)).
6.2 LIRGs: massive systems related to large disks?
K band luminosity is widely used to estimate the stellar mass. For our 36 sample LIRGs, K band luminosity is available for 24 of them. Following Hammer et al. (Hammer01 (2001)), we assume a unity mass-to-luminosity ratio in K band and estimate the stellar masses for the 24 LIRGs. The derived stellar masses range from 1.41010 to 2.91011 M⊙, compared to 1.81011 M⊙ of the Milk Way mass. Note that extinction and age of stellar population are not considered in estimating the stellar mass due to the numerous related uncertainties (e.g. those associated with the assumed stellar population mixing and the dust extinction modeling). We notice that the stellar masses we obtained are, systematically, from 50% to 100% of the values derived by Franceschini et al. (Franceschini03 (2003)), after a careful examination of galaxies with similar K band luminosities. Indeed, Franceschini et al. (Franceschini03 (2003)) have derived stellar masses using spectral synthesis modeling of the overall optical-IR continuum. Further discussion about uncertainties in the mass estimate can be found in Berta et al. (Berta (2004)). Adopting M(K) = 21.82 for H0 = 70 (Glazebrook et al. Glazebrook (1995)), LIRGs are systems ranging from 0.3 L∗ to 6.7 L∗ with median value 2.2 L∗. These LIRGs were undergoing violent star formation at rates of the order of 100 M⊙ yr-1. They may add a significant mass contribution during a short time. For a galaxy, the ratio of stellar mass to SFR is the time scale for the formation of the bulk of the stars. If star formation is sustained at the observed rate, LIRGs could duplicate themselves within 108 to 109 yr (Fig. 11).

A large fraction of LIRGs are classified as disk galaxies. In Table 3, the disk scale length Rd is also listed for the LIRGs classified as spiral galaxies. We can see that all the LIRG disks are large galaxies with Rd 2.9 kpc (corresponding to 4 kpc at H0 = 50) except for the object 14.1190, which is a face-on Sd galaxy from GSS fields. We suspect that its disk scale length has been severely underestimated due to the shallow detection (24.5 mag arcsec-2 in I814 band, compared to 25.5 mag arcsec-2 in other fields). We compare the LIRG disks with size-selected disk sample using the distribution of the disk central surface brightness. Lilly et al. (Lilly98 (1998), L98 hereafter) presented a detailed study of a large disk (Rd 4 kpc) sample, which is homogeneous and essentially complete. Similar to L98 (see their fig. 12), we plot the LIRG disks in the diagram of the central surface brightness versus the redshift. The observed I814 band central surface brightness of the disk components derived from the two-dimensional structure fit is used to obtain the rest frame BAB band central surface brightness. Cosmological dimming and K-correction are corrected following L98. We use the central surface brightness color VI814 (or BI814) to calculate the K-correction except for LIRG disks 03.0085, 03.0445, 03.0932, and 14.0393, whose integrated HST colors are adopted because the central surface brightness is either available only in one band or not fairly estimated in B450 band. The edge-on LIRG disk 03.1522 is not included because of the heavy extinction. A spectral energy distribution is chosen to match the observed color from theoretical ones at different ages for a solar abundance galaxy with e-folding time = 1 Gyr (see Hammer et al. Hammer01 (2001) for more details). As shown in Fig. 12, the central surface brightness of 8 LIRG disks is consistent with that of the large disk galaxies in L98 at similar redshift (LIRG disks 03.0085, 03.0445, 03.0932, 03.1522 and 14.0393 are absent because of no secure structural parameters available in one band). This confirms that LIRG disks belong to the large disk galaxy population.
We also investigated if the size-selected sample of distant disk galaxies includes LIRGs. In L98, 5, 14 and 5 objects are selected from the CFRS 0300+00 and 1415+52 fields in redshift bins 0.2 0.5, 0.5 0.75 and 0.75 1.0, respectively. After a cross-identification with ISOCAM observations, 6 of 19 disk galaxies in 0.5 1.0 are found luminous in the IR band with IR luminosities ranging from 1.6 to 12 L⊙ (to be the median value is 5.3 L⊙). No galaxy in the redshift bin 0.2 0.5 is identified as nearby IR luminous or starburst galaxies. Of the 6 IR luminous large disk galaxies, 5 are included in our HST sample, including 3 morphologically classified as spirals, one as bar-dominated compact galaxy (03.1540), although it shows evidence for an extended faint disk, and one as merger (14.1139). This indicates that in the large disk galaxy population at redshifts ranging from 0.5 to 1.0, about 30 12% are infrared luminous. This confirms that LIRG disks are large (massive?) disks.
LIRGs are systems with stellar content averaged to 1.4 M∗, and they are intimately linked to large disks from their morphologies, as well as the fact that size selected disks include a significant fraction of them. We believe that the star formation in large disks (derived from UV measurements) by L98 had been severely underestimated. Indeed from their IR luminosities, LIRG disks were forming stars at a high rate, ranging from 18 to 210 M⊙ yr-1 and averaged to 110 M⊙ yr-1. This is contradictory to the modest star formation rate of about 3 – 10 M⊙ yr-1 reported by L98. This indicates that UV and [OII] luminosities are poor tracers of the star formation rate.
The number density of LIRGs is much larger at 1 than the present day by a factor of more than 40 (Elbaz et al. Elbaz (2002)). From the above discussions, we believe that they significantly contribute to the large and massive disks population at z = 0.5 – 1. Our result is contradictory to that of Brinchmann & Ellis (BrinchmannEllis (2000)), which claimed that dwarf galaxies, rather than massive systems were responsible for the star formation activity since 1. As an example, we assume that the L98 SFR of 7 M⊙ yr-1 apply to the large disks which have not been detected by ISO (which is somewhat unrealistic since ISO detection limit at = 0.75 is 40 M⊙ yr-1). Assuming the SFR derived from IR luminosity for the ISO detected disks in L98, the averaged SFR at redshift 0.75 would be on average 40 M⊙ yr-1, or 6 times larger than the L98 average value. Further investigation will address the contribution of the massive galaxies to the CSFD (Hammer et al. Hammer04 (2004)).

6.3 Central color versus concentration index

We have noticed that for most compact LIRGs (e.g. 03.0523, 03.0603, 03.0615 and 03.1540), the color map have revealed a central region strikingly bluer than the outer regions. These blue central regions have a size similar to that of bulges and a color comparable to that of star-forming regions. Since the bulge/central region in local spirals is relatively red, such blue-core structure could imply that the galaxy was (partially) forming the bulge. This is consistent with the scenario proposed by Hammer et al. (Hammer01 (2001)) that luminous compact galaxies are counterparts of the bulges in local spiral galaxies at intermediate redshifts. From color maps, the central regions (bulges?) in formation are revealed directly.
Let us assume that luminous compact galaxies are progenitors of the spiral cores/bulges and that disk components are formed later. Then a correlation is anticipated among star forming systems (LIRGs: galaxies forming disk and/or bulge) between the color of their central region and the galaxy compactness. Star formation would first occur in the center (bulge) and hence would gradually migrate to the outskirts (disk), leading to redder colors of the central regions as the disk stars were forming. We have investigated the relation between the central color and the compactness for the LIRGs excluding the six major ongoing mergers, for which no central color is available due to their two separated components, and two objects whose structural parameters are not available. To reduce the contamination from the surrounding disk, a circle aperture with radius 1 kpc centered at I814 band brightness peak is adopted to determine the central color. PHOT in IRAF111IRAF is distributed by the National Optical Astronomy Observatories, which are operated by the Association of Universities for Research in Astronomy, Inc. under cooperative agreement with the National Science Foundation. is used to do aperture photometry. This aperture includes 5 pixels for objects at redshift 1 and the random fluctuation is marginal due to the high S/N in the central regions. We convert the observed central color VI814 or BI814 to the observed color VI814 at median redshift 0.7434 (see Hammer et al. Hammer01 (2001)). At this reference redshift, The centroid wavelengths of the HST filters I814 and V606 correspond roughly to B band (4596 Å) and U band (3440 Å). The same method described in the previous subsection is used to estimate the K-correction. We use the concentration index ( = 0.1) defined in Abraham et al. (Abraham94 (1994)) to measure the compactness. It is provided as an output of GIM2D in the two-dimensional structure fitting. We also compute the same parameters for a population of local galaxies from Frei et al. (Frei (1996)). The central color of the local galaxies have been assumed to be that of local ellipticals (for E and S0) or local bulge (for Sab to Sbc), and have been transformed to B (4596 Å) U (3440 Å) color system using GISSEL98 model with = 1 Gyr. Fig. 13 shows the investigation of the concentration index from I814 band as a function of the central color. In this diagram, the LIRGs are distributed along a sequence from galaxies with blue central color and compact morphology to galaxies with relatively red color and extended light distribution. Almost all distant LIRGs are discrepant from the sequence delineated by local spirals and ellipticals. There are two extreme cases 03.0603 and 03.1522. The object 03.0603 could be contaminated by AGN because of the very blue point-like core. As mentioned in Sect. 6.1, the object 03.1522 is a very dusty edge-on spiral galaxy. Its very red central color is related to a (dust-screen) extinction. It is worth noting that the sequence still exist when we replace the central color with the color contrast, which is defined as the difference between the central color and the integrated color (3 aperture).
The compact galaxies with blue central color are suggested to be the galaxies forming their cores (bulges). Fig. 13 clearly shows that these compact galaxies are located at one end of the sequence. The other end is occupied by extended galaxies with the concentration index and central color closer to those of local galaxies. It appears that such a sequence linking compact LIRGs to extended ones hints at a formation/assembly scenario for at least part of the present day spiral galaxies: the bulge formed first and dominated a galaxy with a compact morphology and a relatively blue central color, and later the disk was assembled around the bulge, resulting to an extended light distribution which ultimately resembles those of local galaxies.
In trying to make sense of the sequence, we point out that intense star formation could happen in processes of both bulge and disk formation. In our color maps we see evidence that for LIRG spirals, star formation spreads over all their disks. In fact, a star formation history with several episodes of massive starbursts are suggested for LIRGs according to their composite stellar populations (Franceschini et al. Franceschini03 (2003)). The star formation history with multiple starburst episodes is also implied by the morphological classification of LIRGs that massive starburst (luminous infrared phase) can happen in spirals/irregular phase, major merger phase or compact phase. The major mergers in LIRGs would most likely result in spheroidal systems with violent starbursts, and become similar to the compact LIRGs with blue central colors as those described in this paper. The spiral LIRGs could have undergone a compact stage before the observed epoch.
However, a simple evolutionary sequence might not account for all LIRGs. For example, among 12 LIRG disks with known bulge fraction, 3 are classified as Sd, i.e. with a very small bulge, and 8 LIRGs are classified as irregulars. Examination of these 11 Sd and Irr, generally reveals the presence of a well defined central component in most of them (03.0085, 03.0533, 03.9003, 14.0711, 14.0725, 14.0914, 14.0998 and 14.1190). On the other hand, such component might not be a bulge (or a forming bulge), because they can be elongated or with peculiar shapes (14.0814 has an S-shape and it could be a giant bar). It is beyond the scope of this paper to evaluate the relative importance of each physical processes (major and minor merging, bars, disk formation) which are driving the galaxy formation.
The scenario suggested by the sequence in Fig. 13 for disk galaxy formation is also supported by metallicity investigation of LIRGs by Liang et al. (Liang (2003)). They found that, on average, the metal abundance of LIRGs is less than half that of the local disks with comparable brightness. They suggested that LIRGs would form nearly half of their metals and stars since , assuming that they eventually evolve into the local massive disk galaxies.
It should be borne in mind that contribution from active galactic nuclei (AGNs) might strengthen this sequence since AGNs usually appear in blue color with respect to stellar populations (the situation could be opposite if the AGNs are obscured severely by dust) and the existence of bright AGNs will bias the galaxies to the compact ones. However this concerns only a small fraction of our compact LIRGS (2 among 9). On the other hand, dust extinction will redden the color and smear the sequence.
7 Conclusions
Specific efforts were made to obtain the color maps for galaxies with complex morphology, including the accurate alignment of the blue and red band images and a new method to quantitatively determine the reliability of each pixel in the color map. These efforts allow us to access the spatially resolved color distribution of the distant LIRGs, which often have complex morphologies, relating to interactions/mergers. In two 1010 CFRS fields 0300+00 and 1415+52, HST WFPC2 imaging in F606W (or F450W) and F814W filters is available for 87 square arcminute area. From these fields , we select a representative sample of 36 distant () LIRGs detected in deep ISOCAM observations. Two-dimensional structure analysis is carried out using GIM2D software. With structure parameters and color distribution, a careful morphological classification was performed for the distant LIRGs. We find that about 36% LIRGs are spiral galaxies and about 25% LIRGs show compact morphology. About 22% LIRGs are classified as irregular galaxies, showing complex and clumpy structures. Among 36 LIRGs, only 6 (17%) of them were undergoing a major merger episode, revealed by distinctive close galaxy pair with distorted morphology and apparent tidal tails. The fraction of mergers could reach 58% if all of the possible post-mergers/pre-mergers are included.
Inspection of their stellar masses derived from K band absolute magnitude evidences that LIRGs are massive systems. The LIRGs classified as disk galaxies indeed belong to the large disk galaxy population, and become a significant fraction of large distant disks selected by their sizes.
We find that LIRGs are distributed along a sequence in the central color versus compactness diagram. The sequence links the compact LIRGs with relatively blue central color to that of extended LIRGs with central color and compactness close to those of the local normal galaxies. The compact LIRGs showing blue central color are suggested to be the systems forming their bulges, in agreement with the suggestion of Hammer et al. (Hammer01 (2001)). We argue that the sequence suggests that distant compact LIRGs would eventually evolve into the spiral galaxies in the local universe.
Acknowledgements.
We are grateful to Francoise Combes for helpful discussions and help in our morphological classification. We thank Jun Cui for his help on improving this manuscript. We thank the referee Dr. B. Mobasher for his helpful comments. This work is based on observations made with the NASA/ESA Hubble Space Telescope, obtained from the data archive at the Space Telescope Institute. STScI is operated by the association of Universities for Research in Astronomy, Inc. under the NASA contract NAS 5-26555.References
- (1) Abraham, R. G., Ellis, R. S., Fabian, A. C., Tanvir, N. R., & Glazebrook, K. 1999, MNRAS, 303, 641
- (2) Abraham, R. G., Valdes, F., Yee, H. K. C., & van den Bergh, S. 1994, ApJ, 432, 75
- (3) Berta, S., Fritz, J., Franceschini, A., Bressan, A., & Lonsdale, C. astro-ph/0402211
- (4) Bertin, E., & Arnouts, S. 1996, A&AS, 117, 393
- (5) Brinchmann, J., Abraham, R., Schade, D., et al. 1998, ApJ, 499, 112
- (6) Brinchmann, J., & Ellis, R. S. 2000, ApJ, 536, L77
- (7) Bruzual, A.G., & Charlot, S. 1993, ApJ, 405, 538
- (8) Conselice, C. J., Bershady, M. A., Dickinson, M., & Papovich. C. 2003, AJ, 126, 1183
- (9) Crampton, D., Le Fvre, O., Lilly, S. J., & Hammer, F. 1995, ApJ, 455, 96
- (10) de Jong, R. S. 1996, A&A, 313, 377
- (11) Dickinson, M., Papovich, C., Ferguson, H. C., & Budavri, T. 2003, ApJ, 587, 25
- (12) Dolphin, A. E. 2000, PASP, 112, 1397
- (13) Dolphin, A. E. 2002, in 2002 HST Calibration Workshop: WFPC2 CTE Characterization, ed. S. Arribas, A. Koekemoer, B. Whitmore (Baltimore: STScI) 303
- (14) Elbaz, D, Cesarsky, C. J., Chanial, P., et al. 2002, A&A, 384, 848
- (15) Ellis, R. S., Abraham, R. G., & Dickinson, M. 2001, ApJ, 551, 111
- (16) Flores, H., Hammer, F., Thuan, T. X., et al. 1999, ApJ, 517, 148
- (17) Flores, H., et al. 2004, in preparation
- (18) Franceschini, A., Berta, S., Rigopoulou, D., et al. 2003, A&A, 403, 501
- (19) Frei, Z., Guhathakurta, P., Gunn, J. E., & Tyson, J. A. 1996, AJ, 111, 174
- (20) Genzel, R., Cesarsky, C. J. 2000, ARA&A, 38, 761
- (21) Genzel, R., Tacconi, L. J., Rigopoulou, D., Lutz, D., & Tecza, M. 2001, ApJ, 563, 527
- (22) Glazebrook, K., Peacock, J., Miller, L., & Collins, C. 1995, MNRAS, 275, 169
- (23) Hammer, F., Flores, H., Lilly, S. J., et al. 1997, ApJ, 481, 49
- (24) Hammer, F., Gruel, N., Thuan, T. X, Flores, H., & Infante, L. 2001, ApJ, 550, 570
- (25) Hammer, F., Flores, H., Liang, Y. C., Zheng, X. Z., Elbaz, D., & Cesarsky, C. J. 2004, in preparation
- (26) Groth, E. J., Kristian, J. A., Lynds, R., O’Neil, E. J., Jr., Balsano, R., & Rhodes, J. 1994, AAS, 185, 5309
- (27) Koekemoer, A. M., Gonzaga, S., Fruchter, A., et al. 2002, ”HST Dither Handbook”, Version 2.0 (Baltimore: STScI)
- (28) Le Fvre, O., Abraham, R., Lilly, S. J., et al. 2000, MNRAS, 311, 565
- (29) Guzmn, R., Gallego, J., Koo, D. C., et al. 1997, ApJ, 489, 559
- (30) Lilly, S., Schade, D, Ellis, R., et al. 1998, ApJ, 500, 75
- (31) Lilly, S., Le Fvre, O., Crampton, D., Hammer, F., & Tresse, L. 1995, ApJ, 455, 50
- (32) Liang, Y. C., Hammer, F., Flores, H., Elbaz, D., & Cesarsky, C. J. 2003, A&A, submitted
- (33) Madau, P., Ferguson, H. C., Dickinson, M. E., et al. 1996, MNRAS, 283, 1388
- (34) Menanteau, F., Abraham, R. G., & Ellis, R. S. 2001, MNRAS, 322, 1
- (35) Rola, C., Pelat, D. 1994, A&A, 287, 676
- (36) Schade, D., Lilly, S. J., Crampton, et al. 1999, ApJ, 525, 31
- (37) Simard, L., Willmer, C. N. A., Vogt, N. P., et al. 2002, ApJS, 142, 1
- (38) Trauger, J. T., Vaughan, A. H., Evans, R. W., & Moody, D. C. 1995, in Calibrating Hubble Space Telescope: Post Servicing Mission, ed. A. Koratkar and C. Leitherer (Baltimore: STScI) 379
- (39) Williams, R. E., Blacker, B., Dickinson, M., et al. 1996, AJ, 112, 1335
Appendix: Signal-to-noise ratio for color map
Color image is a difference of two images in a logarithm function (here we ignore the scaling constant which will not affect the final results). Given one HST image in blue band with flux and another one in red band with flux, the color image is defined as
| (2) |
Here, the flux is a function of the position in an image, including signals of background and object. The HST images have Poisson noise. We know the signals , and the noises , in the two images, respectively. We intend to derive signal and noise of the color image and then obtain its S/N ratio. The issue with color representation of an image is to avoid the divergence at zero value implied by the logarithm function. A way to do this is to replace the Poisson noise by a random variable possessing zero probability at zero value. This approximation must be valid at low S/N ratio, say S/N 2. It is clear that such an approximation must break down at very low S/N, say S/N 1 where a Poisson random variable is zero most of the time. Here we adopt an approximation that the Poisson noise distribution function in the HST image is close to a Log-normal law. A similar approach was tested in a spectroscopic context by Rola & Pelat (Rola (1994)). It is shown in Fig. 14 that even at S/N = 2 a Log-normal variable is an acceptable approximation of a Poisson one.

In logarithm, the blue image = and the red image = satisfy a Normal law. A difference between two Normal law images is also a Normal law image. This property is the main advantage of using the Log-normal law to approximate the Poisson noise. The signal and noise of the color image are given by
| (3) |
and
| (4) |
where and , and are the signal and the noise of the Normal law images B and R respectively. For Log-normal function , its signal and noise can be written as
| (5) |
and
| (6) |
Expressing and in and , we obtain
| (7) |
and
| (8) |
With = , we obtain the signal and noise for the color image as
| (9) |
and
| (10) |
respectively.
| B450 | V606 | I814 | ||||||||||||||
| CFRS ID | m450 | m606 | m814 | MAB(B) | MAB(K) | LL⊙) | B/T | B/T | B/T | Typea | Qb | Int/Mc | ||||
| (1) | (2) | (3) | (4) | (5) | (6) | (7) | (8) | (9) | (10) | (11) | (12) | (13) | (14) | (15) | (16) | (17) |
| No redshift identification | ||||||||||||||||
| 03.0028 | – | – | 21.16 | 19.30 | – | – | – | – | – | 1.078 | 1.047 | |||||
| 03.0115 | – | – | 21.15 | 19.53 | – | – | – | – | – | 1.588 | 1.474 | |||||
| 03.0121 | – | – | 21.40 | 19.76 | – | – | – | – | – | 1.947 | 1.413 | |||||
| 03.0346 | – | 23.77 | – | 21.52 | – | – | – | 1.089 | – | – | 2.375 | |||||
| 14.0324 | – | – | 22.85 | 21.47 | – | – | – | – | 1.0156 | 1.0075 | ||||||
| 14.0405 | – | – | 22.26 | 20.38 | – | – | – | – | 1.0004 | 1.0183 | ||||||
| 03.0355 | 0.0870 | 19.06 | – | 16.91 | 19.31 | – | 1.520.32 | 1.183 | – | – | 1.383 | |||||
| 03.0364 | 0.2513 | 20.97 | – | 18.95 | 20.30 | 22.14 | 4.560.81 | 1.520 | – | – | 1.787 | |||||
| 03.0365 | 0.2187 | 21.10 | – | 18.89 | 19.57 | 21.68 | 4.260.87 | 1.374 | – | – | 1.420 | |||||
| 03.0443 | 0.1178 | 20.37 | – | 19.12 | 19.15 | – | 0.780.16 | 0.952 | – | – | 1.093 | |||||
| 03.0495 | 0.2614 | – | 20.38 | 19.25 | 19.82 | – | 5.381.22 | – | – | 2.174 | 1.906 | |||||
| 03.0569 | 0.1810 | – | 22.41 | 21.27 | 16.73 | 20.01 | 1.670.37 | – | – | – | – | – | – | |||
| 03.0578 | 0.2200 | – | 21.59 | 20.93 | 18.64 | 19.52 | 1.580.36 | – | – | 1.084 | 0.989 | |||||
| 03.0711 | 0.2620 | – | 21.34 | 20.51 | 18.55 | 20.44 | 2.510.58 | – | – | 1.298 | 1.136 | |||||
| 03.0949 | 0.0330 | 19.40 | – | 17.56 | 16.86 | – | 0.180.02 | 0.897 | – | – | 1.225 | |||||
| 03.1299 | 0.1760 | – | 19.66 | 18.76 | 19.94 | – | 5.021.23 | – | – | 3.688 | 1.005 | |||||
| 03.1311 | 0.1760 | – | 20.30 | 19.36 | 18.86 | 21.69 | 2.090.49 | – | – | 1.562 | 1.327 | |||||
| 14.0435 | 0.0684 | – | 18.71 | 17.91 | 18.30 | – | 0.140.02 | – | – | 1.481 | 1.395 | |||||
| 14.1257 | 0.2927 | – | 21.24 | 20.16 | 19.44 | 22.45 | 15.972.15 | – | – | 1.859 | 1.490 | |||||
| 14.1329 | 0.3750 | – | 20.21 | 19.19 | 21.00 | – | 13.032.47 | – | – | 1.976 | 1.816 | |||||
| 14.9025 | 0.1550 | – | 19.57 | 18.69 | 19.77 | – | 1.690.39 | – | – | 3.280 | 2.186 | |||||
| 03.0035 | 0.8804 | 24.06 | 22.69 | 21.12 | 21.87 | 23.70 | 171.4723.41 | – | – | 1.349 | 0.993 | Sab (3.6) | 2 | R? | ||
| 03.0062 | 0.8252 | – | 22.26 | 20.90 | 21.84 | 23.00 | 111.7313.74 | – | – | 1.545 | 1.439 | Sbc (3.0) | 1 | |||
| 03.0085 | 0.6100 | – | 22.58 | 21.51 | 19.98 | 21.09 | 29.552.67 | – | – | 1.274 | – | – | Sd (5.1) | 2 | ||
| 03.0445 | 0.5300 | 22.84 | – | 20.40 | 21.25 | – | 21.284.27 | 0.992 | – | – | 1.038 | Sbc (3.9) | 2 | R? | ||
| 03.0507 | 0.4660 | – | 21.33 | 20.48 | 20.47 | 21.23 | 11.572.71 | – | – | 1.325 | 1.227 | Sab (3.2) | 2 | |||
| 03.0523 | 0.6508 | 23.03 | 22.00 | 20.99 | 20.93 | 21.73 | 68.654.36 | 0.931 | 1.789 | 1.292 | C/T | 1 | M2 | |||
| 03.0533 | 0.8290 | – | 22.30 | 21.02 | 21.38 | 22.28 | 170.0423.67 | – | – | 1.096 | 1.170 | Irr | 1 | R | ||
| 03.0570 | 0.6480 | – | 22.67 | 21.69 | 20.12 | 20.58 | 29.972.75 | – | – | 1.242 | 1.111 | C | 1 | |||
| 03.0603 | 1.0480 | – | 21.26 | 20.37 | 23.01 | 23.71 | 435.5883.86 | – | – | 1.464 | 1.290 | C | 1 | R | ||
| 03.0615 | 1.0480 | – | 22.52 | 21.51 | 21.66 | 22.77 | 344.6962.39 | – | – | 1.390 | 1.306 | C | 3 | |||
| 03.0776 | 0.8830 | – | 23.28 | 22.05 | 20.69 | 20.98 | 107.8414.25 | – | – | 0.992 | 1.061 | C | 1 | |||
| 03.0916d | 1.0300 | 22.64 | – | 21.17 | 22.23 | – | 503.2668.64 | – | – | – | – | – | – | C | 1 | |
| 03.0932 | 0.6478 | 23.54 | – | 21.18 | 20.73 | 22.85 | 97.186.95 | – | – | – | – | 1.046 | Sbc (7.0) | 1 | ||
| 03.1309 | 0.6170 | – | 21.65 | 20.77 | 21.49 | 23.00 | 89.286.32 | – | – | – | – | – | – | 4 | M1 | |
| B450 | V606 | I814 | ||||||||||||||
|---|---|---|---|---|---|---|---|---|---|---|---|---|---|---|---|---|
| CFRS ID | m450 | m606 | m814 | MAB(B) | MAB(K) | LL⊙) | B/T | B/T | B/T | Typea | Qb | Int/Mc | ||||
| (1) | (2) | (3) | (4) | (5) | (6) | (7) | (8) | (9) | (10) | (11) | (12) | (13) | (14) | (15) | (16) | (17) |
| 03.1349 | 0.6155 | – | 21.67 | 20.38 | 21.15 | 22.63 | 56.773.38 | – | – | 1.179 | 0.873 | Sab (4.5) | 1 | I2 | ||
| 03.1522 | 0.5870 | 25.73 | – | 21.74 | 19.59 | 21.96 | 46.133.02 | – | – | – | – | 0.994 | S (9.0) | 1 | ||
| 03.1540 | 0.6898 | 22.95 | – | 20.61 | 21.27 | – | 90.239.19 | 0.932 | – | – | 1.223 | C | 1 | R? | ||
| 03.9003 | 0.6189 | 22.58 | – | 20.47 | 21.24 | – | 54.743.73 | 1.863 | – | – | 2.017 | Irr | 1 | M2 | ||
| 14.0302 | 0.5830 | 22.78 | – | 20.44 | 20.98 | 22.70 | 56.943.17 | 1.005 | – | – | 1.069 | Sab (3.0) | 2 | R? | ||
| 14.0393 | 0.6016 | 23.07 | – | 20.94 | 21.64 | 22.30 | 55.153.57 | – | – | – | – | 1.157 | Sbc (7.8) | 1 | ||
| 14.0446 | 0.6030 | – | 21.15 | 19.88 | 21.95 | – | 56.873.29 | – | – | 1.243 | 1.363 | Sd (6.8) | 1 | |||
| 14.0547 | 1.1963 | – | 22.02 | 21.17 | 23.12 | 23.88 | 186.0343.71 | – | – | – | – | – | – | 4 | M1 | |
| 14.0600e | 1.0385 | – | 22.03 | 21.13 | 22.04 | – | 369.4961.12 | – | – | – | – | – | – | Irr | 1 | |
| 14.0663 | 0.7434 | – | 21.98 | 20.51 | 21.65 | – | 148.4318.98 | – | – | 1.241 | 1.155 | Sbc (3.1) | 2 | |||
| 14.0711 | 1.1180 | – | 22.30 | 21.24 | 22.50 | 23.18 | 463.4296.59 | – | – | 1.166 | 1.228 | Irr | 1 | M2 | ||
| 14.0725 | 0.5820 | – | 22.86 | 21.66 | 19.47 | 21.26 | 24.123.27 | – | – | 1.027 | 1.091 | Irr | 3 | |||
| 14.0814 | 0.9995 | – | 23.56 | 22.04 | 20.73 | 22.02 | 163.0284.25 | – | – | 1.076 | 1.159 | Irr | 3 | R? | ||
| 14.0998 | 0.4300 | 23.02 | 21.27 | 20.09 | 20.32 | 22.17 | 26.084.24 | 0.867 | 1.891 | 1.582 | Irr | 3 | M2 | |||
| 14.1042 | 0.8916 | – | 22.75 | 20.98 | 21.60 | 23.07 | 99.3710.51 | 1.008 | 1.189 | 1.352 | C | 1 | M2 | |||
| 14.1129 | 0.8443 | – | 22.59 | 21.36 | 21.86 | 22.81 | 123.6815.89 | – | – | – | – | – | – | 4 | M1 | |
| 14.1139 | 0.6600 | 22.40 | 21.20 | 20.24 | 22.02 | 23.47 | 118.0011.36 | – | – | – | – | – | – | 4 | M1 | |
| 14.1157 | 1.0106 | – | 22.44 | 19.95 | 23.11 | – | 1786f | – | – | – | – | – | – | 4 | M1 | |
| 14.1190 | 0.7544 | – | 21.97 | 20.57 | 21.58 | – | 92.439.42 | – | – | 1.309 | 1.373 | Sd (2.6) | 2 | R? | ||
| 14.1305 | 0.8069 | – | 23.29 | 21.59 | 20.73 | – | 67.307.23 | – | – | – | – | – | – | 4 | M1 | |
| 14.1350 | 1.0054 | – | 22.70 | 21.43 | 21.44 | – | 297.35139.92 | – | – | 1.085 | 1.171 | Irr | 2 | |||
| 14.1415 | 0.7486 | – | 22.47 | 20.67 | 21.48 | – | 87.449.98 | – | – | 1.076 | 1.142 | C | 2 | R | ||
-
a
Galaxy type — E/S0: 0.8 B/T 1, S0: 0.5 B/T 0.8, Sab: 0.15 B/T 0.5, Sbc: 0 B/T 0.15, Sd: B/T = 0, C: compact, T: tadpole, Irr: irregular. Note that disk scale length Rd is given in parentheses in unit of kiloparsec for spiral type galaxies.
-
b
Q quality factor — 1: secure, 2: merely secure, 3: insecure, 4: undetermined.
-
c
Interaction/Merging — M1: obvious merging, M2: possible merging, I1: obvious interaction, I2: possible interaction, R: relics of merger/interaction.
-
d
This object is too compact to obtain structural parameters.
-
e
Structural parameters are not successfully derived for this object from the two-dimensional structure fitting because of its clumpy light distribution and imagery close to the CCD chip border.
-
f
Infrared luminosity is estimated according to an obscured AGN model.
- Notes: Structural parameters are not provided for the merging systems with multiple distinctly separated components.