High speed photometry of faint Cataclysmic Variables: IV. V356 Aql, Aqr1, FIRST J1023+0038, H 0242–2802, GI Mon, AO Oct, V972 Oph, SDSS 0155+00, SDSS 0233+00, SDSS 1240-01, SDSS 1556-00, SDSS 2050-05, FH Ser
Abstract
We present results from high speed photometry of a further thirteen faint cataclysmic variables. V356 Aql (Nova Aql 1936) shows flare-like outbursts with recurrence time scales 3000 s, but no coherent periodicities. Aqr1 is an intermediate polar with a spin period of 6.7284 min and a probable orbital period = 3.226 h derived from orbital sidebands. Its orbital sideband frequencies show very variable amplitudes. The published spectroscopic period of 2.0 h suggests that Aqr1 is similar to GW Lib and FS Aur in having an additional periodicity of unknown origin. FIRST J1023+0038 has = 4.7548 h with an orbital modulation of range 0.45 mag, probably caused by reflection effect from a hot white dwarf primary; as such it may have been a nova sometime in the past few decades. H 0242 is a deeply eclipsing very low mass-transfer rate system, probably a dwarf nova of very long outburst interval, with = 1.792 h. GI Mon, an old nova, has optical modulations at 4.325 h and possibly also at 48.6 min and is thus a candidate intermediate polar. AO Oct, an SU UMa type dwarf nova, shows orbital modulation at quiescence with = 94.097 min. V972 Oph (Nova Ophiuchi 1957) showed no flickering activity during one set of observations, but did so at a later time, confirming the correctness of the identification of this object, but it shows no orbital modulation. SDSS 0155 is a deeply eclipsing polar with an orbital period of 87.13 min. SDSS 0233 shows flaring activity but no discernible periodicity. No periodicity was found in the new AM CVn candidate SDSS 1240. SDSS 1556 shows a periodic modulation at 1.778 h which is possibly due to orbital motion. SDSS 2050 is an eclipsing polar with = 1.5702 h. FH Ser (Nova Serpentis 1970) has strong flickering activity but no detectable orbital modulation.
keywords:
techniques: photometric – binaries: eclipsing – close – novae, cataclysmic variables1 Introduction
Continuing the University of Cape Town survey of faint cataclysmic variable stars (CVs) that have not previously been studied with high time resolution photometry, we present results for a further 13 stars. The observational technique is the same as that employed previously: the UCT CCD photometer (O’Donoghue 1995) used in frame transfer mode and white light, attached to the 1.9-m (74-in) or 1.0-m (40-in) reflectors at the Sutherland site of the South African Astronomical Observatory. In addition a few of our runs were made with the SAAO CCD photometer on the 1.0-m reflector. With white light, and with the very non-standard flux distributions of CVs, no transformations onto recognised photometric systems are possible – but in any case we are largely interested in the brightness variations that occur on short time scales, and which are measured differentially with respect to the mean brightness of each variable star. Nevertheless, by observing hot white dwarf standards we are able to provide magnitudes that are roughly on the V scale, and are good to 0.1 mag.
In the previous papers (Woudt & Warner 2001, 2002a, 2003a) we have concentrated on faint nova remnants. Here we also give results for some old novae, but we have extended our coverage to include a number of faint CVs that have been found in recent large-scale surveys.
In Section 2 we give the detailed results of our observations. Table 1 contains the observing log for all of the runs on the various observed stars. Section 3 summarises the results.
2 Observations
| Object | Type | Run No. | Date of obs. | HJD of first obs. | Length | Tel. | V | |
| (start of night) | (+2452000.0) | (h) | (s) | (mag) | ||||
| V356 Aql | NR | S6251 | 2001 Sep 24 | 2177.23744 | 2.43 | 20, 40 | 40-in | 17.7 |
| S6254 | 2001 Oct 09 | 2192.23163 | 3.56 | 20 | 40-in | 17.8 | ||
| S6258 | 2001 Oct 10 | 2193.22754 | 2.80 | 20, 40 | 40-in | 17.8 | ||
| S6262 | 2001 Oct 11 | 2194.22808 | 3.34 | 30, 40 | 40-in | 17.9 | ||
| S6266 | 2001 Oct 12 | 2195.22790 | 2.32 | 20, 40 | 40-in | 17.8 | ||
| S6279 | 2001 Oct 19 | 2202.23856 | 2.20 | 8 | 74-in | 17.8 | ||
| S7061 | 2003 Aug 28 | 2880.21490 | 2.40 | 45 | 40-in | 17.8b | ||
| Aqr1 | IP | S6600 | 2002 Oct 31 | 2579.32931 | 2.30 | 20 | 74-in | 18.4 |
| S6602 | 2002 Nov 01 | 2580.25848 | 4.98 | 20 | 74-in | 18.3 | ||
| S6604 | 2002 Nov 02 | 2581.25284 | 4.98 | 20 | 74-in | 18.3 | ||
| S6608 | 2002 Nov 04 | 2583.25411 | 4.76 | 20 | 74-in | 18.2 | ||
| First | P? | S6708 | 2002 Dec 30 | 2639.47195 | 3.30 | 10, 15 | 74-in | 17.6 |
| S6711 | 2003 Jan 28 | 2668.39976 | 5.01 | 20 | 40-in | 17.5 | ||
| S6714 | 2003 Jan 29 | 2669.45782 | 3.90 | 20 | 40-in | 17.5 | ||
| S6716 | 2003 Jan 30 | 2670.40913 | 4.91 | 20 | 40-in | 17.5 | ||
| S6719 | 2003 Jan 31 | 2671.38651 | 4.70 | 20 | 40-in | 17.5 | ||
| S6736 | 2003 Feb 03 | 2674.56766 | 1.26 | 20 | 40-in | 17.6 | ||
| S6744 | 2003 Feb 05 | 2676.52060 | 2.76 | 25 | 40-in | 17.6 | ||
| S6785 | 2003 Feb 21 | 2692.30455 | 4.08 | 25 | 40-in | 17.5 | ||
| S6803 | 2003 Feb 24 | 2695.45347 | 3.23 | 25 | 40-in | 17.6 | ||
| H 0242–2802 | DN | S6591 | 2002 Oct 29 | 2577.37719 | 3.69 | 45, 90 | 74-in | 18.7:∗ |
| S6595 | 2002 Oct 30 | 2578.46831 | 0.56 | 25 | 74-in | 18.7:∗ | ||
| S6597 | 2002 Oct 30 | 2578.53360 | 0.95 | 45 | 74-in | 18.7:∗ | ||
| GI Mon | NR | S6142 | 2000 Dec 21 | 1900.45337 | 1.21 | 5 | 40-in | 16.3 |
| S6155 | 2000 Dec 25 | 1904.36811 | 5.43 | 10 | 40-in | 16.4 | ||
| S7227 | 2003 Dec 30 | 3004.40587 | 4.60 | 30 | 40-in | 16.5a | ||
| S7228 | 2003 Dec 31 | 3005.35415 | 4.91 | 30 | 40-in | 16.5a | ||
| S7230 | 2004 Jan 01 | 3006.35296 | 5.98 | 30 | 40-in | 16.4a | ||
| AO Oct | DN | S6102 | 2000 Jun 05 | 1701.51362 | 4.02 | 60, 120 | 74-in | 20.5 |
| S6121 | 2000 Aug 22 | 1779.39636 | 6.62 | 45, 60, 120 | 74-in | 20.1 | ||
| S6125 | 2000 Aug 24 | 1781.50967 | 3.90 | 45, 60 | 74-in | 20.2 | ||
| S6131 | 2000 Aug 27 | 1784.47835 | 3.85 | 60 | 74-in | 20.0 | ||
| V972 Oph | NR | S6342 | 2002 Apr 02 | 2367.45468 | 1.29 | 6, 15 | 74-in | 15.9 |
| S7064 | 2003 Aug 29 | 2881.21042 | 4.66 | 30 | 40-in | 16.1a | ||
| S7071 | 2003 Aug 30 | 2882.21084 | 2.56 | 30 | 40-in | 16.2a | ||
| SDSS 0155+00 | P | S7141 | 2003 Oct 04 | 2917.39123 | 0.85 | 45 | 74-in | 18.0∗ |
| S7143 | 2003 Oct 05 | 2918.36033 | 1.76 | 10, 45 | 74-in | 18.0∗ | ||
| SDSS 0233+00 | DN? | S6519 | 2002 Aug 31 | 2518.52361 | 1.65 | 90 | 74-in | 19.9 |
| S6525 | 2002 Sep 01 | 2519.48797 | 1.65 | 90 | 74-in | 19.9 | ||
| S6527 | 2002 Sep 01 | 2519.64325 | 0.60 | 120 | 74-in | 19.8 | ||
| S6594 | 2002 Oct 30 | 2578.30153 | 3.83 | 100 | 74-in | 19.8 | ||
| S7116 | 2003 Sep 23 | 2906.54136 | 2.10 | 60 | 74-in | 19.9 | ||
| S7119 | 2003 Sep 24 | 2907.50635 | 2.03 | 100 | 74-in | 19.9 | ||
| SDSS 1240-01 | AM CVn | S7240 | 2004 Feb 14 | 3050.50814 | 1.60 | 90 | 40-in | 19.6 |
| S7246 | 2004 Feb 16 | 3052.45836 | 0.83 | 120 | 40-in | 19.6 | ||
| S7254 | 2004 Feb 19 | 3055.50047 | 2.13 | 90 | 74-in | 19.6 | ||
| S7257 | 2004 Feb 20 | 3056.50522 | 1.22 | 90 | 74-in | 19.6 | ||
| S7260 | 2004 Feb 21 | 3057.55213 | 2.20 | 100 | 74-in | 19.7 | ||
| SDSS 1556-00 | DN | S6812 | 2003 Feb 26 | 2697.51362 | 0.70 | 60 | 40-in | 17.9 |
| S6870 | 2003 Mar 26 | 2725.49996 | 3.08 | 45 | 74-in | 18.0 | ||
| S6872 | 2003 Mar 27 | 2726.48824 | 2.09 | 45 | 74-in | 18.0 | ||
| S6881 | 2003 Mar 29 | 2728.46586 | 2.06 | 45 | 74-in | 18.0 | ||
| S6887 | 2003 Mar 30 | 2729.43842 | 2.16 | 45 | 74-in | 18.0 |
Notes: NR = Nova Remnant; IP = Intermediate Polar; P = Polar; DN = Dwarf Nova; is the integration time; ‘:’ denotes an uncertain value; ∗ mean magnitude out of eclipse; a taken with the SAAO CCD; b taken with a V filter.
| Object | Type | Run No. | Date of obs. | HJD of first obs. | Length | Tel. | V | |
|---|---|---|---|---|---|---|---|---|
| (start of night) | (+2452000.0) | (h) | (s) | (mag) | ||||
| SDSS 2050-05 | P | S7062 | 2003 Aug 28 | 2880.32638 | 3.31 | 30 | 40-in | 18.1∗,a |
| S7065 | 2003 Aug 29 | 2881.41126 | 0.88 | 30 | 40-in | 18.2∗,a | ||
| S7080 | 2003 Sep 03 | 2886.31274 | 1.95 | 30 | 40-in | 17.7∗ | ||
| S7091 | 2003 Sep 16 | 2899.23195 | 1.13 | 60 | 40-in | 17.8∗ | ||
| S7093 | 2003 Sep 17 | 2900.26348 | 0.62 | 60 | 40-in | 17.8∗ | ||
| S7099 | 2003 Sep 20 | 2903.22917 | 1.60 | 60 | 40-in | 18.0∗ | ||
| S7105 | 2003 Sep 21 | 2904.31274 | 1.05 | 60 | 40-in | 18.0∗ | ||
| S7128 | 2003 Sep 29 | 2912.23631 | 0.73 | 30 | 74-in | 18.0∗ | ||
| FH Ser | NR | S7045 | 2003 Aug 22 | 2874.23498 | 3.49 | 10 | 40-in | 17.2: |
| S7050 | 2003 Aug 23 | 2875.21135 | 3.85 | 10 | 40-in | 17.0: | ||
| S7056 | 2003 Aug 27 | 2879.23047 | 4.46 | 30 | 40-in | 17.0a,b |
Notes: NR = Nova Remnant; P = Polar; is the integration time; ‘:’ denotes an uncertain value; ∗ mean magnitude out of eclipse; a taken with the SAAO CCD; b taken with a V filter.
2.1 V356 Aquilae
V356 Aql was Nova Aquilae 1936, No. 1, discovered by Tamm (1936), reaching maximum brightness at = 7.7 and receiving classification as a slow nova. It settled down at a post-eruption brightness of V = 18.3 (Szkody 1994). It has no determination of orbital period, and has not been studied with time resolved photometry. The spectrum in the quiescent state (Ringwald, Naylor & Mukai 1996) shows weak H emission on a continuum that rises rapidly at short wavelengths probably indicative of a high mass transfer accretion disc of modest inclination. With the measured H equivalent width of 15 Å and the assumption of an accretion disc background luminosity, an inclination is deduced (see Figure 2.20 of Warner 1995).
Our observational runs on V356 Aql are listed in Table 1; we observed it on 6 nights in September/October 2001 and then revisited in August 2003 to check whether it showed the same behaviour. The light curves are given in Fig. 1. We have been unable to interpret these in any useful way. The light curves of V356 Aql during runs S6258, S6262 and S6279 (see Fig. 1) show flare-like outbursts of 0.3 mag recurring on time scales 3000 s, but there is no definite periodicity, and the other nights show different behaviours. The FTs quite naturally show excess power at 3000 s and harmonics, but there is no coherent period. There are no periodicities at shorter time scales.
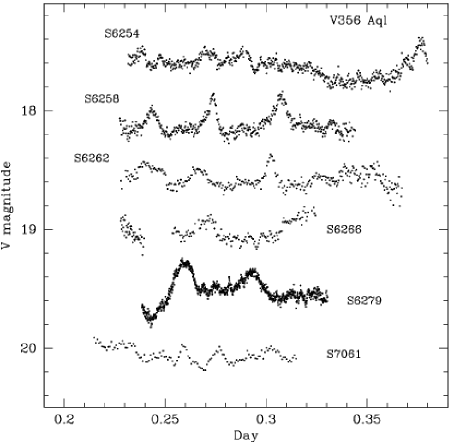
There are some similarities of the light curves to those of large amplitude ZZ Cet stars (e.g. Warner & Nather 1972), but the time scale is much longer and the surface temperature of a white dwarf that erupted only 70 years ago should be much hotter than the ZZ Cet instability strip. Because of accretion of hydrogen, the hotter helium-rich pulsational instability strip should not be relevant to a nova remnant like V356 Aql.
Time-resolved spectroscopy used to investigate the changes that take place during the flare-like outbursts could help to interpret this unusual object.
2.2 Aqr1 (= SDSS J223843.84+010820.7)
Listed in the Downes et al. (2001) catalogue as Aqr1, this star was identified as a CV by Berg et al. (1992) in a survey for bright QSOs, where it was designated 2236+0052. It was rediscovered in the Sloan Digital Sky Survey (Szkody et al. 2003), where it is listed as SDSS 2238. The spectrum has strong Balmer emission on a blue continuum and shows HeII of moderate strength.
Szkody et al. (2003) obtained 7 spectra in a 1.7 h run and deduced = 2.0 h but this must be somewhat uncertain because of the undersampling; they also obtained 3.75 h of photometry, with 10 min integrations, and described the result as random variability at the 0.02 mag level.
Our observations of Aqr1 are listed in Table 1 and the light curves shown in Figs. 2 and 3. The light curves show that Aqr1 has a brightness modulation with a time scale of several hours and variable range up to 0.2 mag, upon which is superimposed a regular periodicity near 6.7 min and maximum range 0.10 mag. Fig. 3 shows a blow up of part of the light curve of run S6600 – the 6.7-min periodicity is clearly visible in the light curve. This modulation is the signature of an intermediate polar (IP). However, there is some ambiguity in the interpretation of this star, so we give more details of the analysis.
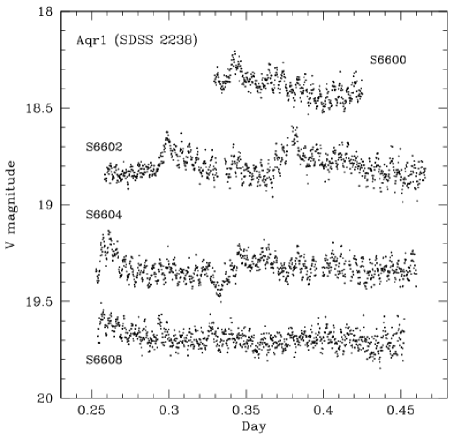


The shorter period appears not to be significantly aliased in the FT of the combined four runs (upper panel of Fig. 4), and is at = 6.72841( 16) min with a mean amplitude 0.028 mag. There are evident sidebands to the main peak, both at lower and higher frequencies. Keeping in mind that in other IPs the sideband frequencies are displaced from the main peak by multiples of the orbital frequency (e.g. Warner 1986), we looked for such a suite of frequencies in Aqr1 and met with an unexpected problem: in the total FT there is no set of frequencies that produces a convincing fit. There is a strong peak at low frequency (lower panel of Fig. 4) corresponding to 2.295 h, with approximately one-day aliases at 2.08 h and 2.55 h. These are near to the spectroscopic period, but are primarily due to the two strong flares seen in run S6602 (Fig. 2). If we exclude run S6602 from the FT, the peak at 2.295 h disappears. In the FT with run S6602 excluded, a low frequency peak with a fair number of possible aliases is seen around 86 Hz, matching the orbital sidebands noted previously.
Denoting the rotation frequency of the primary as , these sidebands qualitatively fit the scheme (Warner 1986) , , . There is some indication in the FT of run S6604 (Fig. 5) for a sideband at , which suggests the principal peak as the rotational frequency (in some IPs the strongest modulation in the optical is at ).
We find from a non-linear least squares fit of sinusoids that = 2391.05 Hz, and = 2563.19 Hz. The mean value of from the orbital sidebands is 86.1 Hz. These peaks are marked by vertical bars in the upper panel of Fig. 4. Although far less probable, the one-day alias of the orbital frequency at 74.5 Hz cannot be excluded from these data.
Furthermore, we noticed that adding the fourth night of data to the first three produced confusion (in the sense of extra structure within the sideband envelopes) in the FT. This led us to suspect that the sideband amplitudes vary from night to night, which the FT will interpret as amplitude modulation and generate appropriate extra sidebands, typically with 1/(2 d) spacings, which are what we see within the sideband patterns.
That this is the case is seen in Fig. 5, where we show FTs for the individual nights. Although the frequency resolution is low the relative amplitudes of the sidebands vary greatly: in S6600 the high frequency sideband is not resolved but has about one third of the amplitude of the main peak and the low frequency sideband is not clearly present; in S6602 both the high and the low frequency sidebands are of low amplitude; in S6604 the high frequency sideband is at about half the amplitude of the main peak, and there are two bands on the low frequency side of which the furthest is not seen in the other runs and appears at about twice the spacing of the usual sideband; in S6608 the high frequency sideband is at about 80% of the height of the main peak and the low frequency sideband is about 55% of the main peak.
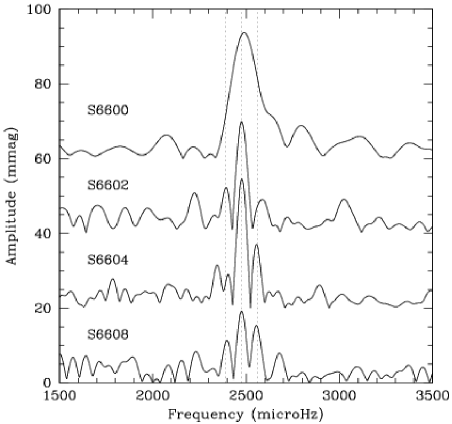
We are now confronted by a contradiction: in standard IPs the sideband frequency splitting agrees exactly with the orbital frequency (), but in Aqr1 our deduced orbital period from the 86.1 Hz splitting is = 3.226 h, which is quite different from the spectroscopic period = 2.0 h measured by Szkody et al. (2003). This appears to be a further case of a measured not agreeing with : the previous examples are (a) GW Lib, in which the photometric period = 2.08 h (Woudt & Warner 2002b) bears no obvious relation to the measured = 1.28 h (Thorstensen et al. 2002), (b) FS Aur in which = 1.428 h and = 3.4247 h (Tovmassian et al. 2003), and (c) HS 2331+3905 where is not stable but is always near to 3.5 h and = 1.351 (Araujo-Betancor et al. 2004). In the last case there is no doubt, from the presence of eclipse, that .
In Aqr1 we deduce the presence of a magnetic primary rotating with a period of 6.7 min, which eliminates any interpretation of as arising in a slowly rotating primary.
2.3 FIRST J102347.8+003841 in Sextans
This star was discovered as a radio source with the use of the Very Large Array and was identified in the optical as a 17th magnitude star (Bond et al. 2002). It was later independently discovered in the Sloan Digital Sky Survey, where it is given the designation SDSS 1023 (Szkody et al. 2003). CVs are not strong radio sources, and the few detections are of systems many magnitudes brighter. The spectrum has strong emission lines of He II 4686 Å and of He I, as well as the usual Balmer lines, which Bond et al. suggest could be the signature of a magnetic primary, which might go some way to explaining the radio flare. Spectra and radial velocities obtained by Szkody et al. (2003) over only 1.7 h suggest a h and variations that they consider to be more typical of an intermediate polar than a polar.
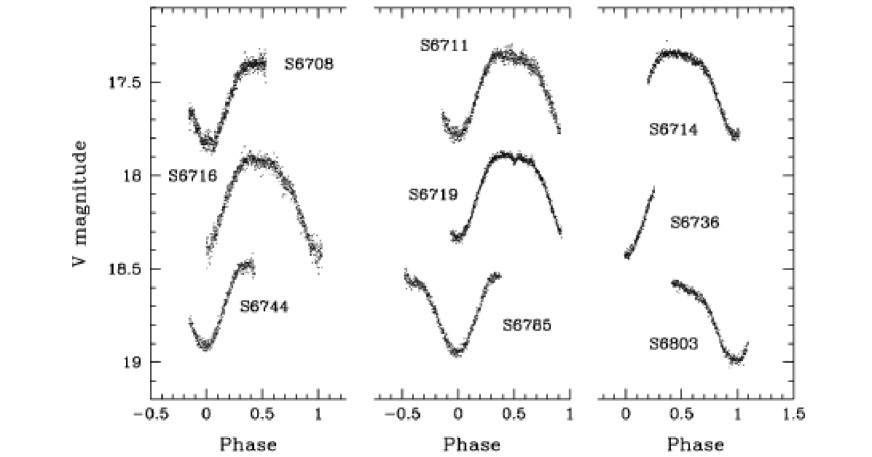
A CV discovered by such a unique method invites further study. Our photometric runs are listed in Table 1, the individual light curves are shown in Fig. 6 and the binned mean light curve, phased according to the ephemeris derived below, is given in Fig. 7.
FIRST J1023+0038 has a strong repetitive modulation with a range of 0.45 mag about a mean of V 17.5 and a period of 4.7548 h. Low amplitude flickering is evident, showing the presence of mass transfer. Fourier transforms of our light curves show only the fundamental and first harmonic of the principal modulation – there is no evidence for any other periods in the system. The absence of a subharmonic shows that the observed period is the actual orbital period. The ephemeris for the times of minima is
| (1) |
The profile of the brightness modulation resembles that of a reflection effect, rather than an eclipse. The implication is that there is a hot white dwarf in the system, possibly indicative of a nova eruption, overlooked some time in the not too distant past (e.g. a few decades ago). A list of reflection effects in known recent novae is given in Woudt & Warner (2003b) in connection with the CV RX J1039.7–0507. FIRST J1023+0038 is only 10 degrees away in the same constellation, with Galactic coordinates and and is therefore far from the direction of the Galactic bulge where most searches for novae tend to concentrate.
The optimal condition for a large reflection effect is reached for short orbital period systems, where the separation of the components is small, and/or in absence of screening of the secondary by an optically thick accretion disc – which can only happen if there is a strongly magnetic primary (Prialnik 1986; Kovetz, Prialnik & Shara 1988). At = 4.75 h FIRST J1023+0038 does not have the required small and therefore is probably strongly magnetic, i.e. it is likely to be a polar. If so, it could have been desynchronised by the putative nova eruption – detection of modulated polarisation at a period slightly different from that of would confirm our suggestion that it is a nova remnant. The pole switching in a desynchronised polar (e.g. Mason et al. 1998) and/or reconnection events in the magnetic field lines connecting the primary and the secondary could produce just the conditions to explain the unusual radio flare in FIRST J1023+0038; but in any case, the independent deduction of the presence of a strong magnetic field is compatible both with the spectrum and the existence of radio emission.

2.4 H 0242–2802 in Fornax
The star known currently as H 0242–2802, which is in the constellation Fornax and will be abbreviated here to H 0242, was discovered in an H emission line survey (Clowes et al. 2002) and found to have a spectrum resembling WZ Sge, with double peaked emission lines and the underlying white dwarf absorption spectrum, by Howell et al. (2002), who measured its brightness at B = 19.0. It is clearly a CV with a very low rate of mass transfer.
Our photometric runs on H 0242 are listed in Table 1. H 0242 is a deeply eclipsing system with a period of 1.790 h, showing an orbital hump lasting about half the orbital period, interrupted by an eclipse, very much in the classical style of Z Cha and OY Car. Our photometric period agrees very well with the recently obtained spectroscopic period of min of H 0242 (Mason & Howell 2004). We acquired observations of four eclipses on two consecutive nights. The mean light curve is shown in Fig. 8 and the ephemeris of mid-eclipse is

| (2) |
H 0242 is a candidate for searching for non-radial pulsations in its white dwarf primary. The spectrum and the eclipse profile indicate that the primary contributes at least half of the light in the system; such objects are commonly found to have ZZ Cet primaries (Warner & Woudt 2003).
2.5 GI Monoceros
Nova Monocerotis was discovered at 8.5 mag by M. Wolf in February 1918 some weeks after maximum, which probably was V 5.2 at the beginning of the year. It was a fast nova, later designated as GI Mon. Modern spectra show weak H emission on a very blue continuum (Liu & Hu 2000), typical of a high optically thick accretion disc.
Prior to eruption a single photographic detection shows it to have been at magnitude 15.1, a brightness to which it returned by 1975 (Robinson 1975). However, there has been a decline since then: Szkody (1994) measured V = 16.2 in 1989, which agrees with our current estimate (Table 1). This is a greater range than could be attributed to the slow ( 60 d) oscillations in brightness with a range of 0.6 mag, typical of high discs, found to be present in GI Mon (Honeycutt 2001).
Our observations are listed in Table 1 and consist of a two runs obtained in 2000 (of which only S6155 is long enough to be useful) and three more three years later. The latter were obtained with the SAAO CCD photometer mounted on the 1-m reflector, which we had access to at the same time that we were using the UCT CCD photometer on the 1.9-m telescope. The longer read-out time for the SAAO CCD resulted in lower time resolution than what we were able to achieve with the UCT CCD.

The light curves are shown in Fig. 9, with the 2003/4 group aligned according to the period given below. The mean light curve for the latter is shown in Fig. 10. GI Mon shows a brightness variation with a range of 0.10 mag and a period of 4.325 h, which is indicative of orbital or superhump modulation in a system of moderate inclination. The ephemeris for minimum brightness of these observations is:
| (3) |
The FT for the 2003/4 light curves, after prewhitening with the 4.325 h modulation and its first harmonic, shows a peak at 48.6 min (Fig. 11). Within the errors of the least squares fit, a peak at its first harmonic (at 24.2 min) is identified in the FT; both the fundamental and first harmonic of this modulation are marked in Fig. 11. The mean range of the 48.6-min modulation, as seen in the FT, is 16 mmag but individual cycles have much large amplitudes.
In the FT of run S6155 (taken three years earlier) excess power is seen around 52 min; given the relative short data length ( 7 cycles of the putative 48.6 min modulation), this peak is not well resolved in this individual run. In Fig. 9 we have marked the consecutive minima of the 48.6 min modulation in run S6155 by vertical bars. There are no shorter period coherent modulations in the light curves.


Our conclusion is that GI Mon is a candidate intermediate polar with an orbital period of 4.33 h and a spin-related period of 48.6 min. Our observations are not sufficient to detect possible orbital side bands to the 48.6 min signal, so we do not know whether it is the white dwarf rotation period or a reprocessed signal.

2.6 AO Octantis
AO Oct is a dwarf nova of the SU UMa type, showing superoutbursts approximately once per year. At maximum of outburst it reaches V 15.3111The General Catalogue of Variable Stars (Kholopov et al. 1985) states that maximum is at V = 13.5, and this has been perpetuated in the literature. However, we believe this to be a transcriptional error as the original discovery paper by von Gessner & Meinunger (1974) reports a maximum of 15.3.; at minimum it can be as faint as V = 21 (Vogt & Bateson 1982; Howell et al. 1991). Superhumps with a period of 96.70 min are observed during superoutburst (Patterson et al. 2003). Early photometric observations of AO Oct at quiescence failed to show any orbital modulation (Howell et al. 1991), but those data were very noisy and at the limit of the instrument available (V = 20.9, observed with a 1-m telescope and a V filter). More recent photometry (September 2000) has been successful (Patterson et al. 2003).
Our photometric observations are listed in Table 1. We detected orbital modulation in our first observation in June 2000 and later extended coverage with three nights in August 2000, when it happened that AO Oct was about 0.5 mag brighter than in June. The light curves are shown in Fig. 12; an orbital modulation with a peak-to-peak range of 0.2 mag is clearly seen, but there was also a great deal of flickering during run S6121. The FT of the August light curves has a peak at 94.10 min, which we increased in accuracy by performing a non-linear least squares fit to find a period of 94.097 ( 0.022) min. This is in reasonable agreement with the value 94.43 ( 0.19) min obtained from photometry at quiescence by Patterson et al. (2003). The ephemeris for maximum light is given by
| (4) |
Fig. 13 shows the mean light curve obtained by folding our light curves at the orbital period. The superhump period is 2.8% longer than the orbital period, giving a beat period between the two of 2.4 d, which is typical of SU UMa stars of this orbital period (Warner 1995).

2.7 V972 Ophiuchi
V972 Oph was Nova Ophiuchi 1957, discovered by Haro at magnitude 9.8 (Haro 1957), but reaching 8.0 at maximum. It is classified as a slow nova. The spectrum obtained by Ringwald et al. (1996) shows a red continuum with no distinct emission lines; they measured its brightness as V = 16.7. However, Zwitter & Munari (1996) measured B = 17.5 and although they also saw a red continuum, they found double-peaked He II emission, strong H emission, and weak H emission superimposed on wide absorption, typical of a high disc. The absence of He I lines led them to conclude that the white dwarf in V972 Oph is still extremely hot. The continuum slope is due to reddening in this low galactic latitude () nova.
The spectra confirm that the nova remnant has been correctly identified (Duerbeck 1987) but our first photometric observation, made in April 2002, showed no sensible short time scale variations. Revisiting in August 2003 revealed the expected activity. It is possible that the changes in level of activity are correlated with the strength of the emission lines, and that the spectrum obtained by Ringwald et al. is characteristic of the quieter moments.

Our runs are listed in Table 1 and the light curves are shown in Fig. 14. The 2003 runs show considerable activity, but there is no sign of any orbital modulation on time scales of hours and the FTs do not show any persistent periodicities.
2.8 SDSS J015543.40+002807.2 in Cetus
SDSS 0155 is a CV announced in the first Sloan Digital Sky Survey release (Szkody et al. 2002), where its strong He II emission and its identification as a ROSAT source clearly pointed to its being a polar. Comparison of SDSS photometry and earlier photographic images showed that SDSS 0155 has high and low states of luminosity, over the range 14.7 – 17.6 mag, compatible with a polar classification. Radial velocity measurements of the HeII lines obtained when the system was in a high state gave an orbital period of 88 2 min.
Our photometric observations are listed in Table 1 and were obtained when SDSS 0155 was in a low state. The light curves are given in Fig. 15 and show the star to be a deeply eclipsing system with an eclipse lasting 320 s and a period of 87.13 0.02 min. Because it is too faint to detect when in eclipse we have plotted the light curve on an intensity instead of a magnitude scale. We have used zero intensities (rather than noise-determined upper limits) for the integrations obtained in eclipse. The ephemeris for the middle of eclipse of the primary is

| (5) |
The light curve shows that SDSS 0155 is probably a single pole accretor, with the accretion region hidden behind the primary for roughly half an orbital period.
2.9 SDSS J023322.61+005059.5 in Cetus
SDSS 0233 is another CV in the first release of the SDSS (Szkody et al. 2002), where its spectrum was found to be dominated by narrow Balmer emission and weak He I on a blue continuum. In appearance it possibly resembles a low inclination dwarf nova in quiescence, but Szkody et al. found it to be a highly variable X-Ray source, which is uncharacteristic of a CV with such a low energy optical spectrum.
Our observations are listed in Table 1 and the light curves are displayed in Fig. 16. The star shows slow flaring activity of considerable amplitude, and faster flickering, but despite our having devoted a moderate amount of photometric time to it there are no hopeful indications of any persistent periodicity, so we have relegated it.

2.10 SDSS J124058.03-015919.2 in Virgo
SDSS 1240 was discovered recently as a candidate AM CVn star following a systematic search for AM CVn systems in the first data release of the Sloan Digital Sky Survey (Roelofs et al. 2004). SDSS 1240 was previously identified as a DB white dwarf following the 2dF quasar redshift survey (Croom et al. 2001) – the 2dF spectrum shows broad absorption lines in the blue part of the spectrum. Roelofs et al. (2004) have obtained spectra with the 6.5-m Magellan telescope and clear double-peaked He I emission lines are present, as well as He II (4686 Å) and N III (4634 and 4640 Å) emission lines.

Our photometry is listed in Table 1 and the longer light curves (runs S7240, S7254 and S7260) are shown in Fig. 17. Surprisingly, no variations are seen in the light curves and combined FT. There is little or no flickering, and no orbital modulation is detectable. The orbital period will have to be determined from spectroscopy.
2.11 SDSS J155644.24-000950.2 in Serpens
SDSS 1556 emerged as a V 18.1 mag star in the first release of Sloan Digital Sky Survey CVs (Szkody et al. 2002) where the spectrum is seen to have Balmer emission lines, with no He II emission, and the H emission is centred in the absorption trough of the underlying white dwarf spectrum. These are the characteristics of a dwarf nova with low , probably of short orbital period.
Our observations are listed in Table 1 and the light curves are shown in Fig. 18. There is a clear non-sinusoidal modulation with a period of 1.78 h, a peak-to-peak range of 0.4 mag. and small variations in profile from cycle to cycle. The mean light curve, summed modulo the measured period, is shown in Fig. 19. The FT of the light curves, seen in Fig. 20, has an aliasing ambiguity at the fundamental frequency, but the presence of the first (and fourth) harmonic gives further estimates of the period, and there is only one alias at the fundamental that furnishes fits (to within 1 Hz) to the aliases in the harmonic patterns. This gives a period of 1.778 h (106.7 min). The ephemeris for maximum light is:
| (6) |


It is probable that this period is for SDSS 1556, but the profile of the mean light curve (Fig. 19) is similar to that of the long outburst interval dwarf nova GW Lib (Woudt & Warner 2002b) which we have discussed in Sect. 2.2, so we advise caution in interpretation of the photometric period.

The FT prewhitened at the fundamental and first and fourth harmonic shows low amplitude but significant structure, with peaks near 1558 s, 1137 s, and 834 s (the lower panel of Fig. 20); the low frequency peak off the scale in the prewhitened FT is due to the data length of some observing runs. As SDSS 1556 is a low system it could be expected to show non-radial oscillations of the ZZ Cet type, as detected in a number of other low CVs (Warner & Woudt 2003). Our observed periods are somewhat beyond the observed long end of non-accreting ZZ Cet stars, but are theoretically possible (see discussion by Mukadam et al. 2002). We need to obtain further observations before drawing a conclusion on the nature of these periodicities.
2.12 SDSS J205017.84-053626.8 in Aquarius
SDSS 2050 is another product of the second release of CVs in the Sloan Digital Sky Survey (Szkody et al. 2003). The spectrum has very prominent He II 4686 Å, almost as strong as neighbouring H, which is a frequent characteristic of magnetic CVs. Szkody et al. (2003) find a tentative of 2 h from only 1.8 h of spectral coverage. Of considerable significance is their observation of a low state in July 2002, compared with a month later when it was bright enough to obtain the spectra; again this is characteristic of magnetic CVs – in particular, polars.
Our observations of SDSS 2050 are listed in Table 1 and the longest light curve (S7062) is shown in Fig. 21. The other runs were obtained around the times of eclipses in order to improve the period determination. The light curve is clearly that of a high inclination polar, with eclipses 1.5 mag deep of 260 s duration recurring with a period = 1.5702 h. The ephemeris for mid eclipse is given by

| (7) |
2.13 FH Serpentis
FH Ser was Nova Serpentis 1970, discovered by Hirose & Honda (1970) and, during eruption, was one the best-studied novae of the twentieth century, showing a great increase in infrared luminosity at the time that the optical brightness diminished through the formation of dust in the ejecta. It reached V = 4.4 at maximum and has declined to post-outburst brightness of V 17.6. Its modern classification is a slow nova of the Fe II class (Williams 1992). It has an observed ejecta shell (Gill & O’Brien 2000). Despite its importance in the history of understanding the evolution of nova light curves, it does not have a known orbital period, and no high speed photometry for it has been published. The spectrum in 1991 was still dominated by emission lines from the ejecta (Ringwald et al. 1996). We observed FH Ser in the hope of detecting an orbital brightness modulation. Our observations are listed in Table 1 and the light curves are displayed in Fig. 22.
FH Ser shows rapid flickering superimposed on slow excursions of 0.5 mag on time scales 2.5 h. The FTs do not show evidence for any coherent periodicity on time scales up to a few hours. The large amplitude of flickering will mask orbital modulation; to obtain the orbital period by a photometric method will probably require a multi-site collaborative campaign.

3 Summary and discussion
Our observations are of a mixed group of CVs – four known old novae (GI Mon, V356 Aql, V972 Oph and FH Ser), in the latter three we found no orbital modulation, and a possibly overlooked nova (FIRST J1023). We have found two new polars with deep eclipses (SDSS 0155 and SDSS 2050) and a new intermediate polar (Aqr1). We have determined orbital periods for two dwarf novae in quiescence (AO Oct and H 2042) and observed periodic modulations in one other dwarf novae (SDSS 1556) that might be orbital but could also be a possible further manifestation of the GW Lib phenomenon of a non-orbital modulation of unknown origin. We find no periodic photometric signal in SDSS 0233, nor in the new AM CVn star SDSS 1240.
Among our results is one CV, Aqr1, for which the spectroscopic period differs considerably from the photometric period. We summarise this in Table 2 and draw attention to the clustering of period ratios, which is perhaps indicative of some resonance effect in operation.
| Star | (h) | (h) | |
|---|---|---|---|
| GW Lib | 2.09 | 1.280 | 1.63 |
| Aqr1 | 3.226 | 2.0 | 1.6 |
| FS Aur | 3.425 | 1.428 | 2.40 |
| HS 2331 | 1.351 | 3.5 | 1/2.6 |
Acknowledgments
We thank Dr. D. O’Donoghue for the use of his EAGLE program for Fourier analysis of the light curves. PAW is supported by funds made available from the National Research Foundation and by strategic funds made available to BW from the University of Cape Town. BW’s research is supported by the University. MLP is supported by a bursaries from the Department of Labour and the National Research Foundation.
References
- [1] Araujo-Betancor, S., Gänsicke, B.T., Hagen, H.-J., Marsh, T., Thorstensen, J., et al., 2004, Proc. IAU Coll. 194, RevMexAA (SC), in press
- [2] Berg C., Wegner G., Foltz C.B., Chaffee Jr. F.H., Hewett P.C., 1992, ApJS, 78, 409
- [3] Bond H.E., White R.L., Becker R.H., O’Brien S., 2002, PASP, 114, 1359
- [4] Clowes R., Huber M., Howell S.B., Mason E., 2003, in preparation
- [5] Croom, S.M., Smith, R.J., Boyle, B.J., Shanks, T., Loaring, N.S., et al., 2001, MNRAS, 322, 29
- [6] Downes R.A., Webbink R.F., Shara M.M., Ritter H., Kolb U., Duerbeck H.W., 2001, PASP, 113, 764
- [7] Duerbeck H.W., 1987, Sp.Sci.Rev., 45, 1
- [8] Gill C.D., O’Brien T.J., 2000, MNRAS, 314, 175
- [9] Haro G., 1957, HAC No. 1405
- [10] Hirose H., Honda M., 1970, IAUC, 2212
- [11] Honeycutt R.K., 2001, PASP, 113, 473
- [12] Howell S.B., Dobrzycka D., Szkody P., Kreidl T.J., 1991, PASP, 103, 300
- [13] Howell S.B., Mason E., Huber M., Clowes R., 2002, A&A, 395, L47
- [14] Kholopov P.N., 1985, (ed.) General Catalogue of Variable Stars, Moscow
- [15] Kovetz A., Prialnik D., Shara M.M., 1988, ApJ, 325, 828
- [16] Liu W., Hu J.Y., 2000, ApJS, 128, 387
- [17] Mason E., Howell S.B., 2004, Proc. IAU Coll. 194, RevMexAA (SC), in press
- [18] Mason P.A., Ramsay G., Andronov I., Kolesnikov S., Shakhovskoy N., Pavlenko E., 1998, MNRAS, 295, 511
- [19] Mukadam, A.S., Kepler, S.O., Winget, D.E., Bergeron, P., 2002, ApJ, 580, 429
- [20] O’Donoghue D., 1995, Baltic Astr, 4, 517
- [21] Patterson J., Thorstensen J., Kemp J., et al., 2003, PASP, in press
- [22] Prialnik D., 1986, ApJ, 310, 222
- [23] Ringwald F.A., Naylor T., Mukai T., 1996, MNRAS, 281, 192
- [24] Robinson E.L., 1975, AJ, 80, 515
- [25] Roelofs, G.H.A., Groot, P.J., Steeghs, D., Nelemans, G., 2004, Proc. IAU Coll. 194, RevMexAA (SC), in press
- [26] Szkody P., 1994, AJ, 108, 639
- [27] Szkody P., Anderson S.F., Agüeros M., Covarrubias R., Bentz M., et al., 2002, AJ, 123, 430
- [28] Szkody P., Fraser O., Silvestri N., Henden A., Anderson S.F., et al., 2003, AJ, 126, 1499
- [29] Tamm N., 1936, AN, 260, 375
- [30] Thorstensen J.R., Patterson J., Kemp J, Vennes S., 2002, PASP, 114, 1108
- [31] Tovmassian G., Zharikov, S., Michel, R., Neustroev, V., Greiner, J., et al., 2003, PASP, 115, 725
- [32] Vogt N., Bateson F.M., 1982, A&AS, 48, 383
- [33] von Gessner H., Meinunger I., 1974, Verand. Sterne 6, 249
- [34] Warner B., 1986, MNRAS, 219, 347
- [35] Warner B., 1995, Cataclysmic Variable Stars. CUP, Cambridge
- [36] Warner B., Nather R.E., 1972, MNRAS, 156, 1
- [37] Warner B., Woudt P.A., 2003, Proc. IAU Colloq. No. 193, in press
- [38] Williams R.E., 1992, AJ, 104, 725
- [39] Woudt P.A., Warner B., 2001, MNRAS, 328, 159
- [40] Woudt P.A., Warner B., 2002a, MNRAS, 335, 44
- [41] Woudt P.A., Warner B., 2002b, Ap&SS, 282, 433
- [42] Woudt P.A., Warner B., 2003a, MNRAS, 340, 1011
- [43] Woudt P.A., Warner B., 2003b, MNRAS, 339, 731
- [44] Zwitter T., Munari U., 1996, A&AS, 117, 449