7323 11institutetext: Max-Planck-Institut fur extraterrestrische Physik, 85748 Garching, Germany
ROSAT-SDSS Galaxy Clusters Survey.
Abstract
For a detailed comparison of the appearance of cluster of galaxies in X-rays and in the optical, we have compiled a comprehensive database of X-ray and optical properties of a sample of clusters based on the largest available X-ray and optical surveys: the ROSAT All Sky Survey (RASS) and the Sloan Digital Sky Survey (SDSS). The RASS-SDSS sample comprises 114 X-ray selected clusters. For each system we have uniformly determined the X-ray and optical properties . For a subsample of 53 clusters we have also compiled the temperature and the iron abundance from the literature. The total optical luminosity can be determined with a typical uncertainty of 20% with a result independent of the choice of local or global background subtraction. We searched for parameters which provide the best correlation between the X-ray luminosity and the optical properties and found that the z band luminosity determined within a cluster aperture of 0.5 Mpc provides the best correlation with a scatter of about 60%. The resulting correlation of and in the z and i bands shows a logarithmic slope of 0.38, a value not consistent with the assumption of a constant . Consistency is found, however, for an increasing M/L with luminosity. This is confirmed by our analysis of the cluster mass to light ratio for a subsample of 53 clusters. We found a significant dependence of on the cluster mass with a logarithmic slope ranging from 0.27 in the i and r bands to 0.22 in the z band.
keywords:
galaxy clusters – optical luminosity – mass to light ratio1 Introduction
Cluster of galaxies are the largest well defined building blocks of our Universe. They form via gravitational collapse of cosmic matter over a region of several megaparsecs. Cosmic baryons, which represent approximately 10-15% of the mass content of the Universe, follow dynamically the dominant dark matter during the collapse. As a result of adiabatic compression and of shocks generated by supersonic motions, a thin hot gas permeates the cluster gravitational potential. For a typical cluster mass of the intracluster gas reaches a temperature of the order of keV and, thus, radiates optically thin thermal bremsstrahlung and line radiation in the X-ray band. In addition to the hot, diffuse component, baryons are also concentrated in the individual galaxies within the cluster. These are best studied through photometric and spectroscopic optical surveys, which provide essential information about luminosity, morphology, stellar population and age.
Since solid observational evidences indicate a strong interaction between the two baryonic components, one of our goals is the comparison of the X-ray and the optical appearance of the clusters. We want in particular find optical parameters that provide the closest correlation to the X-ray parameters, such that we can predict within narrow uncertainty limits the X-ray luminosity from these optical parameters and viceversa. On the basis of these considerations, we have created a large database of clusters of galaxies based on the largest available X-ray and optical surveys: the ROSAT All Sky Survey (RASS), and the Sloan Digital Sky Survey (SDSS). By carefully combining the data of the two surveys we have created the RASS-SDSS galaxy cluster catalog. The X-ray-selected galaxy clusters cover a wide range of masses, from groups of to massive clusters of in a redshift range from 0.002 to 0.45. The RASS-SDSS sample comprises all the X-ray selected objects already observed in the sky region covered by the Sloan Digital Sky Survey. For all derived quantities, we have used , and .
2 The data.
In order to create a homogeneous catalog of X-ray cluster properties, we have calculated all X-ray parameters using only RASS data for all clusters in the sample. The X-ray luminosity has been calculated with the growth curve analysis (GCA) method used for REFLEX and NORAS 2, based on the RASS3 database (Böhringer et al., 2001). The optical photometric data were taken from the SDSS (York et al. 2000 and Stoughton et al. 2002). The SDSS consists of an imaging survey of steradians of the northern sky in the five passbands u, g, r ,i, z, in the entire optical range. Since the galaxies do not have sharp edges or a unique surface brightness profile, it is nontrivial to define a flux for each object. The SDSS photometric pipeline calculates a number of different magnitudes for each object: model magnitude, Petrosian magnitudes and PSF magnitudes. In the data analysis of this paper we used the Petrosian magnitudes for galaxies brighter then 20 mag and the psf magnitudes for objects fainter than 20 mag.
3 Optical Luminosity from SDSS data

The total optical luminosity of a cluster has to be calculated after the subtraction of the foreground and background galaxy contamination. Since we have used only photometric data from the SDSS galaxy catalog, we have no direct information on the cluster galaxy memberships. There are two different approaches to overcome this problem: a color cut or a statistical background subtraction. We chose the latter approach since the former method may introduce a bias against bluer cluster members observed to have varying fractions due to the Butcher-Oemler effect.
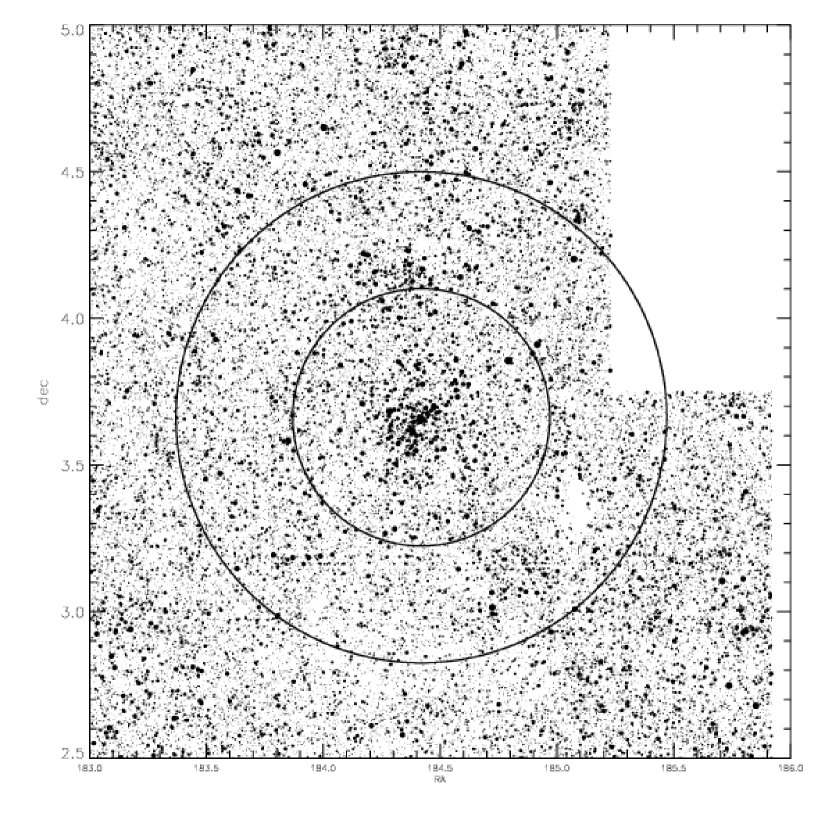
We have considered two different approaches to the statistical subtraction of the galaxy background. First we have calculated a local background within an annulus centered on the cluster X-ray center. The annulus has been then divided in 20 sectors and those featuring a larger than deviation from the median galaxy density are discarded from the further calculation (fig. 1, left panel).
As a second method we have derived a global background correction. The galaxy number counts was derived from the mean of the magnitude number counts determined in five different SDSS sky regions, each with an area of 30 (fig.1, right panel). The source of uncertainty in this second case is systematic and originates the presence of large-scale clustering within the galaxy sample, while the Poissonian error of the galaxy counts is small due to the large area involved. After the background subtraction we found that the signal to noise in the u band was too low to be useful, and performed our analysis on the 4 remaining Sloan photometric bands g,r,i,z.
In order to calculate the total cluster luminosity, we have calculated first the absolute magnitude, corrected for Galactic extinction and K-correction. We have estimated by using the (background corrected) magnitude number counts of the cluster galaxies with the following prescription:
| (1) |
The sum on right side is performed over all the magnitude bins with galaxy number and mean luminosity . The integral is an incompleteness correction due to the completeness limit of the galaxy sample at mag in the five Sloan photometric bands. is the individual Schechter luminosity function fitted to the galaxy sample of each cluster. The incompleteness correction is of the order of 5-10% in the whole cluster sample. This means that the galaxies below the magnitude limit do not give a significant contribution to the total optical luminosity. Therefore the most important source of error is due to the contribution of the background galaxy number counts. The uncertainty in each bin of magnitude is given by the Poissonian error of the bin counts (, with ) and the background subtraction in each magnitude bin (). Since the galaxy counts in the bins are independent, the error in the luminosity is given by:
| (2) |
4 Correlating X-ray and optical properties
For a cluster in which mass traces optical light ( is constant), the gas is in hydrostatic equilibrium (), and , we expect the X-ray bolometric luminosity to be related to the optical luminosity as and to the intracluster medium temperature as .
In this section we show that tight correlations exist between the total optical cluster luminosity and the X-ray cluster properties as the X-ray luminosity and the intracluster medium temperature.
To search for the best correlation between optical and X-ray properties and to optimally predict for example the X-ray luminosity from the optical appearance, we are interested in an optical characteristic, which shows a minimum scatter in the X-ray/optical correlation. Therefore, we performed a correlation using 4 of the 5 SDSS optical band, , , and , to find out which filter should be used in the prediction. We used a fixed aperture to calculate the optical luminosities for all the clusters, to make no a priori assumption about the cluster size. Moreover, to check whether the scatter in the correlation depends on the cluster aperture, we did the same analysis with different apertures. To quantify the and the relations, a linear regression in log-log space was performed. In any photometric band the scatter has a clear dependence on the cluster aperture by showing a region of minimum on the very center of the cluster, around 0.5 Mpc .


Fig. 2 shows the and relation respectively, at the radius of minimum scatter, 0.5 Mpc , in the z band. In fact the i and the z bands have a slightly smaller scatter than in the other optical bands at any radius. The best fit in the z band for the and the relations at the radius of minimum scatter are respectively:
| (3) |
| (4) |
| (5) |
5 Discussion and conclusions
The value of the exponent in the power law for the relation, is around 0.38 in the region of minimum. The values are not consistent within the errors with the value of 0.5 predicted under the assumption of hydrostatic equilibrium and constant mass to light ratio. The same conclusion can be derived for the relation. A simple reason of the disagreement could be due to the assumption of a constant mass to light ratio. In fact, Girardi et al. (2002) analysed in detail the mass to light ratio in the B band of a sample of 294 clusters and groups , finding . The same results was found by Lin et al. (2003) in the K band. Thus, if we consider this dependence of from the optical luminosity with the assumptions of hydrostatic equilibrium, the new expected relation between the optical luminosity and the X-ray luminosity and temperature are and , respectively, which are in good agreement with our results. The behavior of the as a function of the cluster mass and luminosity is confirmed also by our data as shown in fig. 3. We used the subsample of cluster with known temperature to calculate the mass within with the relation of Finoguenov et al. (2001). shows a clear dependence on the cluster mass with a slope from 0.27 in the i and r bands to 0.22 in the z band.
The scatter in the relation for the aperture with the best correlation (0.5 Mpc ), in the variable is 0.20, and the scatter in the variable is 0.22 in the correlations obtained in i and the z bands. Therefore, by calculating the total cluster luminosity in the central part of the system, one can use the or band to predict the X-ray luminosity from the optical data with a mean error of . In the same way the optical luminosity can be derived from with the same uncertainty. Analogous results are obtained for the relation. Since the observational uncertainties in the optical and in the X-ray luminosity are about 20%, the scatters of 60% in both relations should be intrinsic.
To better understand the relation between the X-ray and the optical properties and their physical implications, the optical luminosity has to be calculated within the physical size of the systems. This will be discussed in a forthcoming publication.


Funding for the creation and distribution of the SDSS Archive has been provided by the Alfred P. Sloan Foundation, the Participating Institutions, the National Aeronautics and Space Administration, the National Science Foundation, the U.S. Department of Energy, the Japanese Monbukagakusho, and the Max Planck Society. The SDSS Web site is http://www.sdss.org/. The SDSS is managed by the Astrophysical Research Consortium (ARC) for the Participating Institutions. The Participating Institutions are The University of Chicago, Fermilab, the Institute for Advanced Study, the Japan Participation Group, The Johns Hopkins University, Los Alamos National Laboratory, the Max-Planck-Institute for Astronomy (MPIA), the Max-Planck-Institute for Astrophysics (MPA), New Mexico State University, University of Pittsburgh, Princeton University, the United States Naval Observatory, and the University of Washington.
References
- Alonso et al. (1996) Abazajian, K., Adelman, J., Agueros, M.,et al. 2003, AJ, 126, 2081 (Data Release One)
- Alonso et al. (1996) Blanton, M., Blanton, M. R., Dalcanton, J., Eisenstein, D., et al. 2001, AJ, 121, 2358;
- Alonso et al. (1996) Blanton, M.R., Lupton, R.H., Maley, F.M. et al. 2003, AJ, 125, 2276 (Tiling Algorithm)
- Alonso et al. (1996) Böhringer, H., Schuecker, P., Guzzo, L., et al. 2001, A&A, 369, 826;
- Alonso et al. (1996) Eisenstein, D. J., Annis, J., Gunn, J. E., et al. 2001, AJ, 122, 2267;
- Alonso et al. (1996) Finoguenov, A., Reiprich, T. H., B hringer, H. 2001,A&A,368,749;
- Alonso et al. (1996) Fukugita, M., Ichikawa, T., Gunn, J. E. 1996, AJ, 111, 1748;
- Alonso et al. (1996) Girardi, M., Manzato, P., Mezzetti, M., et al. 2002, ApJ, 569, 720;
- Alonso et al. (1996) Gunn, J.E., Carr, M.A., Rockosi, C.M., et al 1998, AJ, 116, 3040 (SDSS Camera)
- Alonso et al. (1996) Hogg, D.W., Finkbeiner, D. P., Schlegel, D. J., Gunn, J. E. 2001, AJ, 122, 2129;
- Alonso et al. (1996) Lin, Y., Mohr, J. J., Stanford, S. A. 2003, ApJ,591,749;
- Alonso et al. (1996) Lupton, R. H., Gunn, J. E., Szalay, A. S. 1999, AJ, 118, 1406;
- Alonso et al. (1996) Lupton, R., Gunn, J. E., Ivezić, Z., et al. 2001, (astro-ph/0101420);
- Alonso et al. (1996) Pier, J.R., Munn, J.A., Hindsley, et al. 2003, AJ, 125, 1559
- Alonso et al. (1996) Schlegel, D., Finkbeiner, D. P., Davis, M. 1998, ApJ, 500, 525;
- Alonso et al. (1996) Shimasaku, K., Fukugita, M., Doi, M., et al. 2001, AJ, 122, 1238;
- Alonso et al. (1996) Smith, J.A., Tucker, D.L., Kent, S.M., et al. 2002, AJ, 123, 2121;
- Alonso et al. (1996) Stoughton, C., Lupton, R.H., Bernardi, M., et al. 2002, AJ, 123, 485;
- Alonso et al. (1996) Strauss, M. A., M.A., Weinberg, D.H.,
- Alonso et al. (1996) Lupton, R.H. et al. 2002, AJ, 124, 1810;
- Alonso et al. (1996) Yasuda, N., Fukugita, M. Narayanan, V. K. et al. 2001, AJ, 122, 1104;
- Alonso et al. (1996) York, D. G., Adelman, J., Anderson, J.E., et al. 2000, AJ, 120, 1579;