Compact Radio Sources in Orion: New Detections, Time Variability, and Objects in OMC-1S
Abstract
We present the analysis of four 3.6 cm radio continuum archival observations of Orion obtained using the Very Large Array in its A-configuration, with angular resolution. The observations were made during the period 1994-1997. In a region of , we detect a total of 77 compact radio sources. Of the total of detected sources, 54 are detected in one or more of the individual observations and 36 of these show time variability (by more than 30%) between the observed epochs. A deep image made from averaging all data shows an additional 23 faint sources, in the range of 0.1 to 0.3 mJy. Of the total of 77 sources, 39 are new centimeter detections. However, only 9 of the 77 sources do not have a previously reported counterpart at near-infrared, optical, or X-ray wavelengths. In particular, we detect three faint sources in the OMC-1S region that may be related to the sources that power the multiple outflows that emanate from this part of the Orion nebula.
1 INTRODUCTION
The Orion Nebula (NGC 1976, M42) is the closest region of massive star formation, and it is associated with a variety of compact objects that include stars, nebulae, and masers, as well as infrared, optical and X-rays sources (Gaume et al. 1998, Ali & Depoy 1995, O’Dell & Wen 1994, and Garmire et al. 2000). It is the best studied region of its class. A recent summary of the properties of Orion is given by O’Dell (2001).
The early identification by Laques & Vidal (1979) of six unresolved objects near Ori C, determined to be high ionization emission line sources, and subsequent studies in the radio by Garay et al. (1987), Churchwell et al. (1987), and Felli et al. (1993a; 1993b), among others, suggested that possibly these objects were compact neutral clouds photoionized externally by Ori C. The observations of these and similar sources in Orion with the HST by O’Dell et al. (1993), established their nature as externally ionized proto-planetary disks (proplyds). We refer the reader to Henney & Arthur (1998) for a detailed description of the propylds.
In this paper we present an analysis of radio continuum VLA archival observations of Orion, made at 3.6 cm in the highest angular resolution configuration A. One of the purposes of our analysis was to produce a deeper image that could reveal additional faint radio sources to those previously reported in the literature. Indeed, we detected 77 compact radio sources, 39 of which are new centimeter detections.
A region in Orion that has received considerable attention in recent years is OMC-1S (Keene, Hildebrand, & Whitcomb 1982; Bally, O’Dell & McCaughrean 2000), because it shows remarkable outflow activity. However, the identification of the exciting sources of these outflows remains unclear. We have used our deep, averaged image to search for continuum sources in this region.
2 OBSERVATIONS
We have used 3.6 cm archival data from the Very Large Array of the NRAO111The National Radio Astronomy Observatory is a facility of the National Science Foundation operated under cooperative agreement by Associated Universities, Inc. in its A-array configuration to study the cluster of radio sources in Orion and to search for new, fainter objects in a sensitive image made from concatenating all the data. The region was observed on 1994 April 29, 1995 July 22, 1996 November 21, and 1997 January 11. The amplitude calibrator was 1331+305, with an adopted flux density of 5.18 Jy, and the phase calibrator was 0501019, for all epochs except 1995, when 0541056 was used. The HPFW of the primary beam was 6′. In Table 1 we present a summary of the observations.
The data were analyzed in the standard manner using the package AIPS of NRAO. The data were also self-calibrated in phase and amplitude for each epoch. Individual images were made at each epoch to search for variability between the epochs observed. To diminish the effects of extended emission, we used only visibilities with baselines longer than 100 k, thus suppressing the emission of structures larger than 2′′. Images were made with the ROBUST parameter of IMAGR set to 0, to obtain an optimal compromise between sensitivity and angular resolution. In a region of , we detected a total of 54 sources in one or more of these individual images; the positions and integrated flux densities of these sources for each epoch are given in Table 2. We also list if they have been detected previously in the centimeter range.
To obtain a deeper image, the four individual maps were restored with a beam of ; PA = , the largest beam of the four individual maps. The four maps were then averaged with relative weights corresponding to the rms of each map. The resulting image had an rms of 0.03 mJy beam-1 and 23 additional sources were detected above the 5- level, in the range of 0.1 to 0.3 mJy. Given its weakness, these 23 additional sources could not have been detected in previous observations. The positions and integrated flux densities of these sources are given in Table 3.
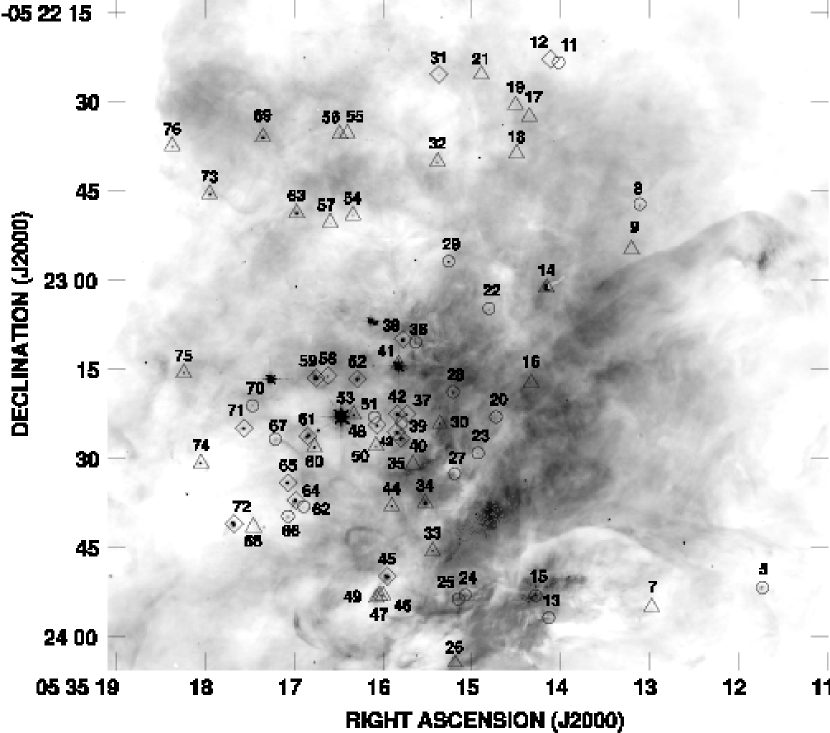
The position of most of the sources detected is shown in Figure 1, overlapped on the H image of O’Dell & Wong (1996). Seven of the 77 centimeter sources fall outside of the region shown in Figure 1. Following Fomalont et al. (2002), we estimate that in a field of the a priori number of expected 3.6 cm sources above 0.1 mJy is 0.6. We then conclude that probably one out of the 77 sources could be a background object, but that we are justified in assuming that practically all the members of the radio cluster are associated with Orion.
3 OVERALL CHARACTERISTICS OF THE SAMPLE OF RADIO SOURCES
3.1 New Centimeter Detections
Out of the 77 radio sources detected, 39 are new centimeter detections. These 39 new centimeter sources are the 16 sources without a GMR denomination in Table 2 and all 23 sources in Table 3. Most of the new 39 sources are, as expected, quite faint. The exceptions are sources 1 and 33 that reach a few mJy at least in one of the epochs observed. Source 1 is relatively away from the Orion cluster and was probably detected previously but simply not reported assuming it is not related to Orion (see discussion in section 4).
3.2 Counterparts at Other Wavelengths
In Table 4 we list the counterparts of the radio sources at near-IR, visible and X-ray wavelengths from the surveys of Ali & Depoy (1995), O’Dell & Wen (1994), and Feigelson et al. (2002), respectively. Other counterparts, when found in the SIMBAD database, are listed in the last column. A counterpart was taken as such if its position was within 1′′ of the radio position. The radio positions are estimated to be accurate to . Source numbering was assigned based on increasing right ascension.
Only 9 out of the 77 sources (1, 11, 15, 24, 25, 26, 27, 35, and 54) do not have a counterpart previously reported in the literature. These 9 sources have flux densities in the range of 0.20 to 2.96 mJy. Their nature is unclear, but we speculate that they may be highly obscured protostars that remain undetectable even at near-IR wavelengths. Centimeter emission, either thermal or non-thermal, can result from a variety of mechanisms present in low- and high-mass star forming regions, as discussed by Rodríguez, Gómez, & Reipurth (2003).
Of the 77 centimeter sources, 49 have a near-IR counterpart, while 46 are detected in the visible, and 38 in X-rays. A few of the sources have reported millimeter counterparts or are associated with H2O masers (see Table 4). Because of the orientation of the Orion nebula, with the main ionization front lying in front of the more distant and more opaque PDR, any bright proplyds we detect in the radio can be expected to be visible optically, since they lie in the relatively unobscured ionized gas. This in turn suggests that radio sources without an optical counterpart may be non-thermal sources rather than proplyds. In fact, of the 19 radio sources without optical counterparts that were detected in the images from individual epochs, 16 are variable, further supporting the idea that they are non-thermal.
3.3 Systematic Obscuration?
The sources at the west of the region seem to be systematically more obscured than those at the east. If we take the first 30 sources in Table 4, we find that only 8 (27%) have a visible counterpart, while if we take the last 47 sources, we find that 38 (81%) have a visible counterpart. This could be attributed to the fact that the main ionization front of Orion is closer to us in the SW of the nebula and that more stars could be embedded in the PDR behind the ionization front in this direction (Wen & O’Dell 1995).
3.4 Time Behavior
In Table 4 we also note if the radio sources are time variable (above a level of 30%). Of the total of 54 sources detected in one or more of the individual epochs, 36 show time variability (by more than 30%) between the observed epochs. The time behavior of the radio sources in Orion has been studied in detail by Felli et al. (1993a), where flux densities are reported for 13 epochs at two wavelengths for observations made over a seven-month span in 1990. In particular, we confirm the remarkable stability of source 59 (their source 6), that was used by them as a secondary reference source for flux calibration. This confirmation supports the reliability of our time monitoring.
On the other hand, a more detailed comparison of our results with those of Felli et al. (1993a) reveals new aspects of the time behavior of the sources. Felli et al. (1993a) firmly identify 13 objects as constant, thermal sources: their objects 2, 3, 5, 6, 7, 8, 11, 16, 17, 19, B, I, and K (corresponding to our sources 71, 65, 61, 59, 52, 48, 42, 53, 60, 74, 12, 19, and 55, respectively). We find that 8 out of these 13 sources are indeed non variable (see Table 4). There is then an apparent discrepancy in sources 53, 60, 74, 19, and 55 (our nomenclature) in the sense that Felli et al. (1993a) find them to be constant while we find them to be variable. However, a revision of Table 2 shows that the five latter sources have relatively smooth variation over the several years covered by our study. We then tentatively conclude that these sources are slowly variable, on a timescale of years, and thus could not become evident in the Felli et al. (1993a) study that had a duration of seven months.
Felli et al. (1993a) also firmly classify another 13 objects as nonthermal, variable, stellar emitters: their sources 4, 9, 10, 12, 13, 15, 23, 25, A, C, F, G, H (corresponding to our sources 64, 45, 43, 41, 40, 49, 47, 38, 6, 14, 76, 73, and 18, respectively). We find that 8 out of these 13 sources are indeed variable. Again, there is an apparent discrepancy in sources 64, 45, 43, 40, and 38 (our nomenclature) in the sense that Felli et al. (1993a) find them to be variable while we find them to be constant. We speculate that these sources are a combination of thermal, constant emission with a nonthermal variable contribution that during our observations was either off or had constant flux density.
Source 55 (source K in the nomenclature of Felli et al. 1993a) has been rising steadily in flux density between 1994 and 1997. It is also interesting that source 56, located at only 1′′ east of source 55 and first reported here, also shows a monotonic increase in its flux density from 1994 to 1997 (see Table 2 and Figure 2). We speculate that these two sources are being externally photoionized by a source with time variable ionizing flux or that the increase in radio flux density of source 55 is producing an increase in the ionization of source 56. In Figure 2 it can be seen that source 56 is bow-shaped and roughly points to the Trapezium region, confirming the proplyd identification given by Bally et al. (1998).
3.5 Circular Polarization
Only one of the sources, number 6, showed clear evidence of circular polarization at levels of 10, 5, 10, and 4 percent for 1994, 1995, 1996, and 1997, respectively. We use here the convention that left-handed circular polarization is given as negative, while right-handed circular polarization is given as positive.
4 COMMENTS ON SELECTED INDIVIDUAL SOURCES
In this section we briefly discuss sources that presented interesting characteristics that have not been presented in the rest of the paper.
4.1 Source 1
This relatively bright source has no reported counterpart in the literature. Given its flux density of 3 mJy, the probability of it being an extragalactic source in the region of considered is only 0.01, suggesting it is associated with Orion but it has been missed in previous studies given its relatively large displacement from the center of the cluster.
4.2 Source 6 = GMR A
This bright and time-variable radio source was discussed in detail by Garay et al. (1987) and Felli et al. (1993a) and is known as GMR A. It has near-IR and X-ray counterparts but no known visible counterpart (Felli et al. 1993a). Recently, it presented a spectacular flare at millimeter and X-ray wavelengths (Bower et al. 2003; Nakanishi et al. 2003; Getman et al. 2003). Our centimeter data shows that the source presented a large increase, of about 30 (from 1.31 to 56.6 mJy), between 1996 and 1997. As noted before, this source shows large percentages of circular polarization that combined with its large variability indicates that the emission has a gyrosynchrotron nature.
4.3 Source 47
This source was detected by us only in 1996 at the faint level of 0.85 mJy. However, it is source 23 in Felli et al. (1993a), where it was found to exceed 20 mJy at 6 cm in August of 1990. It seems to be then a highly variable source.
4.4 Source 54
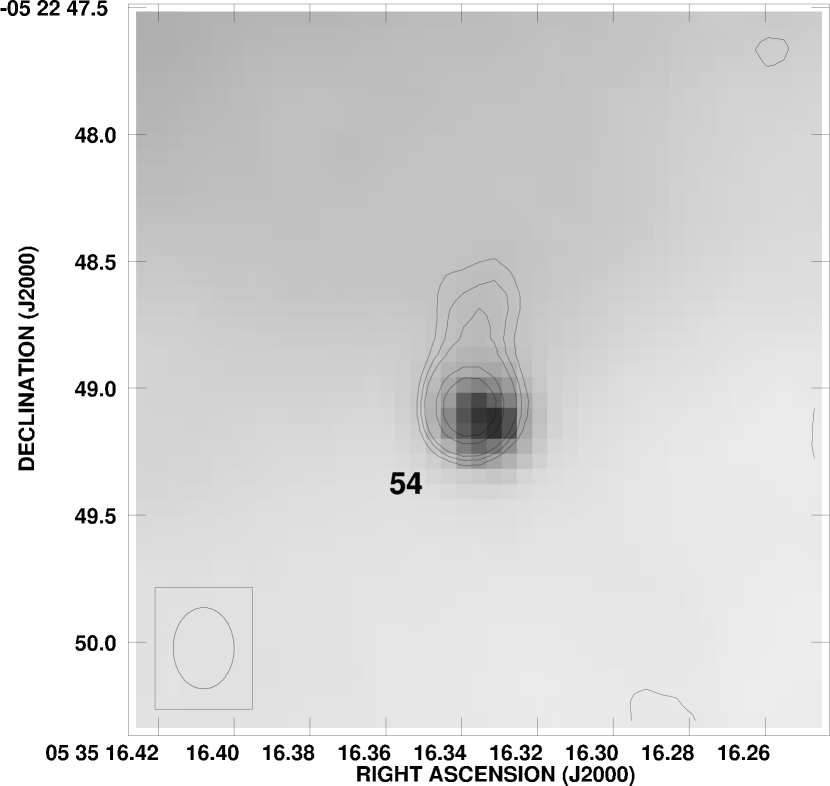
We did not find a reported counterpart for this radio source in the literature. However, in Figure 1 we can see that there is an optical object associated with it. The radio morphology of the source (see Fig. 3) suggests it is a proplyd, with its tail pointing to the north, away from the Trapezium.
5 PROPLYDS
Using the table of proplyds of O’Dell & Wen (1994), we find that 26 of the centimeter sources (numbers 20, 23, 28, 30, 34, 37, 40, 41, 42, 43, 44, 45, 47, 48, 52, 53, 58, 59, 60, 61, 62, 64, 65, 66, 68, and 72) are coincident with objects identified as proplyds. In the region shown in Figure 1, O’Dell & Wen (1994) report a total of 33 proplyds, of which we detect 26 of them. The nature of the 7 ”optical” proplyds without a radio counterpart (objects 139320, 144334, 163322, 168309, 168326N, 171315, and 191350 in O’Dell & Wen [1994]) is unclear.
As expected from the externally ionized nature of the proplyds, these sources show no or modest (less than a factor of two) time variability with the exception of sources 30, 41, 44, 47, and 68. Source 30 corresponds to the proplyd 154324 of O’Dell & Wen (1994), who identify it as a semistellar, circularly symmetric proplyd with a star associated. We believe that the radio variability could be explained if the emission is coming mostly from the magnetosphere of the associated star. Source 41 corresponds to the proplyd 158314 of O’Dell & Wen (1994), with an unclear morphology due to saturation and associated with an IR star. The radio and optical positions are coincident within a few tenths of arcsec with the Trapezium O7 star Ori A (=V1016 Ori = HD 37020). This star is well known to be very variable in the radio (Felli et al. 1991; 1993a). We then attribute the bright, time-variable radio emission not to a possibly associated proplyd but to emission associated with the star Ori A. Source 68 corresponds to the proplyd 173341 of O’Dell & Wen (1994), with a semistellar size and elongated morphology with diffuse boundary. Again, the time variable radio emission could be coming from an active magnetosphere. We have no explanation for the variability observed in sources 44 and 47.
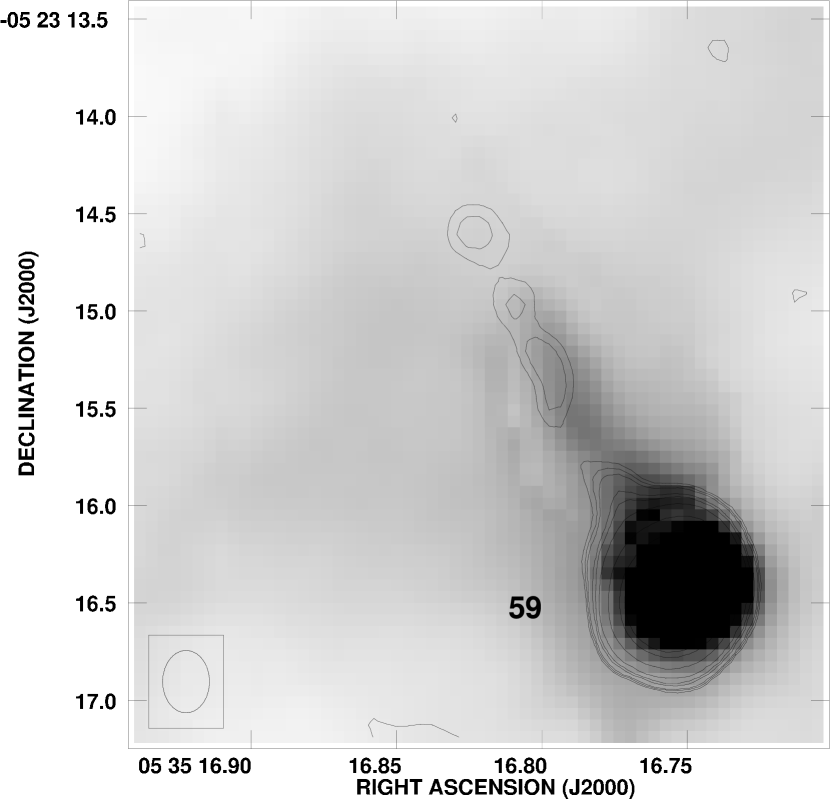
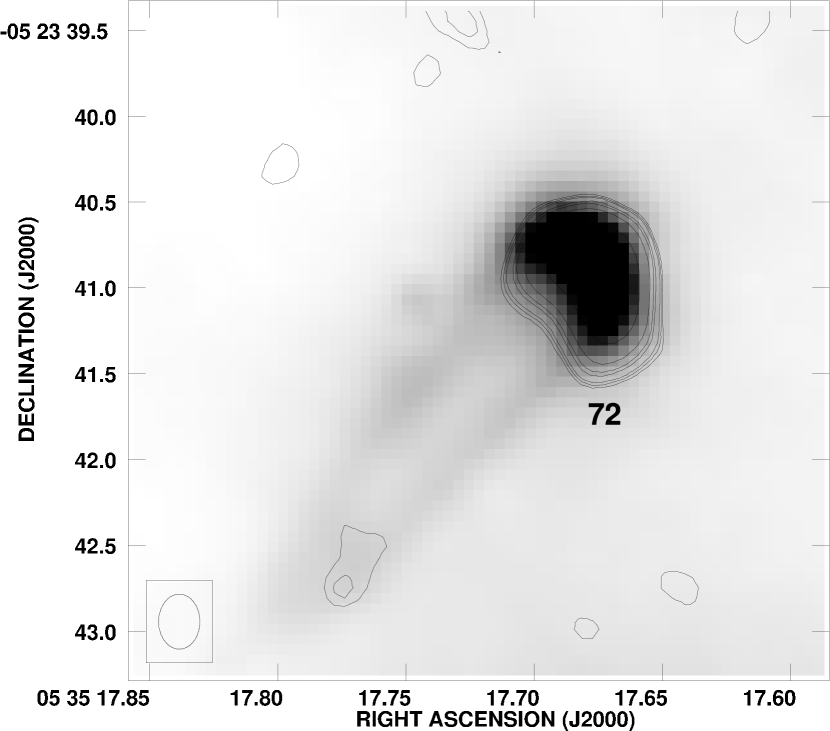
The morphology seen in the optical for the proplyds is also evident in the radio image. In Figs. 4 and 5 we show two of the brightest proplyds: source 59 (corresponding to proplyd 167317 of O’Dell & Wen 1994; see Henney et al. 2002 for a high angular resolution MERLIN 6 cm image) and source 72 (corresponding to proplyd 177341 of O’Dell & Wen 1994). The first object shows a thin tail, while the second shows a wide tail. From hydrodynamical considerations, Dyson, Hartquist, & Biro (1993) and Falle et al. (2002) attribute this difference in morphology to the speed of the wind impacting on the proplyds. If the wind is supersonic, the tail occupies a sizable opening angle, while if the wind is subsonic (presumably due to mass loading in the trajectory between the star and the proplyd), the tail is thin. Cantó et al. (1998) have included the effects of the shadowing of photoionizing radiation by the proplyds, concluding that the appearance of the tails is also influenced by whether or not the shadowed region is optically thick to the scattered Lyman continuum radiation emanating from recombinations of H II within the surrounding nebula. This model was used by O’Dell (2000) to explain his Orion observations.
We finally note that sources 32, 56, 63, and 69 in the northeastern part of Figure 1 have a bow-shaped morphology pointing roughly to the Trapezium region. Indeed, all four sources are identified by Bally et al. (1998) as proplyds. An image of source 56 is shown in Fig. 2, while source 63 is shown in Fig. 6.
6 SOURCES IN OMC-1S
A region in Orion that has received considerable attention in recent years is OMC-1S. Located about 1′ to the SW of the Trapezium, it is about one-tenth as bright as the BN-KL region in the 1.3 mm thermal radiation of dust (Mezger, Zylka, & Wink 1990). Remarkably, several optical outflows (HH 202, HH 269, HH 529, HH 203, HH 204, and possibly HH 528) seem to emanate from a region only a few arcseconds across. O’Dell & Doi (2003) refer to this region as the Optical Outflow Source (OOS), that they locate at . The best candidate for the source of this remarkable outflow activity is the heavily embedded object TPSC-1 (Lada et al. 2000), which is seen only in the near-infrared L (=3.5 m) band.
Within of the OOS there are reported two centers of CO outflows. A high velocity molecular outflow of about 100 km s-1 expels material to the NW (blueshifted) and SE (redshifted) (Rodríguez-Franco et al. 1999), and the blueshifted lobe is associated with the HH 625 optical flow. The center of this high velocity CO outflow is located at . A more extended, low-velocity (5 km s-1) bipolar molecular outflow is oriented NE (blueshifted)-SW (redshifted) (Schmid-Burgk et al. 1990). The center of this CO outflow seems to coincide with the 1.3 mm continuum source FIR4 (Mezger et al. 1990), located at .
In particular, no centimeter sources have been reported in association with any of these three centers of outflow activity. Our deep 3.6 cm image of Orion reveals the presence of two faint sources (13 and 15) located near (at and , respectively) of the OOS, but not exactly coincident with it (see Fig. 7). We also detect for the first time a cm source (source 10, see Fig. 8) that is coincident within the millimeter positional error () with FIR4, the presumed exciting source of the low-velocity CO outflow. Since we only have flux densities for these sources at one wavelength (3.6 cm), we cannot advance significantly in the interpretation of their nature.
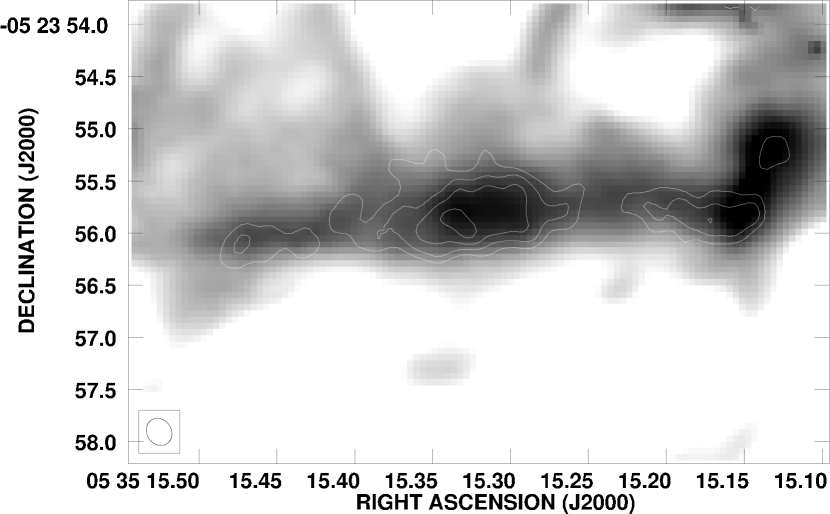
7 A FILAMENTARY RADIO STRUCTURE NEAR OMC-1S
Of the four data sets used, only the 1995 observations were made with short spacings that could allow the proper imaging of extended () structures. An image made with this data set alone shows the presence of an elongated structure near OMC-1S (see Fig. 9). The radio morphology of this source is suggestive of a radio jet, however it could be as well a sharp ionization front. The optical image (see Fig. 9) favors the latter interpretation since there is practically no emission on the southern side of the structure (presumably the neutral region), while there is extended emission to the north. The filament appears to be part of a larger, spur-like structure, as seen in the 2 cm, C-configuration VLA image of Felli et al. (1993b; see their Fig. 6). The total 3.6 cm flux density of this structure inside a region of is 20 mJy. We have used a calibrated H image of Orion (O’Dell & Doi 1999; O’Dell, Peimbert, & Peimbert 2003) to derive that the H flux inside the same region, after correcting for the extended background, is ergs cm-2 s-1. The extinction correction at this position is = 0.58 (O’Dell et al. 2003), which implies an extinction-corrected flux of ergs cm-2 s-1. Assuming that the emission originates in ionized hydrogen with an electron temperature of 104 K that is optically thin in the radio, and following Caplan & Deharveng (1986) we find that the H flux implies a 3.6 cm flux density of 45 mJy, about a factor of 2 higher than the value measured by us. This discrepancy could be due to an overestimation of the extinction correction, to the radio emission being optically-thick, or to the gas being unusually cold (3000 K). A similar discrepancy has been found in the comparison of radio and optical data of some Herbig-Haro objects (Pravdo et al. 1985; Anglada et al. 1992). None of the explanations seems attractive. The extinction is smoothly changing in this region and our estimate should be adequate. The peak temperature brightness of the filament is modest, 150 K, suggesting that we are observing optically-thin free-free emission. We also considered the contrast-decrease effect caused by the ambient H II region (Pastor, Cantó, & Rodríguez 1991; Henney, García-Díaz, & Kurtz 2001), but the average free-free opacity of Orion at 3.6 cm is 0.1 and this effect is too small to explain the discrepancy.
8 CONCLUSIONS
We have presented the analysis of sensitive, high angular resolution () VLA observations at 3.6 cm toward the Orion region of recent star formation. Our main two conclusions are summarized below:
1) In a region of around the Orion Trapezium we detect a total of 77 compact 3.6 cm sources, of which 39 are new centimeter detections. We briefly discuss the characteristics of these sources and of their counterparts at other bands.
2) In the OMC-1S region we detect three faint sources that may be related to the sources that power the multiple outflows that emanate from this region.
References
- (1) Ali, B. & Depoy, D. L. 1995, AJ, 109, 709
- (2) Anglada, G., Rodríguez, L. F., Cantó, J., Estalella, R., & Torrelles, J. M. 1992, ApJ, 395, 494
- (3) Bally, J., Sutherland, R. S., Devine, D., & Johnstone, D. 1998, AJ, 116, 293
- (4) Bally, J., O’Dell, C. R., & McCaughrean, M. J. 2000, AJ, 119, 2919
- (5) Beckwith, S., Persson, S. E., Neugebauer, G., & Becklin, E. E. 1978, ApJ, 223L, 41B.
- (6) Bower, G. C., Plambeck, R., & Bolatto A. 2003, IAUC 8055.
- (7) Cantó, J., Raga, A. C., Steffen, W., & Shapiro, P. 1998, ApJ, 502, 695
- (8) Caplan, J. & Deharveng, L. 1986, A&A, 155, 297
- (9) Carpenter, J. M., Hillenbrand, L. A., & Skrutskie, M. F., 2001, AJ, 121, 3160
- (10) Churchwell, E., Wood, D. O. S., Felli, M., & Massi, M. 1987, ApJ, 321, 516
- (11) Dougados, C., Léna, P., Ridgway, S. T., Christou, J. C., & Probst, R. G. 1993, ApJ, 406, 112
- (12) Dyson, J. E., Hartquist, T. W., & Biro, S. 1993, MNRAS, 261, 430
- (13) Falle, S. A. E. G., Coker, R. F., Pittard, J. M., Dyson, J. E., & Hartquist, T. W. 2002, MNRAS, 329, 670
- (14) Feigelson, E. D. & Montmerle, T. 1999, ARAA, 37, 363.
- (15) Feigelson, E. D., Broos, P., Gaffney, J. A., Garmire, G., Hillenbrand, L. A., Pravdo, S. H., Townsley, L., & Tsuboi, Y. 2002, ApJ, 574, 258
- (16) Felli, M., Massi, M. & Catarzi, M. 1991, A&A, 248, 453.
- (17) Felli, M., Taylor, G. B., Catarzi, M., Churchwell, E., & Kurtz, S. 1993a, A&A, 101, 127
- (18) Felli, M., Churchwell, E., Wilson, T. L., & Taylor, G. B. 1993b, A&AS, 98, 137
- (19) Fomalont, E. B., Kellermann, K. I., Partridge, R. B., Windhorst, R. A., & Richards, E. A. 2002, AJ, 123, 2402
- (20) Garay, G. 1987, RevMexA&A, 14, 489
- (21) Garay, G. 1989, Lecture Notes in Physics, 350, 333
- (22) Garay, G., Moran, J. M., & Reid, M. J. 1987, ApJ, 314, 535.
- (23) Garmire, G., Feigelson, E. D., Broos, P., Hillenbrand, L. A., Pravdo, S. H., Townsley, L., & Tsuboi, Y. 2000, AJ, 120. 1426
- (24) Gaume, R. A., Wilson, T. L., Vrba, F. J., Johnston, K. J., & Schmid-Burgk J. 1998, ApJ, 493, 940.
- (25) Getman, K. V., Feigelson, E.D., Garmire, G., Murray, S. S., & Harnden, F. R. 2003, IAUC 8068.
- (26) Henney, W. J. & Arthur, S. J. 1998, AJ, 116, 322.
- (27) Henney, W. J., García-Díaz, M. T., & Kurtz, S. E. 2001, RevMexA&ASC, 10, 213
- (28) Henney, W. J., O’Dell, C. R., Meaburn, J., Garrington, S. T., & López, J. A. 2002, ApJ, 566, 315
- (29) Hillenbrand, L. A. 1997, AJ, 113, 1733
- (30) Hillenbrand, L. A. & Carpenter, J. M. 2000, ApJ, 540, 236
- (31) Hyland, A.R., Allen D.A., Barnes P.J., Ward M.J. 1984, MNRAS, 206, 465
- (32) Keene, J., Hildebrand, R. H., & Whitcomb, S. E. 1982, ApJ, 252, L11
- (33) Lada, C. J., Muench, A. A., Haisch, K. E. Jr., Lada, E. A., Alves, J. F., Tollestrup, E. V.& Willier, S. P. 2000, AJ, 120,3162.
- (34) Laques P. & Vidal, 1979, A&A, 73, 97.
- (35) Luhman, K. L., Rieke, G. H., Young, Erick T., Cotera, A. S., Chen, H., Rieke, M. J., Schneider, G., & Thompson, R. I. 2000, ApJ, 540, 1016
- (36) Mezger, P. G., Zylka, R., & Wink, J. 1990, A&A, 228, 95.
- (37) Mundy, L. G., Looney, L. W., & Lada, E. A. 1995, ApJ, 452, L137
- (38) Nakanishi, K., Saito, M., Furuya, R.S., Shinnaga, H. & Momose, M. 2003, IAUC 8060.
- (39) O’Dell, C. R., Wen, Z., & Hu, X., 1993, ApJ, 410, 696.
- (40) O’Dell, C. R., & Wen, Z. 1994, ApJ, 436, 194.
- (41) O’Dell, C. R., & Wong, K., 1996, AJ, 111, 846.
- (42) O’Dell, C. R., & Doi, T. 1999, PASP, 111, 1316
- (43) O’Dell, C. R. 2000, AJ, 119, 2311
- (44) O’Dell, C. R. 2001, ARA&A, 39, 99.
- (45) O’Dell, C. R., & Doi, T. 2003, AJ, 125, 277.
- (46) O’Dell, C. R., Peimbert, M., & Peimbert, A. 2003, AJ, 125, 2590
- (47) Pastor, J., Cantó, J., & Rodríguez, L. F. 1991, A&A, 246, 551
- (48) Pravdo, S. H., Rodríguez, L.F., Curiel, S., Cantó, J., Torrelles, J. M., Becker, R. H., & Sellgren, K. 1995, ApJ, 293, L35
- (49) Rodríguez-Franco, A., Martín-Pintado J. & Wilson, T. L., 1999, A&A, 351, 1103.
- (50) Rodríguez, L.F., Gómez, Y. & Reipurth B. 2003, ApJ, 598, 1100
- (51) Schmid-Burgk, J., Güsten, R., Mauersberger, R., Schulz, A., & Wilson, T. L. 1990, ApJ, 362, L25
- (52) Schulz, N. S., Canizares, C., Huenemoerder, D., Kastner, J. H., Taylor, S. C., Bergstroem, E. J. 2001, ApJ, 549, 441.
- (53) Simon, M., Close, L. M., Beck, T. L. 1999, AJ, 117, 1375
- (54) Tsunemi, H., Mori, K., Miyata, E., Baluta C., Burrows, D. N., Garmire, G.P., Chartas, G., 2001, ApJ, 554, 496.
- (55) Wen, Z. & O’Dell , C. R. 1995, ApJ, 438, 784


| Phase Center | Phase | Bootstrapped Flux | rms noise | Number of | ||
|---|---|---|---|---|---|---|
| Epoch | (J2000) | (J2000) | Calibrator | Density (Jy) | (mJy) | Antennas |
| 1994 | 05 35 14.479 | -05 22 30.57 | 0501-019 | 2.460.02 | 0.04 | 18 |
| 1995 | 05 35 16.019 | -05 22 59.57 | 0541-056 | 0.920.03 | 0.08 | 26 |
| 1996 | 05 35 14.479 | -05 22 30.57 | 0501-019 | 1.550.01 | 0.05 | 14 |
| 1997 | 05 35 14.479 | -05 22 30.57 | 0501-019 | 1.540.01 | 0.08 | 14 |
| Flux Densitya | |||||||
|---|---|---|---|---|---|---|---|
| Source | GMRb | 1994 | 1995 | 1996 | 1997 | ||
| 1 | 05 35 04.855 | -05 23 02.65 | 2.90 0.06 | 2.96 0.07 | 2.78 0.07 | 2.70 0.08 | |
| 2 | 05 35 09.764 | -05 21 28.22 | 1.51 0.04 | 0.3 | 0.10.03 | 0.1 | |
| 6 | A | 05 35 11.800 | -05 21 49.20 | 7.68 0.2 | 1.78 0.06 | 1.31 0.03 | 56.6 0.05 |
| 7 | 05 35 12.980 | -05 23 54.95 | 0.30 0.05 | 0.3 | 1.08 0.06 | 0.96 0.07 | |
| 9 | Q | 05 35 13.208 | -05 22 54.78 | 0.79 0.05 | 0.3 | 0.48 0.03 | 0.17 0.03 |
| 12 | B | 05 35 14.115 | -05 22 22.85 | 3.73 0.04 | 3.36 0.3 | 3.43 0.1 | 3.90 0.07 |
| 14 | C | 05 35 14.160 | -05 23 01.29 | 5.55 0.07 | 2.57 0.1 | 5.77 0.1 | 5.98 0.1 |
| 16 | 05 35 14.333 | -05 23 17.29 | 0.31 0.05 | 0.57 0.1 | 0.31 0.06 | 0.12 0.04 | |
| 17 | L | 05 35 14.355 | -05 22 32.52 | 0.71 0.05 | 1.07 0.09 | 1.09 0.07 | 1.60 0.07 |
| 18 | H | 05 35 14.499 | -05 22 38.67 | 0.41 0.03 | 0.17 0.05 | 0.77 0.07 | 1.31 0.06 |
| 19 | I | 05 35 14.510 | -05 22 30.53 | 0.43 0.04 | 0.45 0.04 | 0.83 0.07 | 0.87 0.05 |
| 21 | D | 05 35 14.896 | -05 22 25.39 | 0.76 0.04 | 0.52 0.06 | 2.04 0.07 | 0.84 0.05 |
| 26 | 05 35 15.181 | -05 24 03.61 | 0.3 | 1.25 0.2 | 1.74 0.1 | 1.09 0.1 | |
| 30 | 05 35 15.359 | -05 23 24.16 | 0.56 0.05 | 0.70 0.06 | 0.38 0.08 | 0.19 0.05 | |
| 31 | 05 35 15.372 | -05 22 25.39 | 0.12 0.05 | 0.22 0.06 | 0.30 0.08 | 0.14 0.05 | |
| 32 | 05 35 15.385 | -05 22 40.05 | 0.49 0.04 | 0.96 0.05 | 0.97 0.07 | 0.53 0.04 | |
| 33 | 05 35 15.440 | -05 23 45.55 | 3.20 0.1 | 0.29 0.07 | 4.10 0.1 | 4.01 0.1 | |
| 34 | 14 | 05 35 15.525 | -05 23 37.48 | 4.81 0.1 | 5.81 0.1 | 6.19 0.2 | 5.84 0.02 |
| 35 | 05 35 15.632 | -05 23 31.51 | 0.3 | 0.20 0.05 | 0.3 | 0.97 0.02 | |
| 37 | 26 | 05 35 15.730 | -05 23 22.52 | 1.47 0.06 | 1.48 0.04 | 1.40 0.09 | 1.42 0.07 |
| 38 | 25 | 05 35 15.773 | -05 23 09.92 | 4.14 0.06 | 5.29 0.05 | 5.52 0.1 | 4.89 0.07 |
| 40 | 13 | 05 35 15.798 | -05 23 26.61 | 9.45 0.1 | 9.68 0.1 | 10.0 0.1 | 8.73 0.04 |
| 41 | 12 | 05 35 15.824 | -05 23 14.15 | 5.64 0.07 | 9.57 0.09 | 9.53 0.1 | 23.6 0.09 |
| 42 | 11 | 05 35 15.840 | -05 23 22.51 | 10.6 0.09 | 10.8 0.1 | 11.0 0.1 | 10.9 0.1 |
| 43 | 10 | 05 35 15.851 | -05 23 25.54 | 3.69 0.09 | 4.56 0.1 | 3.70 0.1 | 4.25 0.1 |
| 44 | 24 | 05 35 15.902 | -05 23 38.01 | 0.71 0.05 | 1.80 0.1 | 1.23 0.1 | 1.59 0.09 |
| 45 | 9 | 05 35 15.951 | -05 23 49.82 | 5.50 0.1 | 6.85 0.2 | 5.99 0.1 | 5.78 0.1 |
| 46 | 05 35 16.001 | -05 23 53.00 | 0.98 0.1 | 1.96 0.1 | 1.09 0.1 | 2.78 0.1 | |
| 47 | 23 | 05 35 16.039 | -05 23 53.12 | 0.2 | 0.3 | 0.85 0.1 | 0.28 |
| 48 | 8 | 05 35 16.068 | -05 23 24.35 | 4.69 0.07 | 4.68 0.1 | 4.26 0.1 | 4.03 0.09 |
| 49 | 15 | 05 35 16.073 | -05 23 07.12 | 3.91 0.08 | 4.34 0.1 | 3.64 0.1 | 5.51 0.09 |
| 50 | 22 | 05 35 16.078 | -05 23 27.86 | 1.23 0.09 | 1.98 0.1 | 2.18 0.1 | 3.16 0.1 |
| 52 | 7 | 05 35 16.290 | -05 23 16.62 | 9.60 0.08 | 9.17 0.1 | 10.7 0.1 | 11.0 0.1 |
| 53 | 16 | 05 35 16.329 | -05 23 22.66 | 2.63 0.06 | 2.96 0.1 | 3.38 0.1 | 3.58 0.09 |
| 54 | 05 35 16.339 | -05 22 49.10 | 0.64 0.03 | 0.56 0.08 | 1.00 0.06 | 1.90 0.01 | |
| 55 | K | 05 35 16.401 | -05 22 35.32 | 1.21 0.05 | 1.85 0.09 | 2.47 0.08 | 4.19 0.08 |
| 56 | 05 35 16.488 | -05 22 35.42 | 0.28 0.09 | 0.29 0.08 | 0.82 0.1 | 1.21 0.1 | |
| 57 | 05 35 16.594 | -05 22 50.30 | 0.18 0.09 | 0.36 0.08 | 0.54 0.09 | 0.53 0.09 | |
| 58 | 21 | 05 35 16.620 | -05 23 16.07 | 1.76 0.07 | 1.58 0.07 | 1.59 0.1 | 1.38 0.01 |
| 59 | 6 | 05 35 16.753 | -05 23 16.47 | 22.0 0.09 | 22.2 0.1 | 22.7 0.1 | 22.0 0.1 |
| 60 | 17 | 05 35 16.770 | -05 23 28.06 | 2.62 0.06 | 3.38 0.08 | 2.97 0.4 | 3.52 0.1 |
| 61 | 5 | 05 35 16.849 | -05 23 26.26 | 16.1 0.09 | 15.6 0.1 | 16.1 0.1 | 15.7 0.1 |
| 63 | E | 05 35 16.971 | -05 22 48.70 | 1.55 0.07 | 2.48 0.1 | 1.78 0.3 | 2.46 0.4 |
| 64 | 4 | 05 35 16.981 | -05 23 37.01 | 8.16 0.07 | 7.81 0.1 | 7.08 0.8 | 7.56 0.1 |
| 65 | 3 | 05 35 17.068 | -05 23 34.09 | 3.57 0.07 | 3.87 0.1 | 3.81 0.7 | 4.01 0.07 |
| 68 | 05 35 17.331 | -05 23 41.42 | 0.63 0.1 | 0.75 0.04 | 1.30 0.1 | 1.40 0.1 | |
| 69 | L | 05 35 17.350 | -05 22 35.92 | 1.67 0.07 | 2.45 0.1 | 1.74 0.1 | 2.24 0.07 |
| 71 | 2 | 05 35 17.562 | -05 23 24.89 | 3.60 0.07 | 4.44 0.1 | 3.86 0.1 | 4.32 0.07 |
| 72 | 1 | 05 35 17.674 | -05 23 40.97 | 9.63 0.1 | 8.11 0.1 | 7.43 0.1 | 9.63 0.1 |
| 73 | G | 05 35 17.951 | -05 22 45.50 | 4.48 0.07 | 0.58 0.1 | 0.77 0.06 | 4.10 0.1 |
| 74 | 19 | 05 35 18.047 | -05 23 30.77 | 3.50 0.08 | 2.93 0.09 | 3.92 0.08 | 4.25 0.1 |
| 75 | 05 35 18.241 | -05 23 15.62 | 0.2 | 0.33 0.07 | 0.43 0.04 | 0.53 0.1 | |
| 76 | F | 05 35 18.373 | -05 22 37.44 | 18.0 0.07 | 12.21 0.05 | 9.44 0.1 | 20.5 0.07 |
| 77 | V | 05 35 21.058 | -05 23 49.10 | 2.93 0.08 | 0.38 0.06 | 4.28 0.1 | 3.66 0.07 |
Note. — (a): Total flux density corrected for primary beam response The uncertainty in the flux densities was determined from measurements of a region free of sources near each source.
(b): GMR referes to the centimeter sources detected by Garay, Moran, & Reid (1987), Garay (1987), Churchwell et al. (1987), Garay (1989), and Felli et al. (1993a; 1993b).
| Source | Flux Density | ||
|---|---|---|---|
| 3 | 05 35 10.481 | -05 22 45.69 | 0.160.02 |
| 4 | 05 35 10.734 | -05 23 44.71 | 0.300.02 |
| 5 | 05 35 11.733 | -05 23 51.71 | 0.240.02 |
| 8 | 05 35 13.113 | -05 22 47.20 | 0.110.02 |
| 10 | 05 35 13.409 | -05 24 11.21 | 0.330.03 |
| 11 | 05 35 14.026 | -05 22 23.39 | 0.290.03 |
| 13 | 05 35 14.136 | -05 23 56.77 | 0.320.04 |
| 15 | 05 35 14.283 | -05 23 53.05 | 0.300.03 |
| 20 | 05 35 14.730 | -05 23 23.01 | 0.290.04 |
| 22 | 05 35 14.808 | -05 23 04.78 | 0.330.03 |
| 23 | 05 35 14.932 | -05 23 29.08 | 0.320.04 |
| 24 | 05 35 15.075 | -05 23 52.96 | 0.260.05 |
| 25 | 05 35 15.154 | -05 23 53.63 | 0.310.05 |
| 27 | 05 35 15.195 | -05 23 32.55 | 0.300.05 |
| 28 | 05 35 15.213 | -05 23 18.82 | 0.340.04 |
| 29 | 05 35 15.262 | -05 22 56.86 | 0.240.03 |
| 36 | 05 35 15.635 | -05 23 10.41 | 0.370.05 |
| 39 | 05 35 15.789 | -05 23 23.96 | 0.280.04 |
| 51 | 05 35 16.096 | -05 23 23.05 | 0.300.04 |
| 62 | 05 35 16.891 | -05 23 38.05 | 0.380.04 |
| 66 | 05 35 17.069 | -05 23 39.72 | 0.320.06 |
| 67 | 05 35 17.211 | -05 23 26.73 | 0.280.04 |
| 70 | 05 35 17.467 | -05 23 21.11 | 0.320.04 |
| Counterparta | ||||||
|---|---|---|---|---|---|---|
| Position-based | Time | near-IR | visible | X-rays | ||
| Source | Namesb | Variable? | (AD95) | (OW94) | (F02) | other |
| 1 | 049-303 | N | – | – | – | – |
| 2 | 098-128 | Y | – | 98-128 | 244 | [HC00] 621;[H97b] 336 |
| 3 | 105-246 | – | – | – | 262 | – |
| 4 | 107-345 | – | – | – | 270 | – |
| 5 | 117-352 | – | – | 117-352 | – | – |
| 6 | 118-149 | Y | 3108 | – | 297 | – |
| 7 | 130-355 | Y | – | – | 337 | – |
| 8 | 131-247 | – | – | 131-247 | – | [HC00] 707;[H97b] 9031 |
| 9 | 132-255 | Y | 2717 | – | 351 | – |
| 10 | 134-411 | – | – | – | –. | [GWV98] |
| 11 | 140-223 | – | – | – | – | – |
| 12 | 141-223 | N | – | – | 399 | [CHS01] 8470;[LRY00] 44 |
| 13 | 141-357 | – | – | – | – | [GWV98] |
| 14 | 142-301 | Y | – | – | – | [SCB99] 23 |
| 15 | 143-353 | – | – | – | – | – |
| 16 | 143-317 | Y | – | – | 406 | – |
| 17 | 144-233 | Y | – | – | 407 | [SCB99] 32;[LRY00] 50 |
| 18 | 145-239 | Y | – | – | 416 | – |
| 19 | 145-231 | Y | – | – | – | [D93] IRc2 A;[GWV98] |
| 20 | 147-323 | – | – | 147-323 | 432 | [H97b] 451;[HC00] 302 |
| 21 | 149-225 | Y | – | – | 442 | [H97b] 472b |
| 22 | 148-305 | – | – | 148-305 | – | [H97b] 9073 |
| 23 | 149-329 | – | – | 149-329 | 445 | – |
| 24 | 151-353 | – | – | – | – | – |
| 25 | 152-354 | – | – | – | – | – |
| 26 | 152-404 | Y | – | – | – | – |
| 27 | 152-333 | – | – | – | – | – |
| 28 | 152-319 | – | 3512 | 152-319 | 459 | [HC00] 318 |
| 29 | 153-257 | – | 3257 | – | 461 | – |
| 30 | 154-324 | Y | – | 154-324 | – | [BSD98] 19 |
| 31 | 154-225 | N | – | 154-225 | 465 | [H97b] 9096;[HC00] 475;[SCB99] 74 |
| 32 | 154-240 | Y | – | – | – | [LRY00] 103 |
| 33 | 154-346 | Y | – | 154-346 | 474 | [HB97b] 475;[MLL95] J053515-052346 |
| 34 | 155-337 | Y | 3143 | 155-338 | – | [BSD98] 23 |
| 35 | 156-332 | Y | – | – | – | – |
| 36 | 156-310 | – | – | – | – | EQ J053515-052311 |
| 37 | 157-323 | N | 3253 | 157-323 | – | [BSD98] 14 |
| 38 | 158-310 | N | – | 158-310 | 495 | [HC00] 342;[SCB99] 100 |
| 39 | 158-324 | – | 3254 | – | – | – |
| 40 | 158-327 | N | – | 158-327 | – | [BSD98] 13;[HC00] 287;[H97b] 489 |
| 41 | 158-314 | Y | – | 158-314 | 498 | [HC00] 336;[LRY00] 121 |
| 42 | 158-323 | N | – | 158-323 | 501 | [MLL95] J053515-052322;[H97b] 488a |
| 43 | 158-326 | N | – | 158-326 | – | [BSD98] 12 |
| 44 | 159-338 | Y | – | 159-338 | – | [BSD98] 20;[HC00] 250 |
| 45 | 160-350 | N | – | 159-350 | 508 | [SCB99] 104 |
| 46 | 160-353W | Y | – | – | 513 | [SCB99] 106 |
| 47 | 160-353E | Y | – | 160-353 | – | [H97b] 503; [SCH01] 61 |
| 48 | 161-324 | N | – | 161-324 | – | [HC00] 296 |
| 49 | 161-307 | Y | – | 161-307 | 519 | [H97b] 1863a |
| 50 | 161-328 | Y | – | 161-328 | – | [BSD98] 9;[HC00] 285;[LRY00] 135 |
| 51 | 161-323 | – | – | 161-323 | 517 | [LRY00] 138 |
| 52 | 163-317 | N | – | 163-317 | 529 | [BSD98] 6;[HC00] 322 |
| 53 | 163-323 | Y | – | 163-322 | – | [BSD98] 1;[SCB99] 127 |
| 54 | 163-249 | Y | – | – | – | – |
| 55 | 164-235 | Y | 3518 | – | – | – |
| 56 | 165-235 | Y | – | 165-235 | 543 | [H97b] 519b |
| 57 | 166-250 | Y | – | 166-250 | – | [LRY00] 164 |
| 58 | 166-316 | N | – | 166-316 | 549 | [BSD98] 7 |
| 59 | 168-316 | N | – | 167-317 | 554 | [MLL95] J053516-052316;[HC00] 323 |
| 60 | 168-328 | Y | – | 168-328 | 555 | [HC00] 284;[BSD98] 5 |
| 61 | 168-326 | N | – | 168-326S | – | [MLL95] J053516-052326;[SCB99] 149 |
| 62 | 169-338 | – | – | 169-338 | – | [BSD98] 17 |
| 63 | 170-249 | Y | 3260 | 170-249 | 571 | [BSD98] 31 |
| 64 | 170-337 | N | – | 170-337 | 570 | [H97b] 534 |
| 65 | 171-334 | N | – | 171-334 | 576 | [H97b] 538;[BSD98] 15 |
| 66 | 171-340 | – | 3144 | 171-340 | 574 | – |
| 67 | 172-327 | – | – | 172-327 | – | – |
| 68 | 173-341 | Y | – | 173-341 | – | – |
| 69 | 174-236 | Y | – | 173-236 | – | [H97b] 548;[HC00] 440 |
| 70 | 175-321 | – | – | 175-321 | 596 | [H97b] 9180 |
| 71 | 176-325 | N | 3529 | – | – | – |
| 72 | 177-341 | N | – | 177-341 | – | [H97b] 558;[BSD98] 26; |
| 73 | 180-246 | Y | 3168 | 179-246 | 626 | – |
| 74 | 180-331 | Y | – | 180-331 | – | [H97b] 9211;[BSD98] 25;[LRY00] 234 |
| 75 | 182-316 | Y | – | – | 646 | – |
| 76 | 184-237 | Y | – | 183-238 | 651 | [H97b] 589;[HC00] 436 |
| 77 | 211-349 | Y | 3140 | 210-349 | 760 | [H97b] 669 |
Note. — (a): AD95 = Ali & Depoy 1995 (K-band); BPN78 = Beckwith 1978(K band); BSD98 = Bally et al. 1998 (UV); CHS01 = Carpenter et al. 2001 (K-band); D93 = Dougados et al. (1993) (L-band); EQ = Tsunemi et al. 2001 (X-rays); F02 = Feigelson et al. 2002 (X-rays) GWV98 = Gaume et al. 1998 (water masers); HAB = Hyland et al. 84 (K band); Hb97 = Hillenbrand 1997 (I-band); HC00 = Hillenbrand & Carpenter 2000 (K-band); LRY00 = Luhman et al. 2000 (K-band); MLL95 = Mundy et al. 1995 (radio millimeter); OW94 = O’Dell & Wen 1994 (visible); SCH01 = Schulz et al. 2001 (X-rays); SCB99 = Simon et al. 1999 (K-band).
Note. — (b): After the convention of O’Dell & Wen (1994).