Color-Induced Displacement double stars in SDSS
We report the first successful application of the astrometric color-induced displacement technique (CID, the displacement of the photocenter between different bandpasses due to a varying contribution of differently colored components to the total light), originally proposed by Wielen (1996) for discovering unresolved binary stars. Using the Sloan Digital Sky Survey (SDSS) Data Release 1 with stars brighter than 21m in the and bands, we select 419 candidate binary stars with CID greater than 0.5 arcsec. The SDSS colors of the majority of these candidates are consistent with binary systems including a white dwarf and any main sequence star with spectral type later than K7. The astrometric CID method discussed here is complementary to the photometric selection of binary stars in SDSS discussed by Smolčić et al. (2004), but there is considerable overlap (15%) between the two samples of selected candidates. This overlap testifies both to the physical soundness of both methods, as well as to the astrometric and photometric quality of SDSS data.
1 Introduction
It is believed that 50% of all stars belong to multiple systems (Heintz 1969). Nevertheless, being aware that a specific star is a binary is always useful because either one throws it out of the sample or updates the model to describe it and begins some follow-up observations! Whether one deals with stellar evolution or galactic dynamics, binaries always receive some special considerations. So, it is important to be able to detect the binary nature of a star at an early stage of an investigation by any possible means.
Besides spectroscopy, photometry, and interferometry, astrometry coupled to photometry has lately emerged as a way of revealing the binary nature of a source (Wielen 1996). That method relies upon either a change in the position of the source as its brightness varies (Variability-Induced Movers, VIM) or a photometric-band dependence of the position (Color-Induced Displacement, CID). Whereas VIM requires several observations along the brightness variation cycle and only works when at least one component is variable, it only takes one image in each band to identify a CID and can be done for non-variable stars. Despite the number of multi-band photometric surveys, none so far has carried sufficiently accurate astrometry in at least two distinct bands. This lack of observations has been recently alleviated by the Sloan Digital Sky Survey.
The Sloan Digital Sky Survey (SDSS; York et al. 2000; Abazajian et al. 2003, and references therein) is revolutionizing stellar astronomy by providing homogeneous and deep () photometry in five passbands (, , , , and ; Fukugita et al. 1996; Gunn et al. 1998; Hogg et al. 2001; Smith et al. 2002) accurate to 0.02 mag (Ivezić et al. 2003). Ultimately, up to 10,000 deg2 of sky in the Northern Galactic Cap will be surveyed. The survey sky coverage will result in photometric measurements for over 100 million stars and a similar number of galaxies. Astrometric positions are accurate to better than 0.1 arcsec per coordinate (rms) for point sources with (Pier et al. 2003), and the morphological information from the images allows robust star-galaxy separation to 21.5m (Lupton et al. 2003).
Using the SDSS data, we report on the first successful identification of Color-Induced Displacement (hereafter CID) binaries. The underlying ideas of that method are given in Sect. 2. Sect. 3 describes the simulation that allowed us to optimize the screening of the data described in Sect. 4. In Sect. 5, we present our results and compare them with those of Smolčić et al. (2004), who have recently used color selection to identify a stellar locus made of white dwarf+M dwarf binaries. .
2 Color Induced Displacement
For any unresolved double star and any photometric filter, the position of the photocenter lies between the two components. If the two components have different colors, the position of the photocenter will change with the adopted filter. The color-induced displacement is the change of the position of an unresolved binary depending on the adopted filter (Fig. 1).
Though Wielen (1996) suggested that variability induced motion and color induced motion could reveal the binary nature of an unresolved star, only the first approach has been applied to date, in the framework of Hipparcos (Wielen 1996; ESA 1997; Pourbaix et al. 2003). However, during the preparation of the Tycho-2 catalogue (Høg et al. 2000), Tycho and 2MASS (Skrutskie 1997) positions were compared. Source duplicity came up as a satisfactory explanation for most of the discrepant positions (S. Urban & V. Makarov, priv. comm.).
In the case of SDSS, the position of any object together with its magnitude are measured in five bands (Pier et al. 2003). Even after the chromaticity effects have been accounted for, the five positions of a single star do not superpose exactly owing to measurement error (left panel of Fig. 1). For double stars, and photometric bands will yield the two positions which are the most separated because of the largest central wavelength difference between these two filters (right panel).
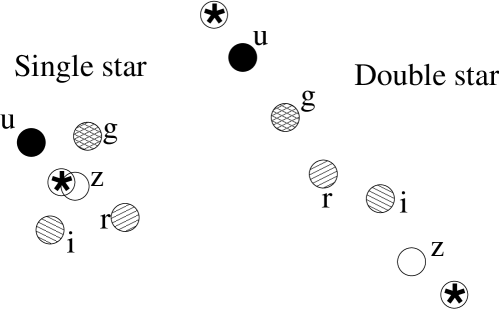
The position of the photocenter follows the peak of the efficiency of the filter. Therefore, the photocenters are not only aligned but also ordered by the filter effective wavelengths. The band therefore plays a central role even if the photocenter does not necessarily lie right at the middle of the and photocenters. Instead of requiring that the -, -, and -photocenters are aligned and well ordered, one can require that the angle measured from the -position between and is 180°.
From now on, we will refer to the angle as the angle measured from the -position between and . The distance between and (noted ) will refer to the angular separation between the position of the photocenter measured in the and band, respectively.
We do not use the - and -positions because the scatter on the - and -photocenter is not significantly smaller than on the and positions, thus leading to a lower signal-to-noise ratio (S/N) as far as is concerned.
3 Simulations
In order to develop expectations for the relevant parameter space, we first carry out some simulations with noise properties consistent with the actual data, to estimate a lower bound of the separation we can expect to notice. According to Pier et al. (2003), the standard deviation on the relative position, i.e. band-to-band, for objects brighter than mag is 31 mas in and 27 mas in but the authors did not quote any correlation between the residuals in those two bands.
A parent population of stars with and and good photometry (see next section for details) was therefore used to update the precision of the residuals and to derive the correlation between them. The residuals in right ascension in and have a standard deviation of respectively 36 and 20 mas, with a correlation of 0.16. In declination, these precisions are 39 and 22 mas for and with a correlation of 0.18.
For the simulation, the origin of the offset is placed at the position in the band and is assumed to lie in the middle of the segment joining the true photocenters in and . The distributions of the angle and separation between the - and -positions are derived from 200 000 model positions generated for both photocenters using the above standard deviations and correlations. Such distributions for separations of 1″, 20 mas and 0 mas are plotted in Fig. 2. The spread in the angle increases as the true separation goes to zero. Using a 99.9% confidence level Kolmogorov-Smirnov test, we reject the hypothesis that the distributions of for single stars and binaries with separations below 10 mas are different. It is worth noting that in the latter case, the correlation between the - and -positions prevents the angles from being uniformly distributed over 0-.

Though the percentage of binaries is usually thought to be quite high (ranging from 85% among OB stars (Heintz 1969) down to 30% for M stars (Marchal et al. 2003) and even 10% for F7-K systems with periods less than 10 years (Halbwachs et al. 2003)), very few binaries actually induce a noticeable shift of the photocenter. While the color induced displacement is larger the more different the colors, too large a magnitude difference causes the fainter component to be undetectable. Thus only a small fraction of true binaries will show detectable CID. Coupled to the spread of the angle due to measurement error, this means that one should not expect a large deviation of the distribution with respect to that of a pure single star population, especially if one looks at the whole SDSS sample.
4 Data
In this study, we use the public SDSS data release 1 (DR1) which contains a few million stars. Because errors are larger towards fainter magnitudes, we selected stars to be bright enough to have good astrometry (), thus reducing the number of stars to . We further impose
-
1.
the condition that the displacement between the - and -positions is larger than 0.2″. This criterion is expressed as:
where the four offset quantities are readily available in the SDSS database;
-
2.
the precision on the magnitudes is better than 0.1 mag in and and better than 0.05 mag for , and .
Because astrometry and photometry are strongly tied together, bad photometry is likely to show up as poor astrometry anyway so these constraints on the photometric precision are actually safeguards for the astrometry as well. These two criteria yield a sample of only 19 982 entries, % of the previous sample.
The angles versus the separations between the - and -photocenters the distribution of the latter are plotted in Fig. 3. With respect to the simulations from Sect. 3, there is a strong excess of points with a large displacement but with a 0 angle. This very striking feature is due to asteroids. Both the displacement and colors of all these 2 180 objects are consistent with the asteroids already identified in SDSS (Ivezić et al. 2002; Jurić et al. 2002). In the case of asteroids, the position of the photocenter changes from to because of the genuine displacement of the object on the sky in between the two exposures. Because of the way the and CCDs are located on the detector (the scanning order is ), the positions in and are on the same side with respect to the -positions, thus yielding a null angle.
In the single star simulation, the distribution of the angle between the and -photocenters shows a continuous decrease towards . However the lower panel of Fig. 3 reveals that, once out of the asteroid region of the distribution, the number of large angles actually increases, which is consistent with the presence of binaries.

Even though the distribution shows an increase from 0.2 rad up to and the simulation indicates that no single star is likely to cause a displacement larger than 0.3″, we conservatively adopt 1.5 rad and 0.5″ for the lower bounds of the angle and separation respectively. This final cut leads to 419 candidate binaries. There is no noticeable clustering of these objects in chip coordinates nor in which rules out the possibility of an instrumental (e.g. corrupted CCD row or column) or observational (e.g. unnoticed bad seeing) problem which would have caused the displacement.
5 Results
5.1 WD+MD bridge
If the components of a binary have different colors, the resulting colors of the system do not all match single star ones. Whereas most combinations of stellar colors remain consistent with the stellar locus, any departure from the latter can be interpreted as the signature of the duplicity of the source. Smolčić et al. (2004) used that color selection to identify a second stellar locus in the SDSS data, namely a bridge in the vs color-color diagram between white and M dwarfs.
Our 419 candidate binaries are displayed in the same color-color diagram in Fig. 4. Although the two techniques are rather orthogonal, our purely astrometric approach reproduces the essence of the color-based results after Smolčić et al. (2004). Such a result was expected since those two groups of stars have the largest color difference but are of similar absolute magnitudes and are therefore the most likely to yield a noticeable displacement between the - and -photocenters. Only 61 objects match the criteria of brightness and colors imposed by Smolčić et al, i.e. 7% of their bridge stars match our astrometric criteria.
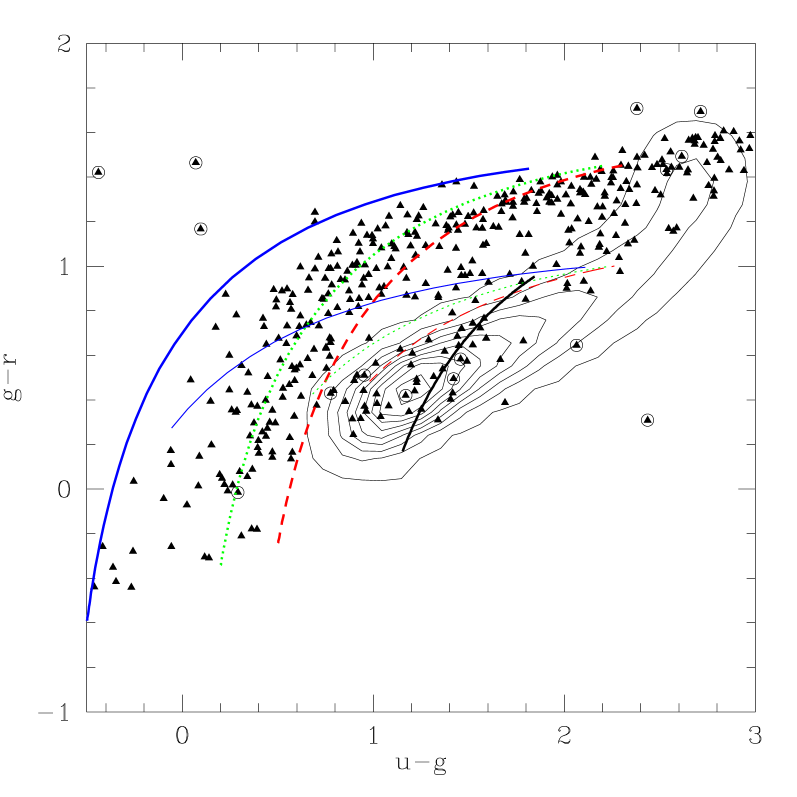
In order to explain the bottom-left part of the diagram, one cannot rely on the assumption of a unique color for all the white dwarfs, especially in and . Following Harris et al. (2003) we instead adopt three different model WDs to cover the range of , yet keeping . The coordinates of the three WDs in the plane are respectively , , . The WD colors adopted by Smolčić et al. (2004) lies between our second and third models. The flux ratio between the white dwarf and the M dwarf is assumed to range between 0.01 and 100.0. The three resulting tracks are plotted as thick lines in Fig. 4.
Since at least one of our extended bridges passes over the quasar region of the diagram, could it be that some of our candidates binaries are actually QSOs? From the of these points (Fig. 5), one can conclude that it is seldom (if ever) the case (according to Richards et al. (2001), QSOs have ). All the questionable points are hence consistent with a white dwarf + M dwarf pair.
5.2 Additional models
Owing to the narrow convergence of the three tracks at the M dwarf end, only 50% of the points are bounded by the previous models. What other combinations of stars would produce system colors consistent with the data? As we have already stated, the colors have to be rather different and yet the magnitudes to be rather similar. Assuming a WD companion, the bluer the main sequence component, the larger the magnitude difference and the more similar the colors.
If the M dwarf is replaced with, say, a K7 main-sequence star (assuming 2.32, 1.01, 0.32, and 0.15 for , , , and respectively based on the list after Gunn & Stryker (1983) convolved with the SDSS filters (Fukugita et al. 1996)), the flux ratio in the band becomes a bit more constrained: . The different tracks leading to the same three model white dwarfs as in Sect. 5.1 are plotted as thin lines in Fig. 4. Because of the flux ratio constraint, these tracks do not go down to the WD region but that part of the diagram is already covered by the WD+MD model anyway.
Almost 90% of the candidate binaries can thus be explained with a model involving a WD and any main-sequence star redder than K7. What about the remaining 10% whose cannot that easily be explained with any of the previous scenarios? Even though several of these points are located around in the diagram, i.e. they are consistent with the peak of the stellar locus and hence with a possible contamination by weird single stars, that region is totally depleted in the diagram (Fig. 5).


Besides the binaries with a WD component, what other systems could exhibit large displacements between the and filters? A A0 main-sequence and a giant K5 have rather similar magnitudes, yet rather different colors (almost as much as the WD+MD pairs). The flux ratio in the band between the two components is constrained to the range 0.63–6.3. For the K5 giant (resp. A0V), we adopt the colors 3.40 (1.01), 1.35 (-0.21), 0.56 (-0.14), and 0.33 (-0.11) for , , , and respectively (Gunn & Stryker 1983; Fukugita et al. 1996). The corresponding track is displayed in both Fig. 4 and 5 (left panel) as a thick line. It is worth noting that this track is consistent with the stellar locus in both diagrams thus confirming that the CID binaries would not all be identified as outliers in a color-color diagram.
Even though 2MASS does not go as faint as SDSS, the overlap between the two surveys (Finlator et al. 2000) is nevertheless large enough to obtain combined color-color diagrams for 241 of our putative double stars (%). Among the combinations of filters, the vs exhibits the largest departure of these binaries from the stellar locus (right panel of Fig. 5). Instead of a bridge as in Fig. 4, the binary locus appears as a narrow horizontal band in th combined 2MASS SDSS diagram. Unlike the SDSS colors, the 2MASS color allows us to rule out the possibility for the M stars to be giant rather than dwarf. Note also that there are still CID binaries whose colors are very consistent with the main stellar locus even when 2MASS bands are used as well.
5.3 Contamination
About 15 stars have weird colors (triangles with a circle around in Figs. 4 and 5), especially in , which is below -0.5 for six of them. In such cases, the noticed displacement would be caused by the wrong astrometric transformation induced by the unusual colors rather than by a true displacement of the photocenter. However spectra available for some of these troublesome points confirm the duplicity. So, in the worst case, the contamination rate does not exceed 3%.
5.4 Angular separation
The likelihood of detecting a CID binary clearly depends on the difference in colors of the components but it also depends on the actual angular separation of the two stars. From the only criterion adopted so far, namely ″, what can we infer about that angular separation? The ratio of to that separation is plotted in the left panel of Fig. 6.
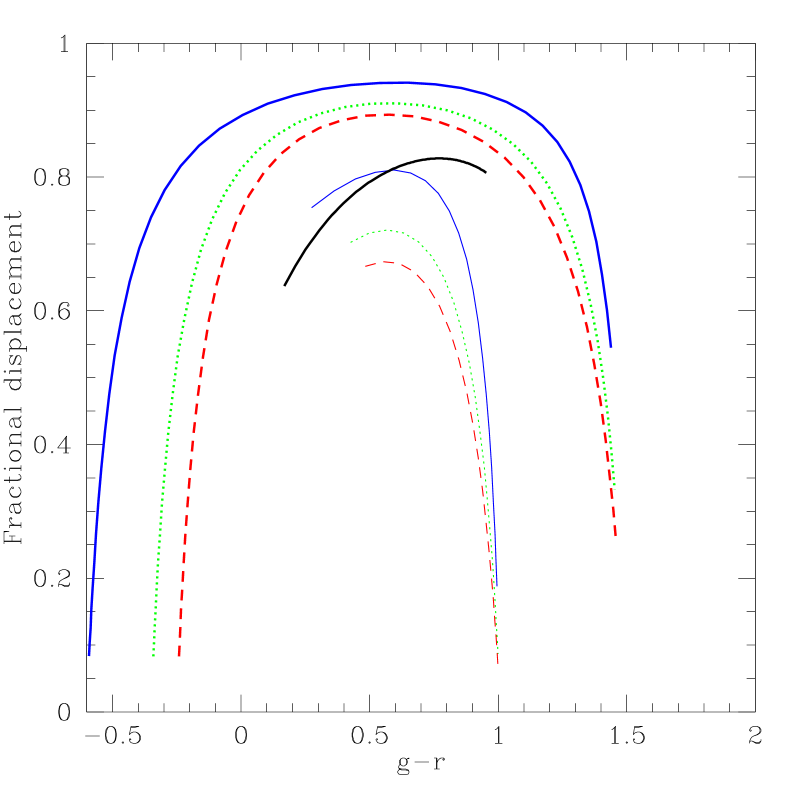
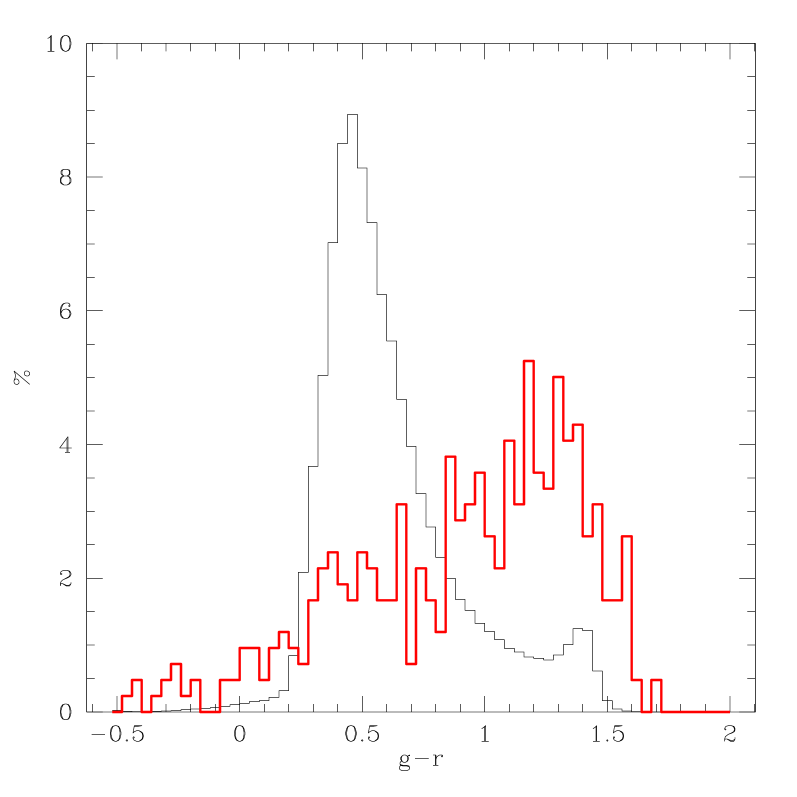

All the white dwarf systems show a maximum displacement above , corresponding to 60%, so any separation larger than 0.85″ fulfills the criterion. That is consistent with the distribution plotted in the central panel of Fig 6. It shows that whereas the parent distribution peaks below , the binary distribution peaks well above that value.
Whereas the fractional displacement starts decreasing above , the binary distribution keeps growing up to where the displacement has already decreased to 70%. This means that the decrease of the fractional displacement is compensated by the actual angular separation of the components. Assuming a constant linear separation, these systems should thus be closer. A color-magnitude diagram (right panel of Fig. 6) gives credit to that explanation. Indeed, the redder, the brighter while the absolute magnitude goes up thus meaning that the reddest objects are on average closer to us.
6 Conclusions
The color induced displacement method described by Wielen (1996) as a way of detecting binaries has been successfully applied to the first public release of the SDSS data. We identify about 400 systems whose changes in position are essentially consistent with a white dwarf coupled to a lower end (later than K7) main-sequence star. We therefore expect CID binaries at the completion of the SDSS observation campaign.
This identification of binaries is an independent confirmation of the color based results of Smolčić et al. (2004). However, whereas they had a lower bound on of 0.3, the astrometric criterion allows us to identify candidate binaries down to . On the other hand, color selection they utilized is more sensitive to binaries with angular separations smaller than the sensitivity of the CID method.
Though the approach has proven to give results, its efficiency is extremely low. Whereas Marchal et al. (2003) quote at least 30% of binaries among M stars (the percentage grows with the mass of the star along the main-sequence), only 0.02% are detected through their CID effect. It is noteworthy that with such a low fraction, the CID binaries do not affect the overall SDSS astrometric precision.
Because of their much better astrometric precision (typically a few as), space-based astrometry missions like SIM and Gaia will eventually supersede the SDSS results presented here. According to a Gaia preparatory study (Arenou & Jordi 2001), the latter could, for instance, detect a M0 companion to a G0 dwarf star at a level at a separation as low as 2.3 mas. In terms of separations, this is times better than the sensitivity of the CID method applied to the SDSS data.
Acknowledgements.
This work is partly supported by NASA grant NAG5-11094 to Princeton University. ZI and GK thanks Princeton University for generous support of their work. Funding for the creation and distribution of the SDSS Archive has been provided by the Alfred P. Sloan Foundation, the Participating Institutions, the National Aeronautics and Space Administration, the National Science Foundation, the U.S. Department of Energy, the Japanese Monbukagakusho, and the Max Planck Society. The SDSS web site is http://www.sdss,org/.References
- Abazajian et al. (2003) Abazajian, K., Adelman-McCarthy, J. K., Agüeros, M. A., et al. 2003, AJ, 126, 2081
- Arenou & Jordi (2001) Arenou, F. & Jordi, C. 2001, Gaia duplicity detection: photocentric binaries, Tech. Rep. GAIA-FA-002, Observatoire de Paris-Meudon, http://wwwhip.obspm.fr/gaia/dms/texts/GAIA_duplicity.pdf
- ESA (1997) ESA. 1997, The Hipparcos and Tycho Catalogues (ESA SP-1200)
- Finlator et al. (2000) Finlator, K., Ivezić, Ž., Fan, X., et al. 2000, AJ, 120, 2615
- Fukugita et al. (1996) Fukugita, M., Ichikawa, T., Gunn, J. E., et al. 1996, AJ, 111, 1748
- Gunn et al. (1998) Gunn, J. E., Carr, M., Rockosi, C., et al. 1998, AJ, 116, 3040
- Gunn & Stryker (1983) Gunn, J. E. & Stryker, L. L. 1983, ApJS, 52, 121
- Halbwachs et al. (2003) Halbwachs, J. L., Mayor, M., Udry, S., & Arenou, F. 2003, A&A, 397, 159
- Harris et al. (2003) Harris, H. C., Liebert, J., Kleinman, S. J., et al. 2003, AJ, 126, 1023
- Heintz (1969) Heintz, W. D. 1969, JRASC, 63, 275
- Høg et al. (2000) Høg, E., Fabricius, C., Makarov, V. V., et al. 2000, A&A, 355, L27
- Hogg et al. (2001) Hogg, D. W., Finkbeiner, D. P., Schlegel, D. J., & Gunn, J. E. 2001, AJ, 122, 2129
- Ivezić et al. (2003) Ivezić, Ž., Lupton, R. H., Anderson, S., & et al. 2003, Mem. Soc. Ast. It., 74, 978
- Ivezić et al. (2002) Ivezić, Ž., Lupton, R. H., Jurić, M., et al. 2002, AJ, 124, 2943
- Jurić et al. (2002) Jurić, M., Ivezić, Ž., Lupton, R. H., et al. 2002, AJ, 124, 1776
- Lupton et al. (2003) Lupton, R. H., Ivezić, v., Gunn, J. E., et al. 2003, Proc. SPIE, 4836, 350
- Marchal et al. (2003) Marchal, L., Delfosse, X., Forveille, T., et al. 2003, in IAU Symposium 211 ASP Conference Series, ed. E. Martin, 311
- Pier et al. (2003) Pier, J. R., Munn, J. A., Hindsley, R. B., et al. 2003, ApJ, 125, 1559
- Pourbaix et al. (2003) Pourbaix, D., Platais, I., Detournay, S., et al. 2003, A&A, 399, 1167
- Richards et al. (2001) Richards, G. T., Fan, X., Schneider, D. P., et al. 2001, AJ, 121, 2308
- Skrutskie (1997) Skrutskie, M. 1997, S&T, 94, 46
- Smith et al. (2002) Smith, J. A., Tucker, D. L., Kent, S., et al. 2002, AJ, 123, 2121
- Smolčić et al. (2004) Smolčić, V., Ivezić, Ž., Knapp, G. R., et al. 2004, ApJ, (submitted)
- Wielen (1996) Wielen, R. 1996, A&A, 314, 679
- York et al. (2000) York, D. G., Adelman, J., Anderson, J. E., et al. 2000, AJ, 120, 1579