Multicolor Photometric Observations of Optical Candidates to Faint ROSAT X-ray Sources in a 1 deg2 field of the BATC Survey
Abstract
We present optical candidates for 75 X-ray sources in a deg2 overlapping region with the medium deep ROSAT survey (Molthagen et al. 1997). These candidates are selected using the multi-color CCD imaging observations made for the T329 field of the Beijing-Arizona-Taipei-Connecticut (BATC) Sky Survey, which utilizes the NAOC 0.6/0.9m Schmidt telescope with 15 intermediate-band filters covering the wavelength range 3360-9745 Å. These X-ray sources are relatively faint (CR ) and thus mostly are not included in the RBS catalog, they also remain as X-ray sources without optical candidates in a previous identification program carried out by the Hamburg Quasar Survey. Within their position-error circles, almost all the X-ray sources are observed to have one or more spatially associated optical candidates within them down to the magnitude . We have classified 149 of 156 detected optical candidates with 73 of the 75 X-ray sources with a new method which predicts a redshift for non-stellar objects, which we have termed the SED-based Object Classification Approach (SOCA). These optical candidates include: 31 QSOs, 39 stars, 37 starburst galaxies, 42 galaxies, and 7 “just” visible objects. Twenty-eight X-ray error circles have only one visible object in them: 9 QSOs, 3 normal galaxies, 8 starburst galaxies, 6 stars, and two of the “just” visible objects. We have also cross-correlated the positions of these optical objects with NED, the FIRST radio source catalog and the 2MASS catalog. Separately, we have also SED-classified the remaining 6011 objects in our field of view. Optical objects are found at the level above what one would expect from a random distribution, only QSOs are over-represented in these error circles at greater than 4 frequency. We estimate redshifts for all extragalactic objects, and find a good correspondence of our predicted redshift with the measured redshift (a mean error of 0.04 in . There appears to be a supercluster at z 0.3-0.35 in this direction, including many of the galaxies in the X-ray error circles are found in this redshift range.
keywords: X-rays: galaxies - galaxies: active - catalog: surveys
1 Introduction
Combined optical and X-ray data allow one to obtain information about the luminosity functions of various types of X-ray sources as well as their evolution with redshift. In turn, this information can be used to further constrain models for the production of the X-ray background at different flux levels. Much effort has so far been made on the optical identification of the X-ray sources in the ROSAT/Bright Source (RBS) catalog (e.g., Voges et al. 1999; Rutledge et al. 2000) as well as of X-ray sources in some individual ROSAT deep survey observations (e.g., Lehmann et al. 2001).
Yet, it is often unknown how much of the detections that occur in X-ray error circles are real associations of optical counterparts to these X-ray sources, and how much of these associations are due to random chance. To do this, one needs to have detected and identified all optical objects in a given image, and then see what percentages of these objects (QSOs, galaxies, stars) are then found near or within the areas covered by the X-ray error circles. This is precisely the kind of data we have for 75 X-ray sources detected with the ROSAT PSPC to a flux limit , in a 1 deg2 field of view, as this field of view was also observed in our multicolor images for the Beijing-Arizona-Taipei-Connecticut Sky Survey (BATC survey). The relevant X-ray and optical data are presented in § 2. Details of the object classification procedure as well as selection of the X-ray candidates are given in § 3. Associated information that can be gleaned from these data are given in § 4. We summarize our results in § 5.
2 The data and analysis
2.1 The X-ray data
The X-ray data come from a catalog obtained from a medium deep ROSAT survey in the HQS field HS 47.5/22 (Molthagen, Wendker, & Briel, 1997). The survey consists of 48 overlapping ROSAT PSPC pointings which were added up to produce a final catalog containing 574 X-ray sources with broad band (0.1-2.4 keV) count rates between and , in a field of view (FOV) of . Molthagen et al. adopt an X-ray error circle of 2 + 10′′ in radius, with the value of coming from their observations. This is the X-ray error circle used in the present analysis.
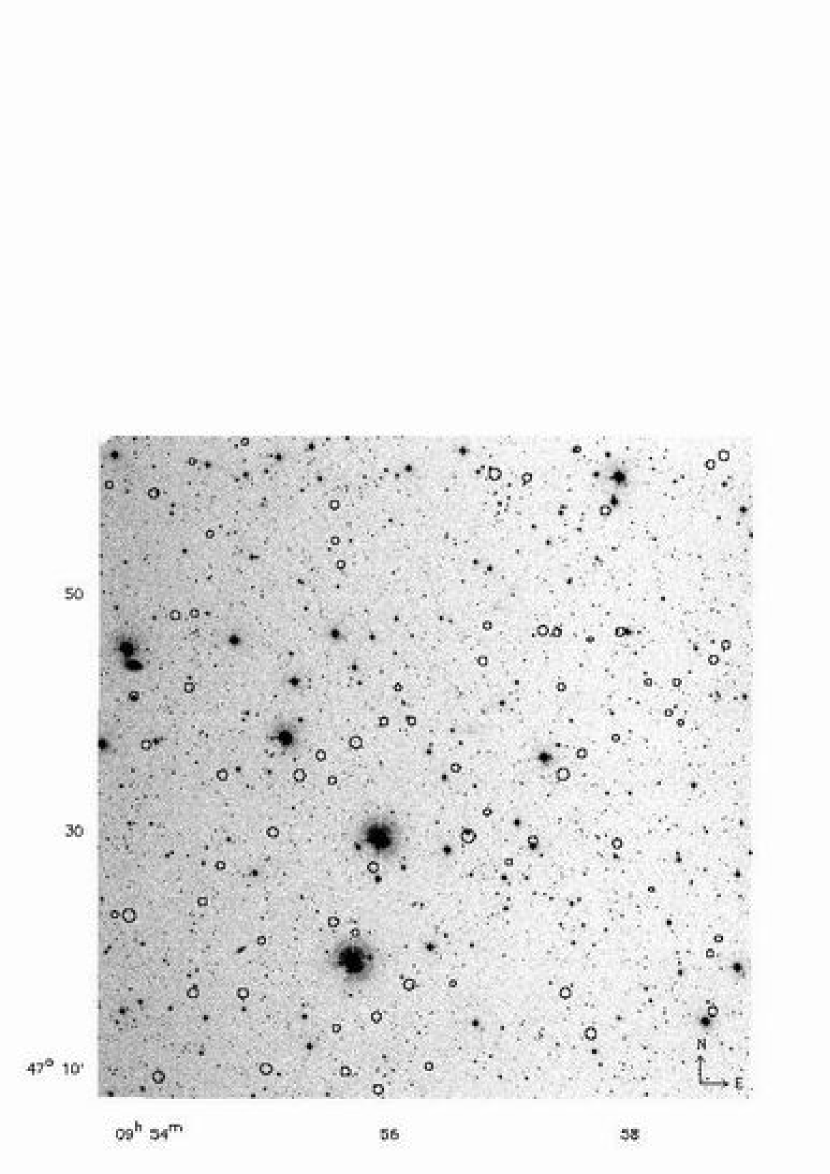
There was a preliminary identification of these X-ray sources with the HQS plates (Molthagen et al, 1997). Only a few objects, all brighter than , have recognizable spectra. At , many objects are generally classified as weak and extremely blue, blue or red. For many X-ray sources no spectral classification was possible, the optical object simply being visible or the field of view empty. 75 of the 574 HQS sources fall on one program field of the BATC survey, T329, centered at 09:56:24.46, +47:35:08.4 (J2000), forming a subsample of the ROSAT medium deep survey in a 1 deg2 field. (One-third of the BATC fields are located with a known quasar in its center. For field T329, this quasar is PC0953+4749 with z = 4.46, originally discovered by Schneider, Schmidt & Gunn 1991. Ironically, this QSO is not an X-ray source in the HQS field.) The X-ray brightness distribution of these 75 sources is shown in Fig.1. The distribution of these 75 sources in our field of view in shown in Fig.2.
Molthagen et al. associate 25 optical candidates for these 75 X-ray sources, or a frequency of 1/3: 6 QSOs or active galaxies; 7 QSO/active galaxy candidates (classified as such or extremely blue); 1 star; 8 stellar candidates; 1 galaxy candidate; 2 faint red objects; 5 unidentified spectra (including overlaps); 39 visible on the HQS direct plate only; and 6 empty fields (i.e., no counterpart on the HQS plate).
2.2 The BATC optical data
Optical observations of BATC field T329 were carried out from 1996-1999 as part of the BATC Survey. Our survey utilizes the 0.6/0.9m Schmidt telescope of the Xinglong Observing Station of the National Astronomical Observatory of China (NAOC), equipped with 15 intermediate-band filters covering the wavelength range 3360-9745Å. With this facility our survey is designed to do multi-color CCD () imaging of 500 selected, deg2 fields-of-view for multiple scientific purposes (cf. Fan et al. 1996; Shang et al. 1998; Zheng et al. 1999; Zhou et al. 1999; Yan et al. 2000; Kong et al. 2000; Ma et al. 2002; Wu et al. 2002).
The dataset for T329 consists of a number of individual direct CCD images in each of the 15 BATC passbands. These images are first treated individually (bias, dark and flat-fielding corrections) and then combined to comprise deep images. Information on the passbands used for the present study, including filter parameters, total exposure time, number of flux calibration images obtained, and the magnitude limit for that passband are given in Table 1. Details on the BATC flux calibration procedure are given in several previous papers (Fan et al. 1996; Zhou et al. 1999; Yan et al. 2000) and the reader is referred to those papers for this information. Further discussion of the observations made in field T329 that are separate from the X-ray identification issue are given in Zhou et al. (2003). The final product of the BATC observations of field T329 is a catalog of 6160 point-like optical objects in our 58 arcmin2 field of view, with astrometry and photometry in 15 colors.
2.3 SED classification
We are in the process of developing a SED-based Object Classification Approach (termed SOCA) for the BATC photometric system (Zhang, et al., in preparation). The SED of each object in our field of view, observed through filters, is compared to the SED computed for a set of template spectra. The aim is to find the best fit between the observed photometry and the model photometry through a standard minimization procedure:
where and are the observed and the template fluxes in the th band respectively, is the error on the observed flux in this band, is the normalization constant can be calculated by minimize the . In order to apply this method to SED classification, we currently employ three sets of template spectra:
-
1.
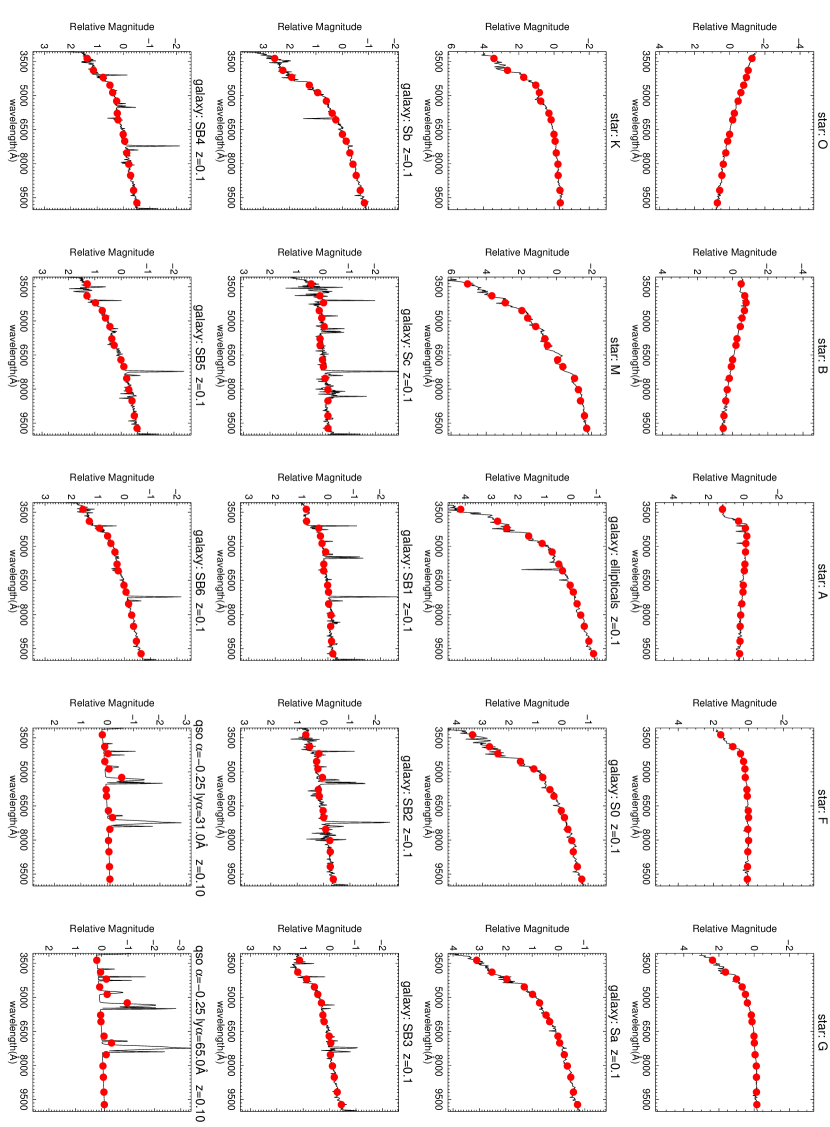
The stellar library of Gunn & Stryker (1983) is used including most spectral classes on the MK system (this will be updated when new data are available);
-
2.
The observed spectra of nearby galaxies (Kinny et al. 1996),including normal galaxies (Elliptical ,S0, Sa, Sb and Sc) and starburst (SB) galaxies (SB1-6) with different internal extinctions are used. Normal galaxies are redshifted from 0 to 1.0 in step of 0.01, SB galaxies are redshifted from 0 to 1.5 in step of 0.01.
-
3.
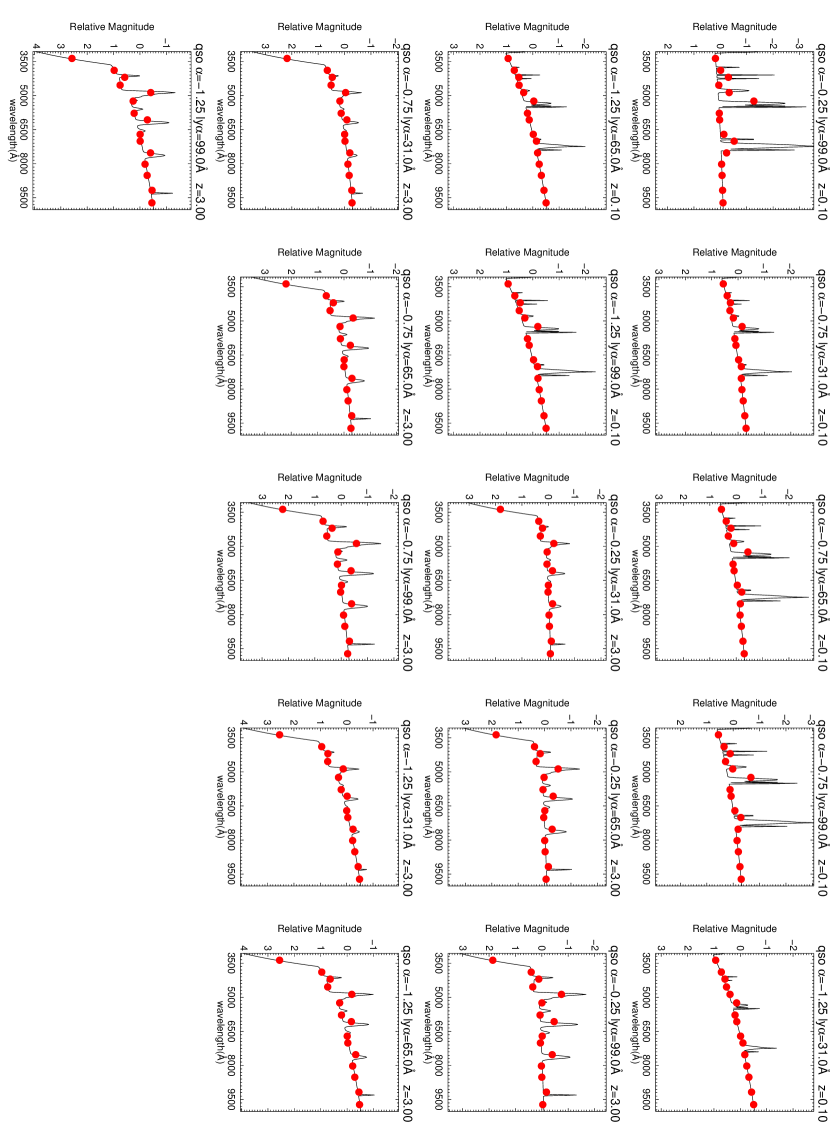
A QSO template set is composed of series of simulated quasar spectra. These spectra have been constructed by fixing the emission line intensity ratio (cf. Wilkes 1986), while varying the equivalent width (65 34 Å) and the continuum index (-0.75 0.5). forest absorption has been modeled according to Møller (1990) and Madau (1995). Redshift estimates are set between 0.0 and 6.0 in steps of 0.01 in .
Representative template spectra used in the present paper are given in Fig.3. The template SEDs are obtained by convolving the template spectra with the measured passband of each filter. As the template SEDs are morphologically-classified, some templates may represent two or more morphologically-similar classes. For example, an SED classified as a starburst galaxy can also possibly be matched to that of a QSO.
A value of is calculated for the correspondence of every template to each object SED. The minimum for each kind of template (star/galaxy/QSO/starburst galaxy) is calculated. The template with the minimum fit is taken as the best fit. In this fitting process we include those objects with at least 5 filter observations (such as saturated stars). The redshift estimates found for non-stellar objects (galaxies, QSOs) by this template-fitting process are useful for statistical studies of this field of view.
3 Optical Candidates
3.1 Optical Objects near or within the X-Ray Error Circles
The CCD limiting magnitudes range from 20.5 to 23.5 mag, tending to be fainter in the bluer filters, and brighter in the more sky-limited redder filters (cf. Table 1). Our deeper, direct CCD observations, combined with our ability to classify the SEDs of the objects detected, permit us both to detect more objects than the HQS survey, as well as to classify more of the objects detected.
The total area covered by the X-ray searches we have done for the 75 X-ray sources corresponds to 31.52 arcmin2 or 0.00937 of the 3364 arcmin2 sky area subtended by the BATC CCD. This area includes additional area searched beyond the nominal 2 error circle for 13 (17%) of the X-ray-detected objects, most of these within 1-2′′ of the original error circle. The 6160 objects detected in the full image field were selected with the same criteria as those we use for the X-ray error circle. If the optical objects and the X-ray sources are randomly associated, we expect to detect optical objects.
Our observations find optical candidates (stars, galaxies, galaxy groups, starburst galaxies, QSOs) in 73 of the 75 X-ray error circles. We detect a total of 156 optical objects in these 75 X-ray error circles. Of these we can definitely SOCA-identify 140, tentatively identify 9 more (7 galaxies and two stars), 7 objects are only “visible,” and one X-ray circle (RXJ0955.5+4735) which is blank in our image (but two stars are just outside this error circle). This makes a total of 149 optically-identified candidates found in the BATC catalog that can be SOCA-classified and are found in or near 73 of the 75 X-ray error circles in our field of view. One of the two remaining X-ray sources (RXJ0954.0+4756) has a “just” visible object within the X-ray error circle that has a position coincident with a known radio source, but is too faint to obtain a reliable SED. The other remaining source (RXJ0953.7+4722) also has one “just” visible source within its error circle.
We have a difference in objects detected in the X-ray circles to those randomly expected of (assuming Gaussian errors). The difference between detected objects and random placement of objects in these X-ray error circles is significant at the 91/14 = 6.5 level. It would appear that the X-ray circles do tend to include more objects than randomly placed circles put on the rest of this field of view, when the data are sampled to faint magnitude levels.
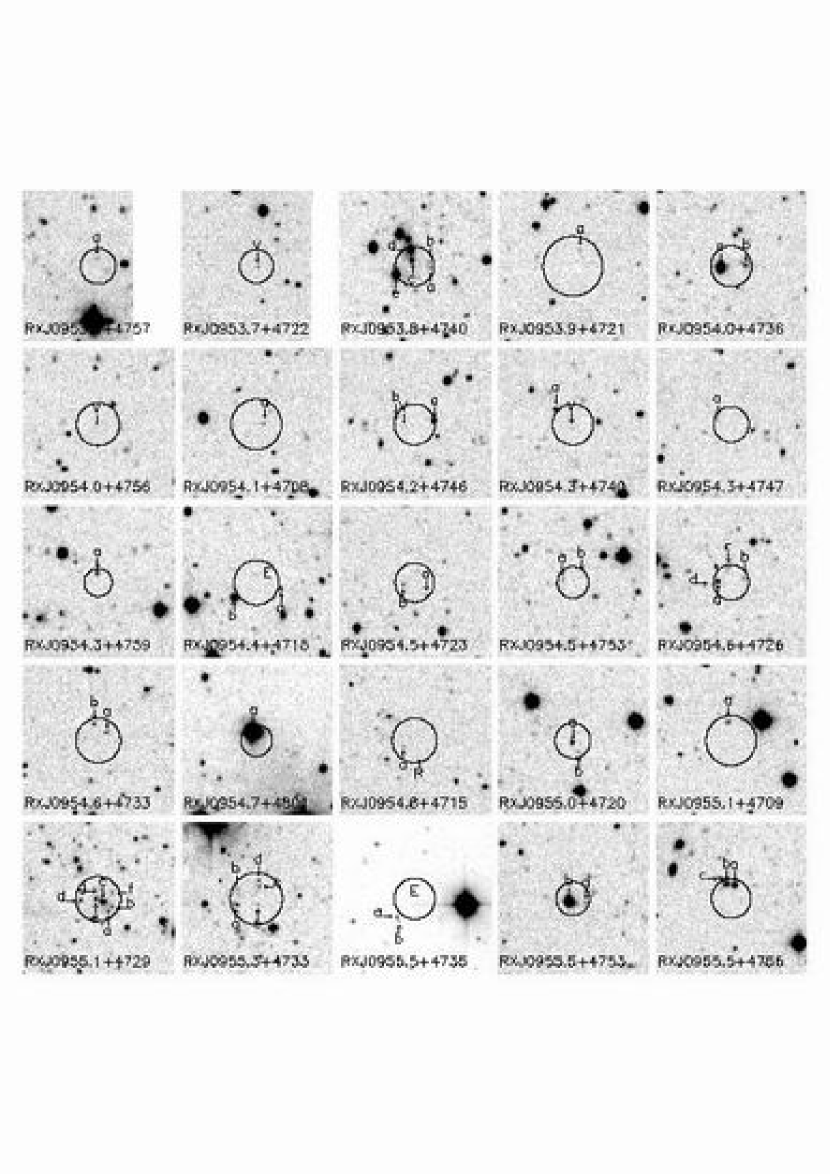
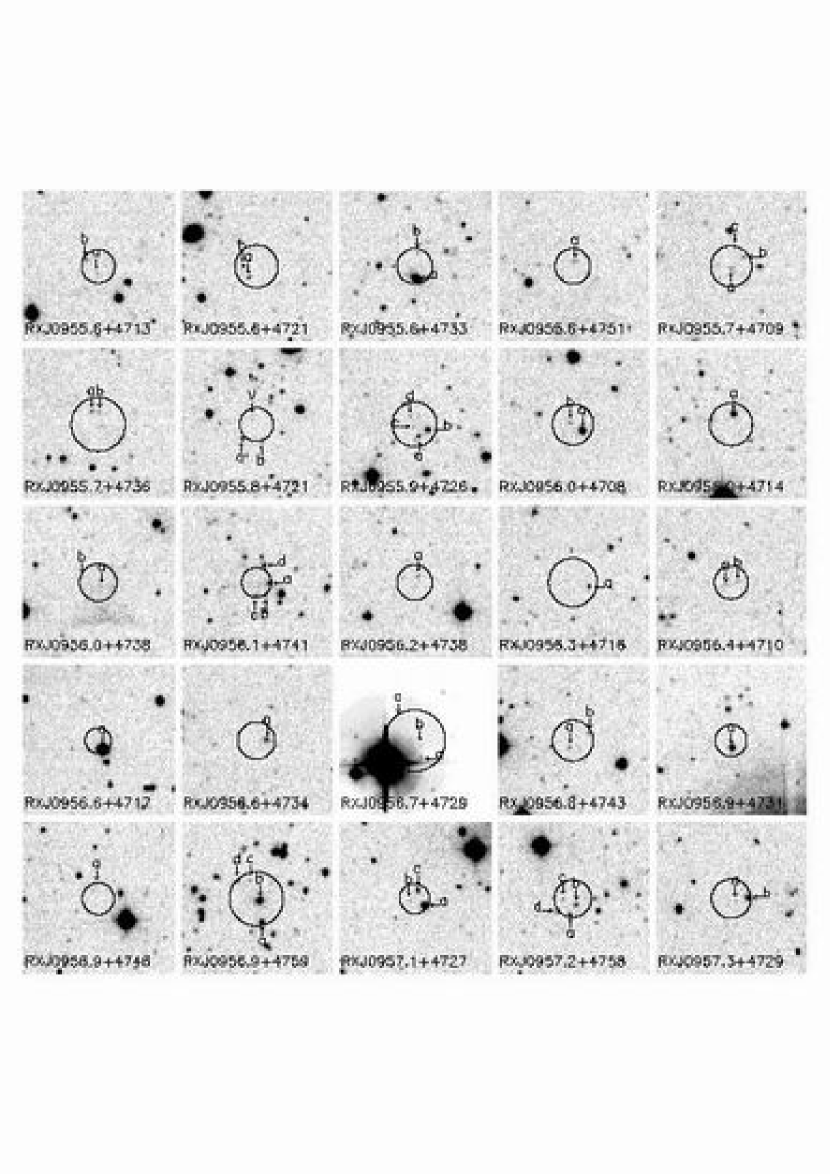
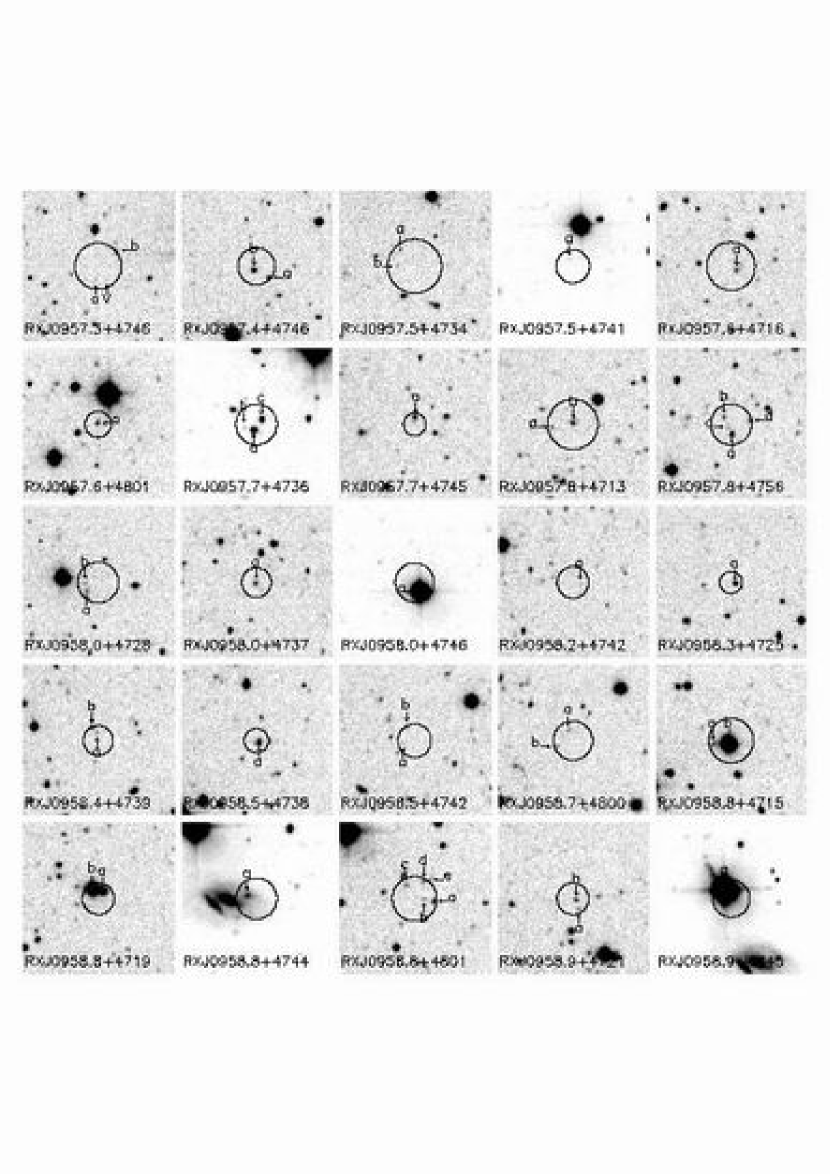
Table 2 gives the relevant information on the optical candidates that are associated with these X-ray sources. The first 4 columns in Table 2 come from the original X-ray catalog: X-ray source name, brightness in the 0.1–2.4 keV passband, 2 error circle radius in units of arcseconds, and the original HQS identification. The label assigned to each candidate optical object, a,b,c,, plus the observed position of the optical candidate (in J2000 coordinates) are given in the next three columns. Columns 8-12 give the derived information for each optical candidate: is the offset of the optical candidate position from the center of the X-ray error circle; denotes the V magnitude of the optical candidate (an upper limit is given if the candidate is only visible, but not measurable), derived from the relation: (Zhou et al., 2003); is the ratio of X-ray to optical flux, calculated from the 0.1-2.4 keV count-rate and optical V magnitude, vis. (Maccacaro et al. 1988); Pred z is the redshift that the SOCA estimates for galaxies and QSOs; Where there are known candidates that are clearly identified on our images, the identity of these candidates are given. Finding charts of all the X-ray sources in our summed image at 7050Å(our j filter) are given in Fig.13.
The SEDs for all 149 SOCA-identified optical candidates in or near 73 of the 75 X-ray source error circles are given in Fig. 5, in which also the best template fit is plotted for each optical candidate. The label on each SED gives the template plotted, the predicted redshift (if galaxy or QSO), and the value of the fit. In the case of two known objects (a nearby galaxy and a bright star; see next section), their previously-known identifications are given in place of the SOCA classification in Table 2.
3.2 Candidate Associations
Most X-ray sources contain more than one optical candidate within their error circles. Choosing which one is the probable X-ray source is educated guesswork at best. Rather than assign probabilities of the likelihood of each optical candidate’s association with these X-ray sources, we prefer to give the reader the statistics of how the candidates relate to the full data on the 6160 objects found in our field of view.
In the 75 X-ray error circles, to a magnitude limit of V 23, we have found: 31 QSOs, 39 stars, 37 starburst galaxies, 42 galaxies, and 7 “only visible” objects. If we take the 6160 objects we find in our field of view, excluding the objects within the X-ray error circles, the analogous counts for these objects are: 341 QSOs, 1912 stars, 1508 starburst galaxies, 2076 galaxies, and 174 objects unclassified for a variety of reasons (too few filters observed, in the halo of a bright star, etc.). If we assume these objects are randomly distributed in this field of view, we expect random associations within our X-ray error circles to be 3.2 QSOs, 17.9 stars, 14.1 starburst galaxies, and 19.5 galaxies (discarding the unclassified objects). Therefore, the objects found in the X-ray error circles rather than the random placement of those identified objects in the field of view are: QSOs: ; stars: ; starburst galaxies: ; and galaxies: .
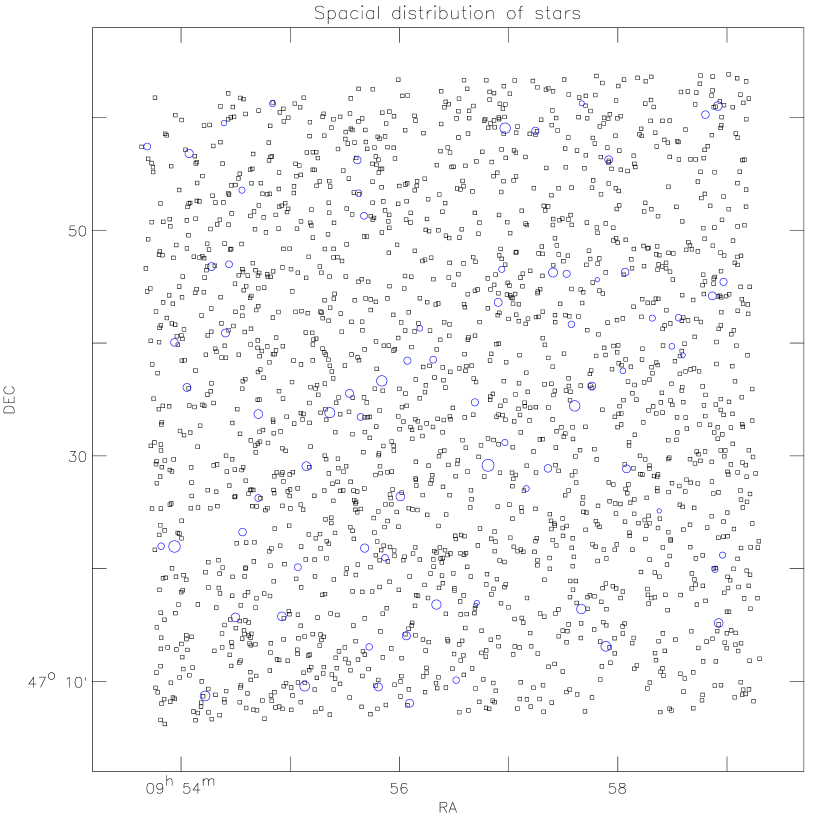
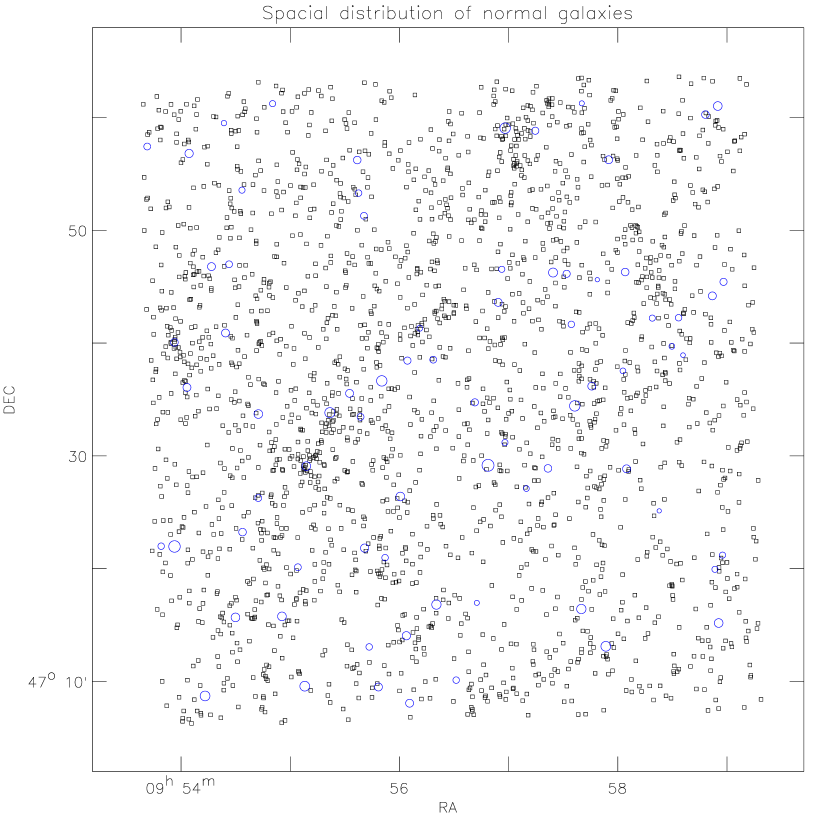
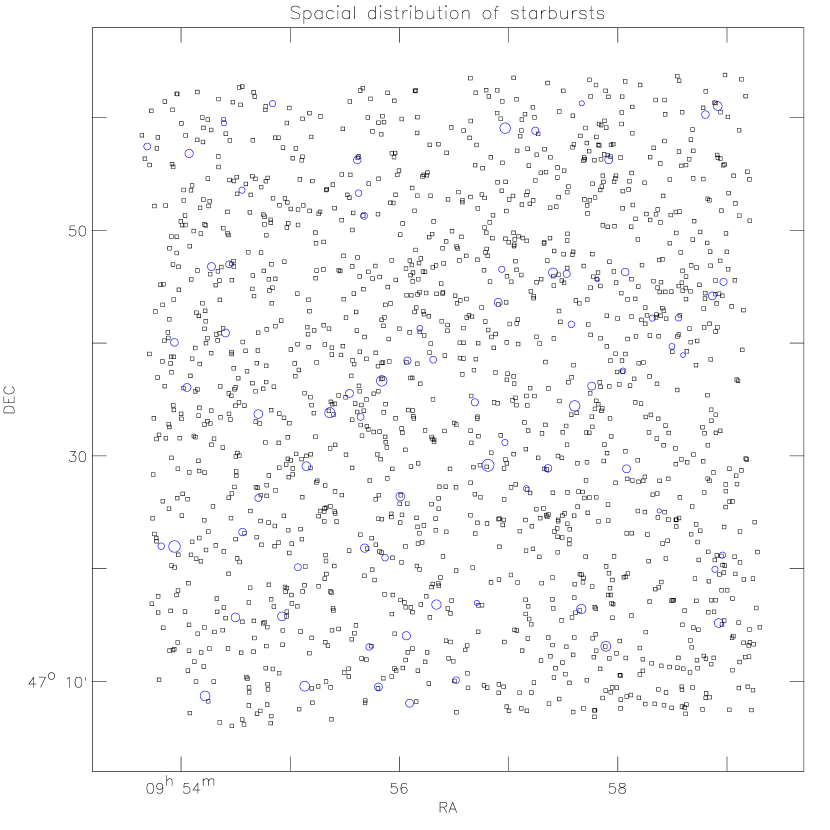
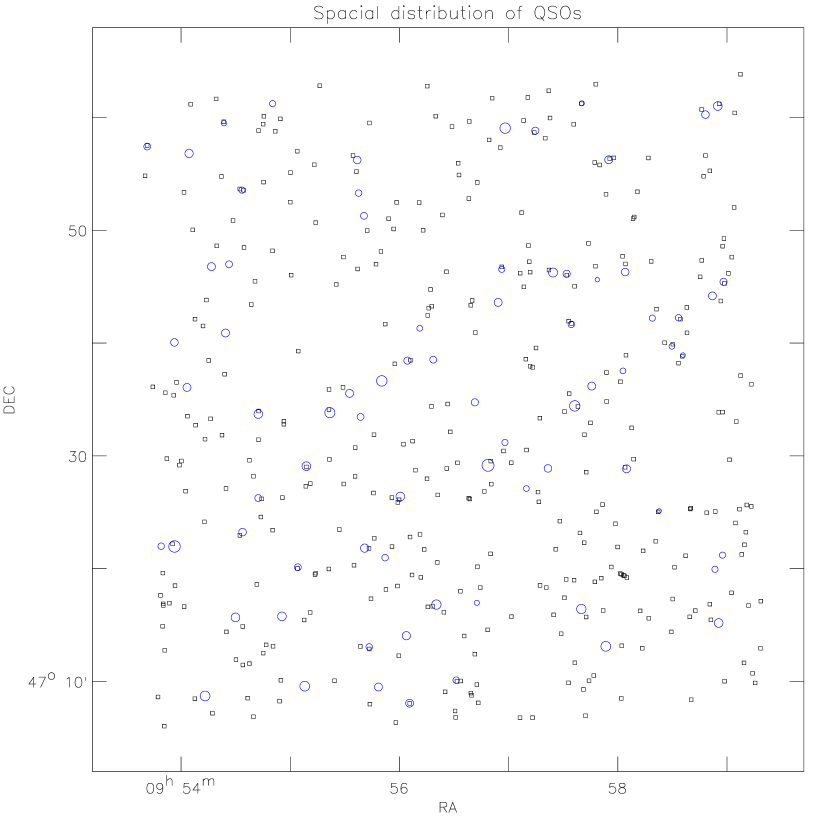
On the plus side, all objects are more represented within the X-ray error circles that what would be randomly there. On the minus side, only the QSOs have a highly significant overdensity () within the X-ray error circles, while stars, starburst galaxies and galaxies are only there at the 2.8-3.2 level. In Fig17-20 we show the distribution of each kind of object (QSO, star, starburst galaxy, galaxy) in our field of view, relative to the placement and size of the X-ray error circles. That QSOs are statistically most reliable detections comes as little surprise, as this was already well-known (e.g., Shanks et al. 1991, Georgantopoulos et al. 1996, McHardy et al. 1998).
We only find one optical candidate in 28 of these error circles, these being: 9 QSOs, 3 normal galaxies, 8 starburst galaxies, 6 Galactic stars, and 2 candidates that are “just” visible on our image. The single candidates in these X-ray error circles have an asterisk by their SOCA classification in Table2.
4 Supplemental Data and Redshift Distributions
4.1 Radio and Near-IR identifications
We have cross-correlated the positions of all of the X-ray sources in our field-of-view with positions in the FIRST (Faint Images of Radio Sources at Twenty centimeters) radio survey, the infrared 2MASS (2 Micron All Sky Survey) catalog, and the NED catalog. We find seven of the X-ray error circles have FIRST radio sources within them that are coincident with optical sources, in addition to one associated with another radio source (HS0954+4815 as given by NED; see Table 2). Of these 8 associated radio sources, just two do not have SEDs in our data, and only three have another object in their X-ray error circle.
There are a total of 100 radio sources in our image. The probability of having one radio source within 2′′ of any optical source in this image is 0.47 (taking the joint probability). This makes the probability of having all eight position matches for the radio sources with the optical sources at . Hence, most of the radio sources are likely associated with their optical counterparts.
In contrast, of the seven 2MASS object with position coincident with our optical candidates, only 2 are classified as galaxies [one normal galaxy, RXJ0953.8+4740(a) and one starburst galaxy, RXJ0956.9+4731(a)], and five are identified with late-type stars that are the dominant stellar candidates within these particular X-ray error circles.
4.2 Spectroscopic Observations and Objects of Special Note
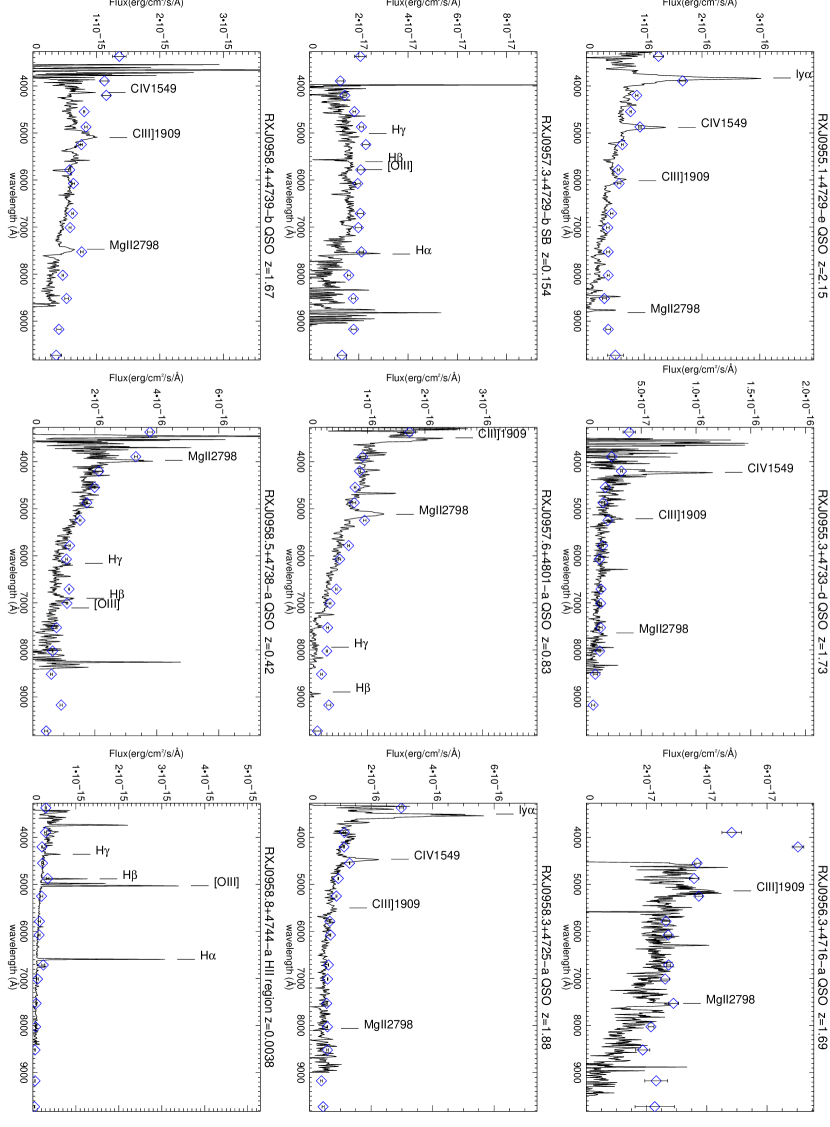
We have obtained spectra of a subsample of our optically-detected candidates to test our classification method and SOCA redshift estimates. These spectra were taken with the slit spectrograph on NAOC’s 2.16 m telescope at its Xinglong Observing Station, and the Multiobject Fiber Spectrograph (MOFS) on the 6m telescope of the Special Astrophysical Observatory of the Russian Academy of Sciences. Nine of these spectra are shown in Fig.16, with the BATC fluxes overlayed. Included are 7 QSOs, 1 starburst galaxy and the HII galaxy associated with UGC 5354. In addition, a search of the SIMBAD and NASA Extragalactic Database (NED) catalogs comes up with redshifts for two additional QSOs associated with these X-ray sources (cf. Table 2).
The correspondence of spectroscopically-determined redshifts with our SOCA-determined redshifts is excellent for 10 of the objects (a mean error in z of 0.04 for these 10 objects), while it is off by 1.03 for one additional object (RXJ0958.5+4738(a); shown in Fig. 16). Examination in detail of the SOCA fitting procedure for this one object shows that the BATC filter system mistakes the emission line in the 9190Å filter for [OII] 3727, while the spectrum shows this must be H.
We have also made careful visual inspections for each of optical counterparts within the X-error circles, relating their visual appearance to the SEDs we obtain for them (something the reader can also do, using Fig. 5 and Fig. 13). We give special note to the objects found in the following X-ray sources:
RXJ0953.8+4740: There is evidently a galaxy group in this error circle, comprised of objects b,c and d. This group has previously been identified as PDCS 36 (the 36th cluster/group found in the Palomar Distant Cluster Survey, Postman et al. 1996).
RXJ0954.0+4756: This object is too faint to identify optically, but its position is coincident with the radio source 7C0952+4814 = FIRST J095401.1+475644.
RXJ0954.8+4715: The second object in Table 2 listed for this source has a position coincident with the radio source CDS90-R307B = FIRST J095453.2+471533.
RXJ0955.1+4729: There are 7 objects found in the X-ray error circle. RXJ0955.1+4729(e) is a confirmed QSO at a redshift 2.15 and (d) is a late type star. What is interesting is that a,b,c,f and g are classified as normal galaxies at redshifts 0.33,0.36,0.36,0.39 and 0.33 respectively. Visual inspection also tends to put them at similar distances, making them a possible galaxy group.
RXJ0956.7+4729: There are 3 objects within the error circle. From the image we can see that all of them are within the diffraction spikes of the nearby bright star, thus their SED are suspect. As a result, we put question marks in their identification in Table 2.
RXJ0958.8+4744: This is part of the nearby, interacting galaxy UGC 5354. Part of this galaxy system is a small, HII galaxy off to one side.
RXJ09058.9+4745: This is a bright, cataloged F8 star, BD+48-1823.
4.3 Redshift Distribution
In assembling the estimated redshifts for our X-ray associated objects, we noticed that many of them tended to be clustered around a redshift of 0.30). Given the accuracy of our redshifts for galaxies (0.1 for most individual objects), this is significant. The top histogram in Fig 21 shows the redshift distribution for the 110 galaxies plus QSOs X-ray source candidates in our 58 arcmin2 field of view. It is evident that there is a high overabundance of objects, mostly galaxies, in the redshift range 0.25-0.35. The bottom histogram in Fig 21 shows the redshift distribution for all 3663 SOCA-classified galaxies in our field of view.
While the peak at redshift 0.25-0.35 is still there in the full galaxy sample, the contrast of that peak appears to be more significant for those galaxy candidates found in or near the error circles for these X-ray sources. At this redshift, a degree-sized field of view corresponds to a Mpc region of space. This means that there is a collection of superclusters at this redshift interval. This is similar to what one would see if one looked back at the local universe via sighting down the angle through the Perseus cluster, the Local Supercluster, the Great Attractor and the Shapley concentration stretched out over a redshift range of nearly 20,000 km/sec. In other words, seeing an overdense region of galaxies over a redshift range of 0.1 is not that unusual in our universe.
5 Summary
Based on the 15 color photometric observations, and SED-based object classification approach (SOCA), as well as the multiwavelength cross-correlations, we find 156 optical candidates, to a magnitude limit close to , within or near the error circles for all 75 X-ray sources in our field of view. Among them are 31 QSOs (nine of which have spectroscopic confirmation), 37 starburst galaxies (2 of which have spectroscopic confirmation), 42 normal galaxies (including 3 possible galaxy groups), 39 stars (one of which is a BD object), and 7 just “visible” objects with no classifications (two of which are coincident with known radio sources). Two of the X-ray error circles have only just “visible” objects in them. We find 8 radio sources (out of 100 in our image) that are coincident with an optical object within the X-ray error circles, making it likely that many of these are the optical counterparts to these radio sources.
Separately, we have also SED-classified 6011 additional objects in our 3364 arcmin2 field of view to the same apparent magnitude limit (i.e., not including those found near or in the X-ray error circles). Of these 6011 objects, 341 are QSOs, 1912 are stars, 1508 are starburst galaxies, and 2076 are galaxies and 174 are unclassified for a number of objective reasons. The area of our X-ray circles subtends 31.52 arcmin2, or 0.00937 of our full 3364 arcmin2 field of view. Considering the objects detected to objects that could be randomly found in these error circles, we have: detections for all 149 classified objects, for the QSOs, and from for stars, starburst galaxies and galaxies. Twenty-eight error circles have only one object in or near them, including: 9 QSOs, 3 normal galaxies, 8 starburst galaxies, 6 stars and 2 “just” visible objects.
In sum, in this paper we perform an exercise that few have been able to do with their X-ray data. By being able to SED-classify all objects in our 3364 arcmin2 field of view down to V 23, we can ask ourselves what are the kinds of optical candidates we find within X-ray error circles to those randomly found in the field of view. question is that while all classified objects: QSOs, starburst galaxies, normal galaxies and stars are overrepresented in the X-ray error circles compared to a random distribution, it is only the QSOs that are highly statistically found in these X-ray circles. Yet, at the same time, there are 6.5 more objects within these X-ray circles than if randomly distributed in this image. So, while we know that one of the objects in our X-ray error circles is likely the X-ray source, in absence of independent knowledge, choosing which object it is is still more arbitrary than scientific.
References
- (1)
- (2) Brandt, W.N., et al., 2001, AJ, 122, 1
- (3)
- (4) Fan, X.H., et al., 1996, AJ, 112, 628
- (5)
- (6) Fischer, J.-U., et al., 1998, AN, 319, 347
- (7)
- (8) Georgantopoulos, I., Stewart, G. C., Shanks, T., Boyle, B. J., & Griffiths, R. E., 1996, MNRAS, 280, 276
- (9)
- (10) Gunn, J.E., Stryker, L.L., 1983, ApJS, 52, 121
- (11)
- (12) Kinney, A.L., Bohlin, R.C., Calzetti, D.,Panagia, N., & Wyse, R.F.G., 1993, ApJS, 86, 5
- (13)
- (14) Kinney, A.L., Calzetti, D., Bohlin, R.C., McQuade, K., Storchi-Bergmann, T., & Schmitt, H.R., 1996, ApJ,467, 38
- (15)
- (16) Kong, X., et al., 2000, AJ, 119, 2745
- (17)
- (18) Lehmann, I., et al., 2000, A&A, 354, 35
- (19)
- (20) Lehmann, I., et al., 2001, A&A, 371, 833
- (21)
- (22) Ma, J., Zhou, X., Wu, H., Chen, J.S., Jiang, Z.J., Xue, S.J., Zhu, J., 2002, ChJAA, 2, 127
- (23)
- (24) Maccacaro, T., Gioia, I.M., Wolter, A., Zamorani, G., & Stocke, J., 1988, ApJ, 326, 680
- (25)
- (26) Madau, P. 1995 ApJ,441,18
- (27)
- (28) McHardy I.M., et al., 1998, MNRAS, 295, 641
- (29)
- (30) Molthagen, K., Wendker, H.J., & Briel, U.G., 1997, A&AS, 126, 509
- (31)
- (32) Mller, P & Jakobsen, P., 1990 A&A,228,299
- (33)
- (34) Mushotzky, R.F., Cowie, L.L., Barger, A.J.,& Arnaud, K.A. 2000, Nature, 404, 459
- (35)
- (36) Postman, M, Lubin, L.M., Gunn, J.E., Oke, J.B., Hoessel, J.G., Schneider, D.P., & Christensen, J.A. 1996, AJ, 111, 615.
- (37)
- (38) Rutledge, R.E, Brunner, R.J., Prince, T.A.,& Lonsdale, C., 2000, ApJS, 131, 335
- (39)
- (40) Schmidt, M., et al.. 1998, A&A, 329, 495
- (41)
- (42) Shang, Z.H., et al., 1998, ApJL, 504L, 23
- (43)
- (44) Shanks, T., Georgantopoulos, I., Stewart, G.C., Pounds, K.A., Boyle, B.J., & Griffiths, R.E., 1991, Nature, 353, 315
- (45)
- (46) Schneider, D.P. Schmidt, M.,& Gunn, J.E., 1991, AJ, 101, 2004
- (47)
- (48) Sutherland, W. & Saunders, W., 1992, MNRAS, 259, 413
- (49)
- (50) Voges, W., et al., 1999, A&A, 349, 389
- (51)
- (52) Wilkes,B.J., 1986 MNRAS,218,331
- (53)
- (54) Wolf, C. et. al. 2001 A&A,365,681
- (55)
- (56) Yan, H.J., et al., 2000, PASP, 112, 691
- (57)
- (58) Zamorani, G., et al. 1999, A&A, 346, 731
- (59)
- (60) Zheng, Z.Y., et al., 1999, AJ, 117,2757
- (61)
- (62) Zhou, X., Chen, J.S., Xu, W., Zhang, M., Jiang, Z.J., Zheng, Z.Y., Zhu, J, 1999, PASP, 111, 909
- (63)
- (64) Zhou, X., et al., 2003, A&A,397,361
- (65)
| Filter | Wavelength | Frames | Exposure | Calibrations | Limiting Magnitude |
|---|---|---|---|---|---|
| a | 3360 | 7 | 03:04 | 1 | 22.13 |
| b | 3890 | 12 | 03:44 | 1 | 22.56 |
| c | 4210 | 19 | 08:45 | 7 | 23.23 |
| d | 4550 | 35 | 09:58 | 5 | 23.68 |
| e | 4920 | 29 | 03:04 | 10 | 22.83 |
| f | 5270 | 25 | 06:00 | 5 | 23.22 |
| g | 5795 | 30 | 06:54 | 5 | 22.83 |
| h | 6075 | 21 | 04:44 | 3 | 22.85 |
| i | 6660 | 31 | 05:49 | 10 | 22.61 |
| j | 7050 | 27 | 06:53 | 5 | 22.55 |
| k | 7490 | 22 | 05:52 | 22 | 21.91 |
| m | 8020 | 22 | 06:50 | 6 | 22.07 |
| n | 8480 | 12 | 04:50 | 3 | 21.34 |
| o | 9190 | 13 | 04:41 | 1 | 20.81 |
| p | 9745 | 12 | 05:00 | 2 | 20.24 |
| ROSAT source | Cts | XaaRadial position uncertainty of X-ray detection, in units of arcseconds.err | Old IDbbPreliminary indentification based on HQS plates (Molthagen, Wendker & Briel, 1997): D, visible on the HQS direct plate only; AGN=known AGN; AGN can=AGN candidate (clssified as AGN or extremely blue); sat, spectral type=star; galaxy. | Associated Optical Objects | ddDistance of the identified optical source to the center of X-ray detection, in units of arcseconds. | mVeeV magnitude measure on our images. If no detection, an upper limit is given; if saturated star, a lower limit is given. | ffThe predicted redshift for all non-stellar objects, as discussed in the text. | Pred zggThe ratio of X-ray to optical flux as defined in the text. | New IDhhThe new object classification based on the SED information. ID’s taken from NED and SIMBAD; see Figure 2 and text for other definitions. An asterisk before this classification indicates the most likely x-ray source. | ||
|---|---|---|---|---|---|---|---|---|---|---|---|
| objccObject labels. i) Sources with fluxes on more than a few passbands are labeled a,b,c, for association with each X-ray detection. ii) R = known radio source, found by cross-comparing with the FIRST catalog (http://sundog.stsci.edu/first/catalogs/catalog_01oct15.bin.gz), NASA Extragalactic Database (NED) and SIMBAD; radio ID given in last column according to FIRST and NED definitions. iii) V = visible only in some direct images. iv) E = no source found in x-ray error circle. | RA(J2000) | DEC(J2000) | |||||||||
| RXJ0953.6+4757 | 3.9 | 19 | D | a | 09:53:37.94 | 47:57:33.6 | 7.60 | 22.12 | 1.63 | 2.27 | *QSO |
| RXJ0953.7+4722 | 5.7 | 18 | D | V | 09:53:47.20 | 47:21:57.7 | 2.51 | 23.01 | 2.15 | *? | |
| RXJ0953.8+4740 | 6.9 | 21 | D | a | 09:53:51.92 | 47:40:00.7 | 18.50 | 21.24 | 1.52 | 0.22 | Sb |
| b | 09:53:51.96 | 47:40:07.5 | 17.80 | 21.14 | 1.48 | 0.27 | Sb | ||||
| c | 09:53:53.94 | 47:40:10.3 | 5.80 | 19.43 | 0.80 | 0.30 | Sb | ||||
| d | 09:53:54.04 | 47:40:22.5 | 17.80 | 18.59 | 0.46 | 0.33 | Sa | ||||
| b,c,d grp=PDCS 36 | |||||||||||
| e | 09:53:55.78 | 47:39:54.9 | 23.31 | 16.71 | -0.29 | K star | |||||
| RXJ0953.9+4721 | 11.3 | 32 | unid | a | 09:53:53.72 | 47:22:15.8 | 19.00 | 21.09 | 1.67 | 0.84 | *SB2 |
| RXJ0954.0+4736 | 2.9 | 22 | M can | a | 09:54:01.90 | 47:36:03.5 | 11.40 | 16.20 | -0.86 | M star | |
| b | 09:53:59.09 | 47:36:04.4 | 17.40 | 19.98 | 0.64 | 0.33 | SB4 | ||||
| RXJ0954.0+4756 | 3.6 | 23 | D | V,R | 09:54:01.18 | 47:56:44.1 | 7.17 | 23.01 | 1.95 | *? | |
| 7C0952+4814, FIRST J095401.1+475644 | |||||||||||
| RXJ0954.1+4708 | 2.6 | 27 | AGN can | a | 09:54:10.99 | 47:08:45.0 | 9.30 | 22.04 | 1.42 | 0.52 | *Sa |
| RXJ0954.2+4746 | 2.7 | 22 | empty | V | 09:54:14.99 | 47:46:45.1 | 12.96 | 23.01 | 1.95 | ? | |
| a | 09:54:11.57 | 47:46:51.6 | 22.53 | 19.70 | 0.50 | M star | |||||
| b | 09:54:15.87 | 47:46:56.3 | 21.79 | 21.23 | 1.11 | M star | |||||
| RXJ0954.3+4740 | 1.8 | 22 | D | V | 09:54:21.95 | 47:40:52.0 | 5.22 | 23.01 | 1.65 | ? | |
| a | 09:54:23.61 | 47:41:14.1 | 25.03 | 20.45 | 0.63 | M star | |||||
| RXJ0954.3+4747 | 4.3 | 19 | D | a | 09:54:24.96 | 47:47:07.6 | 15.40 | 21.55 | 1.44 | 0.57 | *SB6 |
| RXJ0954.3+4759 | 3.7 | 15 | AGN can | a | 09:54:20.26 | 47:59:43.8 | 9.80 | 19.51 | 0.56 | 1.75 | *QSO |
| RXJ0954.4+4715 | 5.6 | 24 | unid. | a | 09:54:25.57 | 47:15:34.3 | 28.48 | 20.66 | 1.20 | 0.30 | S0 |
| b | 09:54:30.74 | 47:15:26.8 | 31.06 | 17.20 | -0.18 | K star | |||||
| RXJ0954.5+4723 | 7.1 | 21 | D | a | 09:54:30.56 | 47:23:02.4 | 20.00 | 20.94 | 1.41 | 1.44 | QSO |
| b | 09:54:33.08 | 47:23:14.4 | 13.50 | 20.76 | 1.34 | 0.56 | SB4 | ||||
| RXJ0954.5+4753 | 2.5 | 17 | D | a | 09:54:31.53 | 47:53:40.4 | 11.60 | 21.38 | 1.13 | 0.73 | SB3 |
| b | 09:54:29.37 | 47:53:45.9 | 13.03 | 21.71 | 1.27 | 2.27 | QSO | ||||
| RXJ0954.6+4726 | 8.5 | 19 | D | a | 09:54:41.75 | 47:26:20.7 | 14.70 | 19.86 | 1.06 | M star | |
| b | 09:54:38.76 | 47:26:23.6 | 16.00 | 21.25 | 1.61 | 0.22 | Sb | ||||
| c | 09:54:40.51 | 47:26:36.1 | 16.20 | 21.12 | 1.56 | K star | |||||
| d | 09:54:42.38 | 47:26:17.6 | 21.24 | 20.54 | 1.34 | 1.79 | QSO | ||||
| RXJ0954.6+4733 | 2.8 | 24 | AGN can | a | 09:54:39.11 | 47:33:54.2 | 12.30 | 21.33 | 1.16 | 0.41 | S0 |
| b | 09:54:40.46 | 47:34:05.0 | 18.40 | 19.76 | 0.46 | 0.79 | QSO | ||||
| RXJ0954.7+4801 | 3.0 | 17 | sat | a | 09:54:47.38 | 48:01:28.0 | 9.40 | 13.20 | -2.05 | *G star | |
| RXJ0954.8+4715 | 2.9 | 24 | D | a | 09:54:54.82 | 47:15:43.6 | 14.50 | 21.64 | 1.30 | M star | |
| V,R | 09:54:53.17 | 47:15:33.1 | 15.20 | 23.01 | 1.86 | ? | |||||
| CDS90-R307B, FIRST J095453.2+471533 | |||||||||||
| RXJ0955.0+4720 | 3.7 | 19 | AGN | a | 09:55:02.19 | 47:20:08.6 | 4.40 | 19.50 | 0.55 | 1.24 | QSO, z=1.22jjfootnotemark: |
| b | 09:55:01.61 | 47:19:57.5 | 16.62 | 22.35 | 1.70 | 1.27 | Sc? | ||||
| RXJ0955.1+4709 | 0.8 | 27 | D | a | 09:55:06.46 | 47:10:00.2 | 20.40 | 21.80 | 0.81 | *M star? | |
| RXJ0955.1+4729 | 2.4 | 24 | AGN | a | 09:55:05.60 | 47:28:54.2 | 19.60 | 21.33 | 1.10 | 0.36 | Sb |
| b | 09:55:05.12 | 47:28:59.1 | 19.10 | 20.96 | 0.95 | 0.33 | Sb | ||||
| c | 09:55:06.08 | 47:29:05.2 | 7.80 | 19.68 | 0.44 | 0.36 | Sa | ||||
| d | 09:55:08.55 | 47:29:07.6 | 20.10 | 20.93 | 0.94 | M star | |||||
| e | 09:55:06.91 | 47:29:08.8 | 3.80 | 19.39 | 0.32 | 2.19 | QSO, z=2.15jjfootnotemark: | ||||
| f | 09:55:05.04 | 47:29:15.3 | 16.40 | 21.33 | 1.10 | 0.39 | Sb | ||||
| g | 09:55:06.30 | 47:29:18.3 | 7.91 | 21.91 | 1.34 | 0.33 | Sb | ||||
| a,b,c,f,g grp? | |||||||||||
| RXJ0955.3+4733 | 5.6 | 28 | D | a | 09:55:21.65 | 47:33:47.9 | 24.20 | 20.16 | 1.00 | 0.36 | SB6 |
| b | 09:55:21.56 | 47:34:05.6 | 23.90 | 21.31 | 1.46 | 0.25 | Sa | ||||
| c | 09:55:19.07 | 47:34:07.7 | 12.20 | 20.90 | 1.29 | 0.46 | SB6 | ||||
| d | 09:55:19.10 | 47:34:15.2 | 19.40 | 20.23 | 1.03 | 1.75 | QSO, z=1.73jjfootnotemark: | ||||
| e | 09:55:19.26 | 47:33:47.5 | 8.62 | 22.27 | 1.84 | 1.00 | Sb | ||||
| RXJ0955.5+4735 | 4.3 | 22 | red | E | 09:55:30.20 | 47:35:39.0 | 23.01 | 2.03 | ? | ||
| a | 09:55:32.15 | 47:35:18.0 | 28.81 | 18.86 | 0.37 | G star? | |||||
| b | 09:55:31.94 | 47:35:13.3 | 31.15 | 20.47 | 1.01 | M star | |||||
| RXJ0955.5+4753 | 7.7 | 18 | FG can | a | 09:55:33.49 | 47:53:17.9 | 15.90 | 21.48 | 1.66 | 0.52 | Sb |
| b | 09:55:35.31 | 47:53:20.1 | 6.40 | 15.23 | -0.83 | G star | |||||
| RXJ0955.5+4756 | 3.0 | 21 | AGN can | a | 09:55:33.68 | 47:56:34.2 | 13.90 | 18.08 | -0.10 | F star | |
| b | 09:55:34.58 | 47:56:35.5 | 15.30 | 19.74 | 0.56 | 0.59 | SB6 | ||||
| c | 09:55:35.09 | 47:56:41.6 | 22.88 | 19.64 | 0.52 | 0.17 | SB6 | ||||
| RXJ0955.6+4713 | 5.8 | 18 | D | a | 09:55:41.50 | 47:13:01.1 | 9.10 | 20.88 | 1.30 | 1.32 | QSO |
| b | 09:55:42.74 | 47:13:16.3 | 16.00 | 20.58 | 1.18 | 0.18 | SB6 | ||||
| RXJ0955.6+4721 | 2.3 | 23 | D | a | 09:55:39.59 | 47:21:42.0 | 16.70 | 20.44 | 0.72 | 0.00 | Sb |
| b,R | 09:55:40.24 | 47:21:54.7 | 15.70 | 19.65 | 0.41 | 0.48 | QSO | ||||
| CDS90-R324, FIRST J095540.2+472154 | |||||||||||
| RXJ0955.6+4733 | 3.1 | 19 | gal can | a | 09:55:36.17 | 47:33:19.1 | 15.00 | 17.34 | -0.38 | 0.16 | S0 |
| b | 09:55:36.00 | 47:33:48.7 | 15.02 | 22.49 | 1.68 | 0.57 | Sb, | ||||
| FIRST J095536.0+473349 | |||||||||||
| RXJ0955.6+4751 | 6.7 | 19 | D | a | 09:55:37.67 | 47:51:28.0 | 4.60 | 21.41 | 1.58 | 0.89 | *SB6 |
| RXJ0955.7+4709 | 0.9 | 22 | D | a | 09:55:46.40 | 47:09:32.8 | 4.20 | 20.76 | 0.44 | 1.02 | QSO |
| b | 09:55:44.94 | 47:09:46.1 | 17.50 | 22.04 | 0.96 | M star | |||||
| c | 09:55:45.94 | 47:09:56.9 | 20.45 | 22.06 | 0.97 | 0.30 | Sb | ||||
| RXJ0955.7+4736 | 4.2 | 29 | D | a | 09:55:48.58 | 47:36:59.0 | 14.70 | 20.66 | 1.07 | 1.58 | QSO |
| b | 09:55:47.68 | 47:36:58.2 | 12.40 | 21.25 | 1.31 | 0.32 | SB6 | ||||
| RXJ0955.8+4721 | 3.5 | 18 | D | V | 09:55:50.32 | 47:21:11.6 | 7.86 | 23.01 | 1.94 | ? | |
| a | 09:55:51.64 | 47:20:48.0 | 24.53 | 20.94 | 1.11 | M star | |||||
| b | 09:55:49.41 | 47:20:43.9 | 21.68 | 21.86 | 1.48 | 0.47 | Sa? | ||||
| RXJ0955.9+4726 | 2.3 | 24 | D | a | 09:55:57.71 | 47:26:15.1 | 17.70 | 19.42 | 0.31 | 0.26 | SB2 |
| b | 09:55:56.65 | 47:26:22.9 | 16.70 | 19.96 | 0.53 | 0.36 | Sa | ||||
| c | 09:55:58.24 | 47:26:26.7 | 4.30 | 21.70 | 1.23 | K star | |||||
| d | 09:55:58.68 | 47:26:38.2 | 8.70 | 21.05 | 0.97 | 0.31 | SB6 | ||||
| RXJ0956.0+4708 | 5.9 | 22 | D | a | 09:56:02.39 | 47:08:02.0 | 13.70 | 17.25 | -0.13 | G star | |
| b | 09:56:03.67 | 47:08:11.3 | 2.80 | 20.29 | 1.07 | 1.82 | QSO | ||||
| RXJ0956.0+4714 | 3.1 | 23 | AGN can | a | 09:56:01.28 | 47:14:20.0 | 10.50 | 18.12 | -0.07 | *K star | |
| RXJ0956.0+4738 | 2.6 | 20 | empty | a | 09:56:01.63 | 47:38:27.0 | 7.90 | 20.94 | 0.98 | 0.26 | SB1 |
| b | 09:56:03.77 | 47:38:38.5 | 18.40 | 21.24 | 1.10 | 0.69 | QSO | ||||
| RXJ0956.1+4741 | 3.3 | 16 | D | a | 09:56:07.41 | 47:41:23.4 | 14.30 | 20.31 | 0.83 | 0.38 | Sb |
| b | 09:56:07.85 | 47:41:09.9 | 18.74 | 20.82 | 1.04 | 0.21 | Sb | ||||
| c | 09:56:09.00 | 47:41:09.0 | 17.12 | 20.53 | 0.92 | 0.42 | SB6 | ||||
| d | 09:56:07.97 | 47:41:43.2 | 19.13 | 20.43 | 0.88 | 0.32 | Sb | ||||
| RXJ0956.2+4738 | 3.2 | 19 | D | a | 09:56:15.77 | 47:38:44.7 | 7.20 | 21.93 | 1.46 | 0.49 | *Sb |
| RXJ0956.3+4716 | 3.6 | 26 | D | a | 09:56:16.16 | 47:16:49.1 | 20.00 | 19.98 | 0.73 | 1.75 | *QSO, z=1.69jjfootnotemark: |
| RXJ0956.4+4710 | 5.4 | 18 | empty | a | 09:56:29.40 | 47:10:08.5 | 8.20 | 21.45 | 1.50 | 2.24 | QSO |
| b | 09:56:28.07 | 47:10:11.7 | 7.80 | 20.88 | 1.27 | 0.44 | SB2 | ||||
| RXJ0956.6+4717 | 11.1 | 14 | M can | a | 09:56:39.65 | 47:16:52.7 | 13.10 | 15.47 | -0.57 | *M star | |
| RXJ0956.6+4734 | 1.7 | 20 | D | a | 09:56:37.90 | 47:34:50.3 | 12.30 | 20.83 | 0.75 | 1.25 | *Sc |
| RXJ0956.7+4729 | 9.5 | 33 | sat | a | 09:56:45.69 | 47:28:55.1 | 30.00 | 22.80 | 0.88 | 0.09 | Sa? |
| b | 09:56:45.72 | 47:29:10.7 | 8.60 | 19.90 | 1.12 | 0.97 | SB4? | ||||
| c | 09:56:48.01 | 47:29:41.5 | 30.00 | 19.81 | 1.09 | 0.24 | Sc? | ||||
| RXJ0956.8+4743 | 2.7 | 22 | D | a | 09:56:52.31 | 47:43:35.0 | 9.50 | 20.71 | 0.90 | 0.49 | QSO |
| b | 09:56:50.09 | 47:43:50.7 | 20.40 | 21.02 | 1.02 | 0.21 | Sa? | ||||
| RXJ0956.9+4731 | 5.0 | 17 | D | a | 09:56:55.63 | 47:31:08.2 | 9.80 | 18.57 | 0.31 | 0.34 | *SB6 |
| RXJ0956.9+4746 | 10.2 | 17 | D | a | 09:56:54.14 | 47:46:54.8 | 14.90 | 21.10 | 1.63 | 0.48 | *SB2 |
| RXJ0956.9+4759 | 2.2 | 29 | D | a | 09:56:55.42 | 47:58:43.1 | 28.50 | 18.14 | -0.21 | G star | |
| b | 09:56:55.61 | 47:59:08.1 | 4.90 | 18.76 | 0.03 | 0.33 | Sa | ||||
| c | 09:56:56.59 | 47:59:31.1 | 21.00 | 21.75 | 1.23 | M star | |||||
| d | 09:56:58.09 | 47:59:30.8 | 28.80 | 20.52 | 0.74 | 0.28 | Sb | ||||
| RXJ0957.1+4727 | 2.3 | 16 | D | a | 09:57:06.17 | 47:27:03.7 | 14.80 | 17.63 | -0.39 | M star | |
| b | 09:57:07.91 | 47:27:09.7 | 7.00 | 21.43 | 1.12 | 0.77 | SB3 | ||||
| c | 09:57:06.95 | 47:27:21.5 | 9.20 | 20.15 | 0.61 | 0.07 | Sb | ||||
| RXJ0957.2+4758 | 12.4 | 20 | D | a | 09:57:13.00 | 47:58:38.0 | 19.20 | 19.61 | 1.12 | K star | |
| b | 09:57:12.34 | 47:58:49.2 | 8.60 | 20.11 | 1.32 | 0.26 | SB4 | ||||
| c | 09:57:13.80 | 47:58:56.1 | 11.10 | 22.29 | 2.19 | M star | |||||
| d | 09:57:14.48 | 47:58:42.2 | 23.20 | 20.31 | 1.41 | 0.27 | SB2 | ||||
| b&d grp? | |||||||||||
| RXJ0957.3+4729 | 2.6 | 21 | D | a | 09:57:18.73 | 47:28:55.6 | 6.50 | 21.20 | 1.08 | 0.29 | SB6 |
| b | 09:57:17.32 | 47:28:59.8 | 19.10 | 19.07 | 0.28 | 0.16 | SB5, z=0.154jjfootnotemark: | ||||
| RXJ0957.3+4746 | 8.3 | 20 | AGN can | a | 09:57:22.56 | 47:46:04.3 | 17.78 | 22.63 | 2.16 | 0.29 | SB5 |
| b | 09:57:20.20 | 47:46:37.7 | 26.36 | 19.67 | 0.98 | 2.25 | QSO | ||||
| V | 09:57:21.37 | 47:46:04.4 | 19.94 | 23.01 | 2.31 | ? | |||||
| RXJ0957.4+4746 | 8.2 | 20 | AGN can | a | 09:57:28.42 | 47:46:00.9 | 19.80 | 20.52 | 1.31 | M star | |
| b | 09:57:30.07 | 47:46:09.3 | 6.30 | 19.38 | 0.85 | 1.76 | QSO | ||||
| RXJ0957.5+4734 | 1.0 | 29 | AGN can | a | 09:57:35.52 | 47:34:49.5 | 23.30 | 21.89 | 0.94 | 0.52 | Sa, |
| b | 09:57:35.94 | 47:34:30.0 | 19.73 | 22.80 | 1.31 | 0.40 | QSO | ||||
| RXJ0957.5+4741 | 4.4 | 18 | D | a | 09:57:32.65 | 47:41:52.1 | 7.00 | 20.14 | 0.88 | 0.81 | *QSO |
| RXJ0957.6+4716 | 3.1 | 26 | D | a | 09:57:36.57 | 47:16:25.2 | 8.60 | 20.63 | 0.93 | 0.52 | *SB6 |
| RXJ0957.6+4801 | 20.3 | 14 | AGN | a | 09:57:38.51 | 48:01:21.7 | 0.30 | 19.08 | 1.12 | 1.11 | *QSO, |
| HS0954+4815, z=0.83jjfootnotemark: | |||||||||||
| RXJ0957.7+4736 | 1.9 | 22 | st can | a | 09:57:43.72 | 47:36:09.8 | 7.90 | 16.09 | -1.09 | F star | |
| b | 09:57:44.78 | 47:36:12.8 | 14.60 | 20.04 | 0.48 | 0.31 | SB6 | ||||
| c | 09:57:42.84 | 47:36:21.7 | 7.40 | 16.74 | -0.83 | K star | |||||
| RXJ0957.7+4745 | 30.8 | 12 | AGN | a,R | 09:57:46.59 | 47:45:49.0 | 6.10 | 19.91 | 1.64 | 0.74 | *QSO, |
| CDS90-R346, FIRST J095746.6+474549,z=0.42jjfootnotemark: | |||||||||||
| RXJ0957.8+4713 | 3.1 | 27 | D | a | 09:57:52.74 | 47:13:08.0 | 23.20 | 21.28 | 1.19 | M star | |
| b | 09:57:50.41 | 47:13:12.5 | 1.00 | 19.93 | 0.65 | 0.58 | SB6 | ||||
| RXJ0957.8+4756 | 2.7 | 22 | D | a | 09:57:53.27 | 47:56:08.2 | 12.80 | 19.11 | 0.26 | K star | |
| b | 09:57:54.06 | 47:56:27.8 | 10.20 | 19.93 | 0.59 | 1.78 | QSO | ||||
| c | 09:57:53.64 | 47:56:16.8 | 5.41 | 19.49 | 0.42 | M star | |||||
| d | 09:57:51.13 | 47:56:23.7 | 21.97 | 21.06 | 1.04 | 0.77 | Sa | ||||
| RXJ0958.0+4728 | 2.8 | 22 | empty | a | 09:58:03.57 | 47:28:44.6 | 17.20 | 20.87 | 0.98 | M star | |
| b | 09:58:03.70 | 47:28:54.2 | 14.30 | 21.19 | 1.11 | 0.33 | SB6 | ||||
| RXJ0958.0+4737 | 6.9 | 16 | D | a,R | 09:58:00.63 | 47:37:34.8 | 2.20 | 20.51 | 1.23 | 0.50 | *SB5 |
| FIRST J095800.6+473734 | |||||||||||
| RXJ0958.0+4746 | 2.8 | 21 | sat | a | 09:58:01.51 | 47:46:10.7 | 13.70 | 11.80 | -2.64 | *star (saturated) | |
| RXJ0958.2+4742 | 1.8 | 17 | empty | a | 09:58:16.15 | 47:42:13.9 | 8.20 | 21.63 | 1.09 | 0.94 | *QSO |
| RXJ0958.3+4725 | 48.8 | 12 | AGN | a,R | 09:58:19.70 | 47:25:07.6 | 5.30 | 18.64 | 1.33 | 1.82 | *QSO, |
| CDS90-R351, FIRST J095819.7+472508, z=1.88jjfootnotemark: | |||||||||||
| RXJ0958.4+4739 | 2.2 | 16 | unid | a | 09:58:27.72 | 47:39:52.6 | 6.70 | 21.73 | 1.22 | 0.41 | S0? |
| b | 09:58:28.29 | 47:39:59.5 | 15.20 | 19.53 | 0.60 | 1.66 | QSO, z=1.67jjfootnotemark: | ||||
| RXJ0958.5+4738 | 32.7 | 13 | AGN | a | 09:58:33.48 | 47:38:54.7 | 4.80 | 18.44 | 1.08 | 1.45 | *QSO, z=0.42jjfootnotemark: |
| RXJ0958.5+4742 | 2.7 | 18 | empty | a | 09:58:32.65 | 47:42:13.2 | 13.50 | 21.55 | 1.24 | 0.72 | QSO |
| b | 09:58:32.27 | 47:42:32.9 | 17.30 | 21.18 | 1.09 | 0.66 | SB1 | ||||
| RXJ0958.7+4800 | 2.2 | 21 | D | a | 09:58:47.49 | 48:00:28.2 | 11.30 | 21.70 | 1.21 | 0.69 | Sa |
| b | 09:58:48.99 | 48:00:09.6 | 21.67 | 21.15 | 0.99 | 0.14 | Sb | ||||
| RXJ0958.8+4715 | 2.0 | 24 | FG can | a | 09:58:54.21 | 47:15:06.8 | 21.10 | 19.93 | 0.46 | 0.28 | SB6 |
| b | 09:58:52.45 | 47:15:06.7 | 5.90 | 13.80 | -1.98 | K star | |||||
| RXJ0958.8+4719 | 2.8 | 17 | red | a | 09:58:49.92 | 47:20:04.2 | 7.90 | 17.49 | -0.36 | K star | |
| b | 09:58:51.07 | 47:20:07.1 | 11.40 | 14.38 | -1.61 | K star | |||||
| RXJ0958.8+4744 | 1.6 | 22 | unid | a | 09:58:51.14 | 47:44:16.5 | 11.10 | 16.90 | -0.84 | 0.01 | *HII galaxy, |
| UGC 5354, z=0.0038jjfootnotemark: | |||||||||||
| RXJ0958.8+4801 | 1.5 | 24 | D | a | 09:58:51.79 | 48:00:58.2 | 21.70 | 18.94 | -0.05 | 0.10 | SB4 |
| b | 09:58:52.89 | 48:01:01.1 | 10.30 | 21.59 | 1.00 | 0.77 | Sa | ||||
| c | 09:58:54.90 | 48:01:16.7 | 17.00 | 20.25 | 0.46 | 1.95 | QSO | ||||
| d | 09:58:52.90 | 48:01:21.1 | 20.70 | 20.69 | 0.64 | 0.51 | SB6 | ||||
| e | 09:58:52.23 | 48:01:22.6 | 25.79 | 20.78 | 0.68 | 0.26 | SB6 | ||||
| RXJ0958.9+4721 | 5.4 | 17 | D | a | 09:58:53.98 | 47:20:59.3 | 15.10 | 21.20 | 1.40 | 0.29 | Sb |
| b | 09:58:54.22 | 47:21:10.0 | 4.90 | 19.88 | 0.87 | 0.09 | SB1 | ||||
| RXJ0958.9+4745 | 29.3 | 20 | star | a | 09:58:57.03 | 47:45:34.2 | 10.70 | 9.90 | -2.38 | *F8 star | |
| BD+48-1823 iifootnotetext: Redshift as obtained from the following sources: [RXJ0955.1+4729(e), RXJ0955.3+4733(d), RXJ0956.3+4716(a),RXJ0957.3+4729(b), RXJ0957.6+4801(a), RXJ0958.3+4725(a), RXJ0958.4+4739(b), RXJ0958.5+4738(a), RXJ0958.8+4744(a); this paper, Fig. 6]; [RXJ0955.0+4720(a), RXJ0957.7+4745(a); Mothagen, Wendker, & Briel, 1997, A&AS, 126, 509]. | |||||||||||