Different kinds of long-term variability from Cygnus X-1
Abstract
We present a study of the long-term variability of Cyg X-1 using data from the RXTE/ASM and the RXTE/PCA during the time between the two soft states of 1996 and 2001/2002. This period has been characterized by many short ASM flaring episodes which we have identified as ”failed state transitions”. The 150 d period which has been seen before and shortly after the 1996 soft state is not obviously present in the ASM rate during most of this time. Applying selection criteria from our pointed RXTE/PCA observations to exclude the flaring episodes we show that the 150 d period can indeed still be significantly detected in the hard state. Furthermore, while the 420 d timescale associated with the flaring is reduced in the selected hard state count rate, it is still pronounced in the temporal evolution of the corresponding hardness ratios. The Ryle radio flux is also consistent with the 150 d period being present but distorted during this time.
1 Introduction & selection criteria
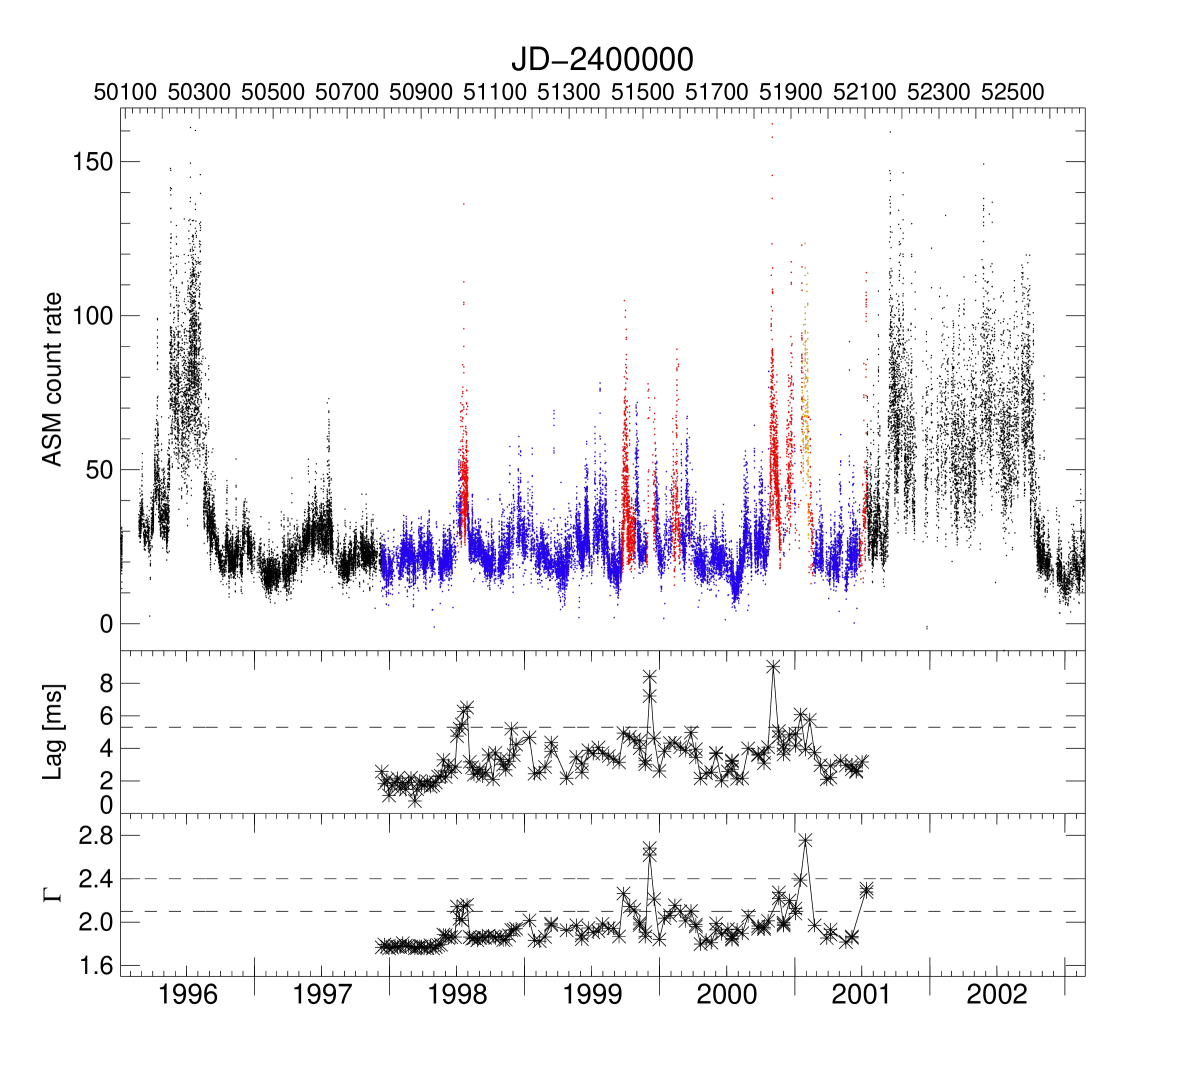
Historically several different scales of long-term variability in Cyg X-1 have been reported. Multiwavelength observations (optical, radio, hard and soft X-ray) between 1996 and 1998 established that a 150 d signature is the dominant variability timescale which is suggested to be caused by precession and/or radiative warping of the accretion disk (Pooley et al., 1999; Brocksopp et al., 1999). Recently this period has also been confirmed with earlier Ginga data (Kitamoto et al., 2000). From 1998 onwards, however, this signature is not obvious in the soft X-ray flux anymore (Fig. 1, upper panel): Although mainly in the hard state, Cyg X-1 has been more active since before, i.e., more flaring episodes during which the source can be found in the intermediate state (=failed state transitions (Pottschmidt et al., 2003)) – sometimes even reaching the soft state – have been observed. This goes together with a sharp and significant change in the properties of the short-term variability in June 1998 (Pottschmidt et al., 2003). Oezdemir and Demircan (2001) suggested to avoid the distortion of the possible periodicities in the original data introduced by the high/soft state and the failed state transitions by truncating the RXTE/ASM lightcurve at 30 cps (threshold derived from visual inspection). They report a clearer detection of the 150 d period in the 1996 to 1999 ASM data. Based on the principal idea of selecting only hard state data, we:
-
•
perform a period search for RXTE/ASM data dominated by the flare-distorted phase from 1998-2001,
-
•
use physical selection criteria derived from monitoring Cyg X-1 with RXTE/PCA since 1998,
-
•
use two statistics for unevenly sampled data (Lomb-Scargle PSD and epoch folding),
-
•
also study the variability of the RXTE/ASM colours.
Our selection criteria (lower panels of Fig. 1) are based on the photon index of the PCA spectra and the time lags (between the 2–4 and 8–13 keV flux), since they have been shown to be good diagnostics for failed state transitions (Pottschmidt et al., 2000; Zdziarski et al., 2002). and lag are interpolated from the PCA sampling to the ASM sampling. In detail the states are defined as follows: (i) the canonical hard state is characterized by hard PCA spectra with , (ii) spectra with are typical for failed state transitions, and (iii) for the softest spectra with , enhanced time lags ms also point towards a failed state transition, while “normal” time lags ms characterize the soft state.
2 Long-term variability, significances
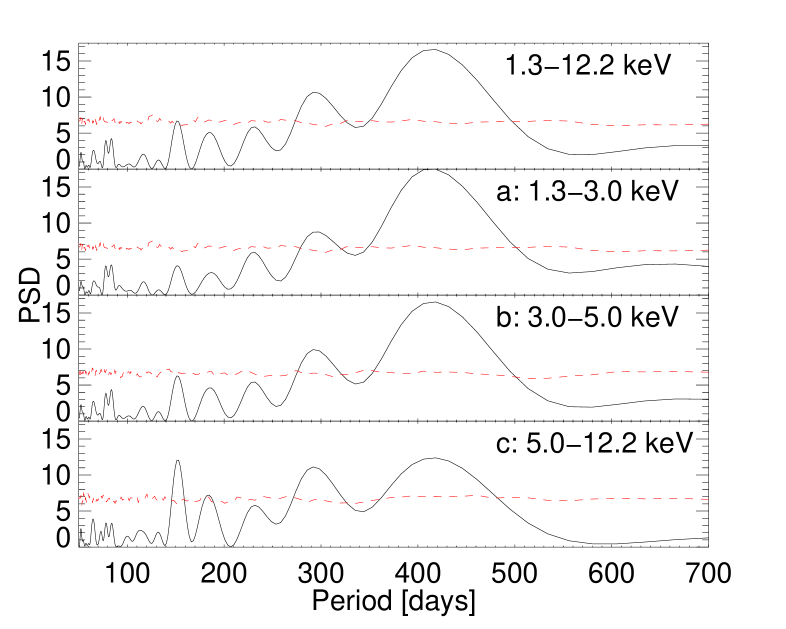
Fig. 2 shows the Lomb-Scargle periodogram (Scargle, 1982; Lomb, 1976) for all ASM data between 1997 December and 2001 July. The analysis of the total count rate as well as of the three ASM sub-bands is displayed. Prior to the analysis, the lightcurves have been rebinned to a 7 d resolution in order to avoid aliases due to the 5.6 d orbital period. The dashed lines represent the “local significance” levels for a set of 5000 Monte Carlo white noise simulations (for more details on the significance determination see (Benlloch et al., 2001)). As expected, the 150 d signature is not significantly present in the overall ASM data. Longer timescales seem to be more prominent especially a broad peak around 420 d (of course, increasingly fewer cycles are covered). However, there is already an indication here that the 150 d period is still present from the data in the 5-12 keV energy band, also strengthening the idea of possible inner disk / radio jet coupling.
3 Is the 150 d scale still there?
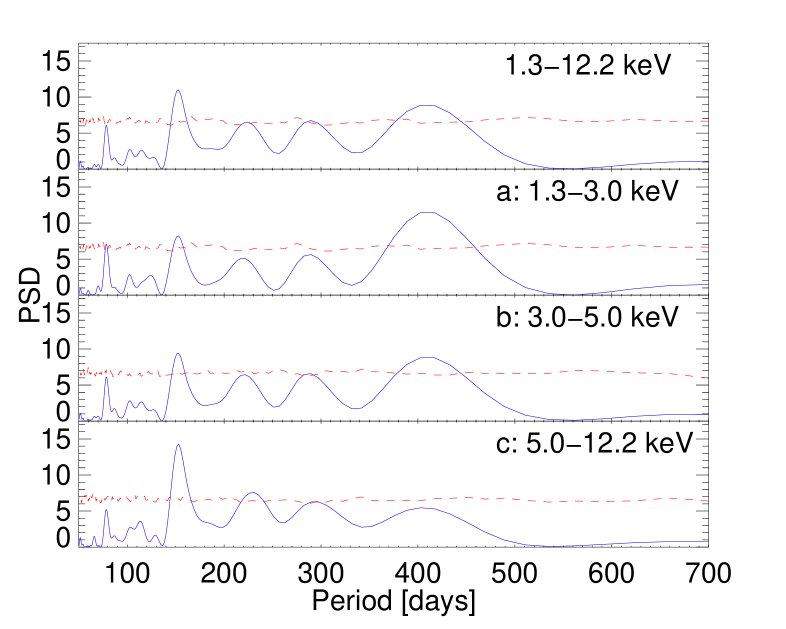
After applying the selection criteria described above to keep only the hard state data, two types of changes are apparent from the resulting Lomb-Scargle PSDs (Fig.3): the significance of the 150 d period increases in all energy bands and it can now be significantly detected in the total count rate. In parallel the opposite behavior is displayed by the 420 d component: compared to the unselected dataset its significance decreases in all energy bands, most strongly in the hardest band where it decreases below the given significance level. These two trends lead to the 150 d signature being the most prominent timescale of the total ASM rate in the cleaned hard state. Its presence is also confirmed by the results of an epoch folding period search, see Fig.4.

4 Confirmation from the radio flux
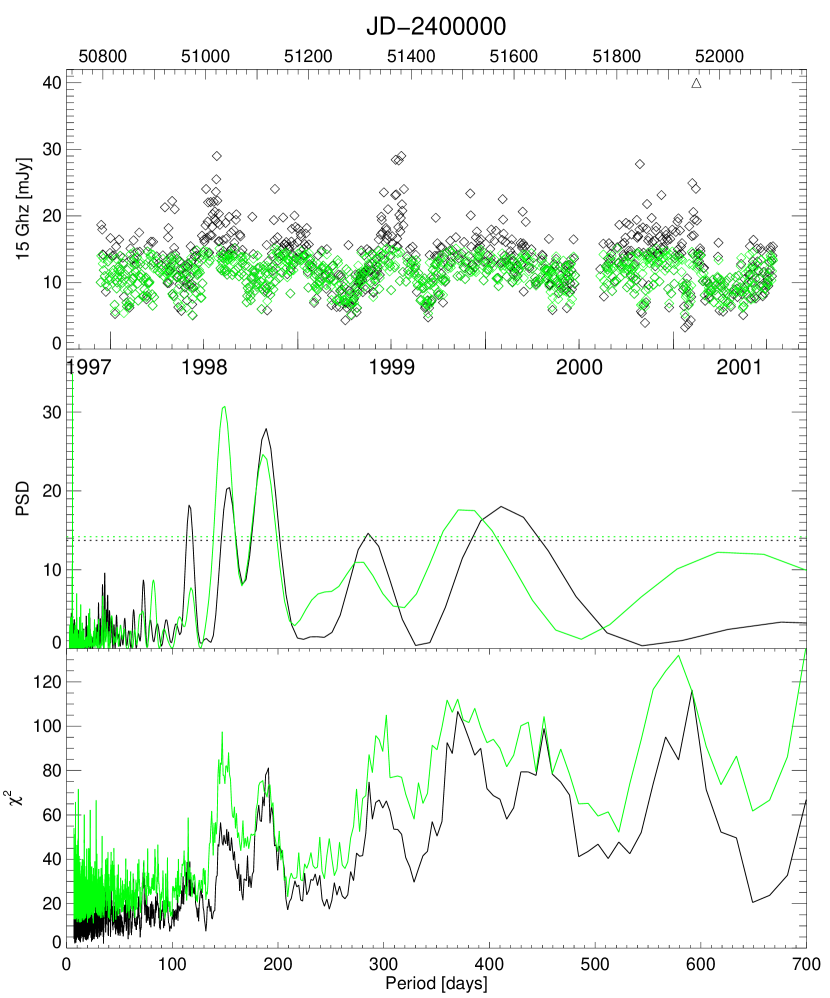
While the analysis of the overall 15 GHz radio lightcurve – performed over the same time interval as the ASM analysis – does show the presence of the 150 d signature as a formally significant timescale, other nearby timescales arise with comparable significance (Fig. 5, dark symbols and lines). Since we are studying a non-canonical hard state (changed short-term X-ray variability (Pottschmidt et al., 2003)) it is not a priori clear that a selection based on the X-ray states is also appropriate for the radio emission – although the tendency for radio flaring during failed state transitions is known. In this first approach we thus use a flux selection criterion (5 mJy Ryle flux 15 mJy) and find that it helps to better work out the 150 d timescale (Fig. 5, light symbols and lines). The overall picture of the 150 d period being present but buried by the flaring activity is thus consistent. However, from this radio dataset alone and using the preliminary flux selection criterion one could not determine the physical reality of the 150 d period as compared to, e.g., the 190 d variability. Note that a 1d-binned-lightcurve was analyzed here – leading to the presence of the 5.6 d orbital period in the PSD – and that the described effects are also present using 7d-bins, but are less pronounced.
5 A different spectral timescale?
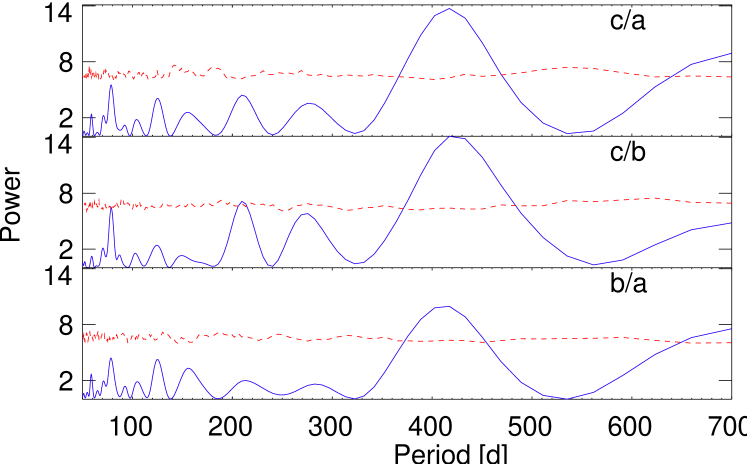
It is also interesting to perform the same period search on the ASM colours, applying the hard state selection criteria (Fig. 6): the 150 d period is not visible at all, while the 420 d timescale is clearly dominating. We cautiously suggest that while the 150 d period is a pure intensity variation, there might be another characteristic timescale driving the soft X-ray flux, associated with spectral changes. Note that this is true even after removing the failed state transitions themselves.
References
- Pooley et al. (1999) Pooley, G. G., Fender, R. P., and Brocksopp, C., MNRAS, 302, L1 (1999).
- Brocksopp et al. (1999) Brocksopp, C., Fender, R. P., Larianiov, V., Lyuty, V. M., Tarasov, A. E., Pooley, G. G., Paciesas, W. S., and Roche, P., MNRAS, 309, 1063 (1999).
- Kitamoto et al. (2000) Kitamoto, S., Egoshi, W., Miyamoto, S., Tsunemi, H., Ling, J. C., Wheaton, W. A., and Paul, B., ApJ, 531, 546–552 (2000).
- Pottschmidt et al. (2003) Pottschmidt, K., Wilms, J., Nowak, M. A., Pooley, G. G., Gleissner, T., Heindl, W. A., Smith, D. M., Remillard, R., and Staubert, R., A&A, 407, 1039–1058 (2003).
- Oezdemir and Demircan (2001) Oezdemir, S., and Demircan, O., Ap&SS, 278, 319–325 (2001).
- Pottschmidt et al. (2000) Pottschmidt, K., Wilms, J., Nowak, M. A., Heindl, W. A., Smith, D. M., and Staubert, R., A&A, 357, L17–L20 (2000).
- Zdziarski et al. (2002) Zdziarski, A. A., Poutanen, J., Paciesas, W. S., and Wen, L., ApJ, 578, 357–373 (2002).
- Scargle (1982) Scargle, J. D., ApJ, 263, 835 (1982).
- Lomb (1976) Lomb, N. R., Ap&SS, 39, 447–462 (1976).
- Benlloch et al. (2001) Benlloch, S., Wilms, J., Edelson, R., Tahir, Y., and Staubert, R., ApJ, 562, L121–L124 (2001).