Two Years of Observations of the X-ray Pulsar SMC X-1 with the ART-P Telescope onboard the Granat Observatory
Abstract
We present the observations of the pulsar SMC X-1 with the ART-P
telescope onboard the Granat observatory. We investigate the variability of
the flux from the source on time scales of several tens
of days. The intensity variation of the pulsar are shown to be consistent
with the presence of a periodicity in the system with a characteristic time
scale of days. The precession of an inclined accretion disk, as
indirectly confirmed by the absence of low-state pulsations, may be
responsible for the observed variability. The spectrum of the source is well
described by a power-law energy dependence of the photon flux
density with a slope of and an exponential cutoff at energies
above keV. We estimated the inclinations between the planes of
the orbit and the accretion disk and the magnetic field of the neutron
star.
©2004 MAIK ”Nauka/Interperiodica”.
Keywords: pulsars, neutron stars, X-ray sources
Astronomy Letters, Vol.30, No. 1, 2004, pp.50-57. Translated from Pis’ma v Astronomicheskii Zhurnal, Vol. 30, No. 1, 2004, pp. 58-66. Original Russian Text Copyright ©2004 by Lutovinov, Tsygankov, Grebenev, Pavlinsky, Sunyaev.
Space Research Institute, Moscow, Russia1
Max-Plank-Institut für Astrophysik, Garching, Germany2
INTRODUCTION
The X-ray pulsar SMC X-1 located in one the nearest galaxies, the Small Magellanic Cloud (SMC), is one of the most intense and rapidly rotating accreting X-ray pulsars. The source, which was first discovered in X-rays in 1971 (Price et al. 1971), is a member of a high-mass binary together with the companion star Sk160, a B0-type supergiant with a mass of and a radius of (Reynolds et al. 1993). On short time scales, its flux pulsates with a period of about 0.71 s, while the neutron star itself is eclipsed by its companion for h (the duration of the X-ray eclipse) with a period days. Analyzing the results obtained over the entire preceding history of observations of this source, Levine et al. (1993) determined the orbital parameters of the binary and established that its orbital period is decreasing at a rate . Apart from the rotation period of the neutron star and the orbital period, the observations are indicative of a 50-60 day cycle in the binary (Wojdowski et al. 1998), during which the X-ray luminosity of the source varies between erg s-1 and several units of erg s-1. The latter value is close to or even higher than the Eddington limit for a spherically accreting neutron star with a mass of . This fact as well as the observed steady spinup of the neutron star for the more than 30 years since the discovery of the pulsar (see, e.g., Wojdowski et al. 1998; Bildsten et al. 1997; Lutovinov et al. 1994; and references therein) suggest that a disk accretion model is most likely realized in the Sk160/SMCX-1 system; the accretion disk itself can be formed either from stellar wind or during mass transfer through the inner Lagrangian point. Analyzing the EXOSAT light curves for the pulsar SMC X-1, Angelini et al. (1991) found a sharp (by a factor of ), short-time increase in the flux from this source with a duration of s, which they interpreted as a type-II X-ray burst. Recent RXTE observations of the pulsar have revealed more than a hundred such events with time scales of several tens of seconds (Moon et al. 2003), suggesting that the radiation and accretion mechanisms in the source SMC X-1 under study and the pulsar/burster GRO J1744 28 are similar. In this paper, we analyze the archival data obtained with the ART-P telescope onboard the Granat observatory to study the long-term flux variations of the source as well as its temporal and spectral parameters.
OBSERVATIONS
The ART-P X-ray telescope onboard the Granat international orbital astrophysical observatory consists of four coaxial, completely independent units, each of which includes a position-sensitive detector with a geometric area of 625 cm2 and an URA-based coded mask. The telescope can image a selected region of the sky by a coded-aperture technique in a field of view (the full beam width) with a nominal resolution of arcmin in the energy range 3-60 keV. It has an energy resolution of in the calibration 5.9-keV iron line. The observations were carried out in the photon-flux mode. In this mode, for each photon, its coordinates on the detector, the energy (1024 channels), and the arrival time (the accuracy of the photon arrival time is 3.9 ms, and the dead time is 580 s) were written to buffer memory. This mode allows one to perform both timing and
Table 1. ART-P observations of the pulsar SMC X-1 in
1990-1992 .
Data
Dura-,
Orbital
Pulsation period,
Pulse fraction,
Flux,
Luminosity,
tion,s
phase
s
%
mCrab
erg s-1
05.04.90
30750
0.33-0.46
–
22.04.90
34490
0.65-0.77
24.04.90
12750
0.19-0.23
25.04.90
8300
0.42-0.45
11.05.90
17040
0.52-0.59
12.05.90
44230
0.75-0.91
25.01.91
8240
0.08-0.11
13.04.91
12060
0.09-0.14
14.04.91
28340
0.38-0.46
21.04.91
6250
0.13-0.16
22.04.91
34320
0.43-0.56
17.05.92
15110
0.86-0.92
–
18.05.92
19200
0.17-0.26
| After correction for the motion of the Solar-System barycenter and the orbital motion in the binary. | |
| In the energy range 6 20 keV. | |
| In the energy range 6 20 keV for the assumed distance of d = 50 kpc to the source. | |
| For technical reasons, the spectrum of the source cannot be restored. | |
| The upper limit for the pulse fraction is given in mCrab. |
spectral analyses of the radiation from each X- ray source within the field of view of the telescope. A detailed description of the telescope was given by Sunyaev et al. (1990).
The Granat observatory observed the region of the SMC that contained the pulsar SMC X-1 in series once a year (Table 1). A total of three series of observations with a total exposure time of s were carried out for the source, which allowed us to study in detail the radiation from the pulsar as well as its spectrum and variability on various time scales. Preliminary results of our timing analysis of the ART- P/Granat observations of the pulsar SMC X-1 were presented previously (Lutovinov et al. 1994). The typical pulse profile for the source in the energy ranges 3-6, 6-10, 10-20, and 20-30 keV (Fig. 1) exhibits two symmetric peaks located in the phase ranges 0.1-0.4 and 0.5-1.0, with the width of the second peak decreasing with increasing photon energy.
It should be noted that during the first series of observations (in the spring of 1990), we used the first module of the telescope. The subsequent observations were performed with the third module, which had a lower sensitivity at soft energies; therefore, all of the results presented here refer to the energy range 6-20 keV. In addition, the high-voltage level of the detector of this module varied significantly over time, and it was not always possible to carry out calibration observations of the Crab Nebula. As a result, we ran into considerable difficulties in constructing the response matrix for some of the observing sessions, making it difficult or, in several cases, even impossible to carry out a spectral analysis of the X-ray radiation recorded with this module.
LONG-TERM INTENSITY VARIATIONS OF THE SOURCE AND BURSTS
As was noted above, the long-term observations of SMC X-1 showed that, apart from the proper rotation of the neutron star and its orbital motion, the system has another, nearly periodic component-intensity variability of the source on a time scale of several days, with the recorded X-ray flux decreasing by more than an order of magnitude. A similar pattern is also observed in the other two well-known X-ray pulsars Her X-1 and LMC X-4, where it is attributable to periodic eclipses of the emitting regions of the neutron star by a precessing accretion disk (Lutovinov et al. 2000; La Barbera et al. 2001; and references therein). It is assumed that the same mechanism may also be responsible for the observed intensity variations in the pulsar SMC X-1.
To determine the precession period of the accretion disk, we fitted the ART-P data by a sinusoidal signal with a trial period varying in the range of 40-80 days. The deviations of the measured fluxes from their predicted values were determined by the least-squares method. The best value was obtained for a period days. This period agrees with the results by Wojdowski et al. (1998), who found long-term variations in the X-ray flux from SMC X-1 with a period of 50-60 days when simultaneously analyzing the ASM/RXTE and BATSE/CGRO data. The limited set of data (observing sessions) makes it impossible to completely cover the entire presumed period. Therefore, our period estimate is not an accurate and statistically significant measurement of the possible precession period (the statistical significance of the peak on the periodogram is ). It most likely gives circumstantial evidence for the presence of a third type of periodicity in the system and the possible mechanism of its formation (see below).
The analysis of the light curve for the source by Clarkson et al. (2003) shows that the presumed precession period is not constant in itself, but varies smoothly over an interval of 40-60 days with a characteristic time scale of days.
Figure 2 shows the light curve for SMC X-1 constructed over two years of ART-P observations in the energy range 6-20 keV. The dots with () error bars indicate the measured fluxes from the source in mCrab during individual observing sessions, and the solid line represents their best sinusoidal fit with a period of days. It is undoubtedly of considerable interest to compare the phases of the light curves obtained simultaneously with the ART-P telescope and the BATSE observatory. However, the quality of the latter in this period was too low to make such a comparison (see Fig.1 from Wojdowski et al. 1998). A comparison with more recent RXTE observations of the pulsar has revealed no correlation with our results, which is most likely attributable to the variability of the precession period (see above).
When analyzing the light curves for the presence of X-ray bursts, we found several events that were similar to those recorded by the RXTE observatory (Moon et al. 2003) and that could be interpreted as weak type-II bursts. Note that the statistical significance of the recorded events is low, . However, their roughly triangular shapes and HWHM of s obtained by Gaussian fitting are similar to those observed previously. Figure 3 shows the profile of one of such bursts.
SPECTRAL ANALYSIS
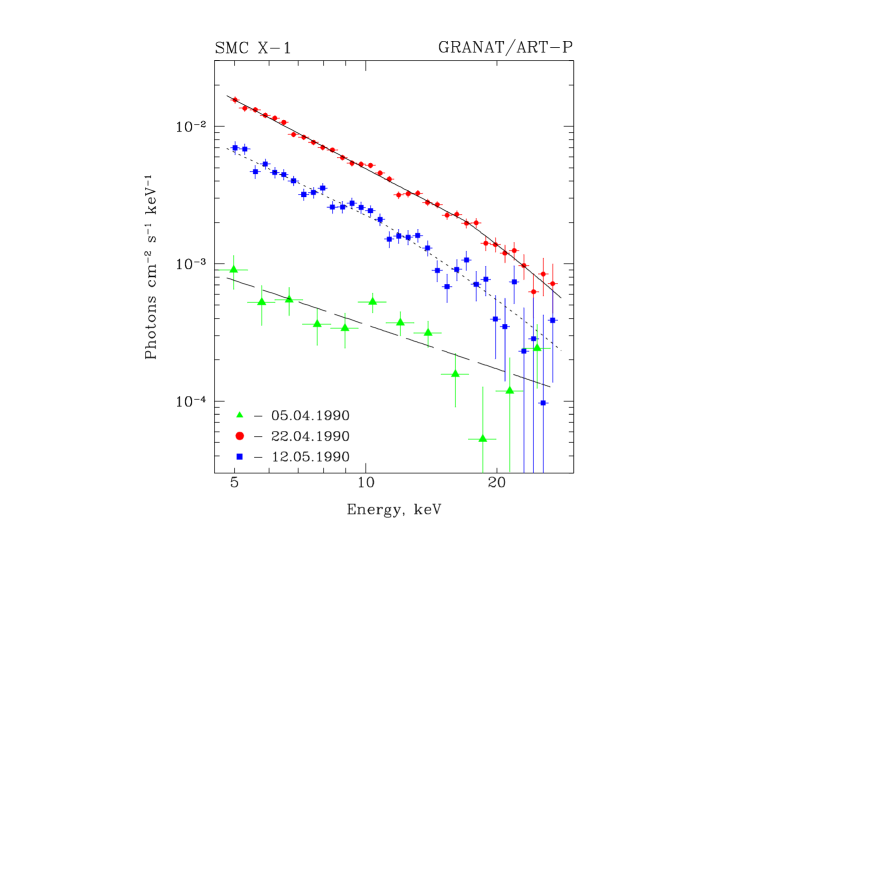
The spectrum of the X-ray pulsar SMC X-1 is typical of this class of objects and can be described by a simple power law. In general, depending on the specific source, this model is modified by an exponential cutoff at high energies, absorption at soft energies, and emission or absorption lines. In the case of SMC X-1, we did not detect any significant features in emission or absorption. In addition, as our study shows, the interstellar absorption estimated by different authors to be in a wide range, atoms cm-2 (Wojdowski et al. 1998; Moon et al. 2003), plays no important role in our analysis of the radiation from the X-ray source in the energy range 6-20 keV. Thus, the ultimate formula that we used in our spectral analysis of the radiation from SMC X-1 is
| (1) |
Here, E is the photon energy in keV, is the normalization of the power-law component to 10 keV, is the photon spectral index, is the cutoff energy, and is the characteristic e-folding energy in the spectrum of the source (although this is a purely empirical formula with a cutoff at , it is widely used to fit the spectra of X-ray pulsars; see White et al. (1983)).
Figure 4 shows the photon spectra for the pulsar (in photons cm-2 s-1 keV-1) measured during several observing sessions with different intensity levels. The curves represent the best-fit model spectra for the source based on a simple power law or formula (1); the best-fit parameters are given Table 2. In choosing between a simple power law and its modification by a cutoff at high energies, we used the -test. Based on this test, we determined the probability that it was no accident that the value improved when passing to a more complex model. The statistical significance of this passage is higher than 95% in most cases.
If we assume that the low state is observed when the source is hidden behind the outer edge of a warped or inclined (to the orbital plane) accretion disk and that we see the flux attenuated by absorption and scattering in the cold material on the disk periphery or scattered in the hot corona above the disk (as is the case in the system Her X-1 (Lutovinov et al. 2000)), then, to a first approximation, the spectra of the high and low states may be considered to differ only by normalization and additional absorption. Fitting the low-state spectrum of the pulsar (April 5, 1990) by formula (1) with the parameters fixed at their high- state values does not give a positive answer to the above assumption (an appreciable increase in ). However, it cannot be completely rejected either, because the data are statistically limited. In this case, an important criterion could be an increase in absorption at low energies. However, we cannot be certain about this, because the energy range is limited: the measured absorption in the low state is estimated to be atoms cm-2, while the upper limit for the absorption is atoms cm-2 ().
To investigate the spectral evolution of the source on a scale of one pulse period, we performed phase- resolved spectroscopy of the pulsar radiation in the high state for two observing sessions, April 24 and May 11, 1990. To this end, the data obtained during each observing session were folded with the pulsation period and divided into 12 time bins (the arrival time of each photon was first corrected for the barycenter of the Solar System and the motion of the neutron star in the binary). The total accumulation time of the signal for each of the 12 spectra was 1137 and 1568 s for the sessions of of April 24 and May 11, respectively. The subsequent analysis indicated that the spectra obtained in this way are well described by a simple power law in the energy range 6-20 keV; the spectral slope is virtually independent of the pulse phase. This conclusion is illustrated by Fig. 5, which shows a plot of the photon spectral index against the pulse phase for the observing session of April 24.
DISCUSSION
High and Low States
It follows from the observations of SMC X-1 by different observatories that the recorded X-ray flux from this pulsar is not constant but undergoes large, nearly periodic variations on a time scale of 50- 60 days. By analogy with the well-known binaries SS 433, Her X-1, and LMC X-4, which exhibit a similar pattern, the precession of an inclined accretion disk is considered to be one of the main causes of the observed variability. The normal companion Sk160 in the binary under consideration is a supergiant with an intense stellar wind that provides the bulk of the accreting material forming
Table 2. Best-fit parameters for the spectra based on different models
| Date | PL | PL+HEC | ||||||
| , | , | , | , | |||||
| keV | keV | |||||||
| 05.04.90 | 1.28(11) | 1.16(9) | ||||||
| 22.04.90 | 1.43(32) | 1.09(30) | ||||||
| 24.04.90 | 1.35(34) | 1.09(32) | ||||||
| 25.04.90 | 1.14(26) | 1.02(24) | ||||||
| 11.05.90 | 1.37(32) | 0.73(30) | ||||||
| 12.05.90 | 1.27(32) | 1.15(30) | ||||||
| 25.01.91 | 0.45(7) | – | – | – | – | – | ||
| PL–a power-law spectrum, HEC–a high-energy cutoff. | |
|---|---|
| The flux in photons cm-2 s-1 keV-1 measured at 10 keV. | |
| The value normalized to the number of degrees of freedom. |
the accretion disk. The mechanism of its formation is not yet completely understood, because, in general, supergiants are close to filling their Roche lobes and material can be transferred to the compact object through the inner Lagrangian point. Both mechanisms may operate in the system simultaneously. It should be noted, however, that, according to Clarkson et al. (2003), even if the stellar wind plays a major role in the formation of the disk, it is a collimated wind, and, thus, the two cases are characterized by similar patterns of mass transfer to the accretion disk.
Larwood (1998) showed that a relation exists between the precession period and the binary parameters for a precessing accretion disk:
| (2) |
where is the mass ratio of the normal component and the compact object; is the outer radius of the accretion disk, which may be expressed in fractions of the Roche lobe size; is the separation between the binary components; and is the angle between the orbital and disk planes. It follows from an analysis of the optical light curves for Sk160/SMC X-1 (Howarth 1982; Khruzina and Cherepashchuk 1987) that the size of the accretion disk is . For the mass ratio and periods , we can estimate the range of possible inclinations, . The minimum angle between the orbital and disk planes, , corresponds to an accretion-disk size of , which slightly exceeds the maximum disk radius, , obtained by Paczynski (1977) for accretion only through the inner Lagrangian point. This discrepancy is even larger if we take into account the range of possible precession periods. Thus, mass transfer from the normal companion only through the inner Lagrangian point in the system Sk160/SMC X-1 is unlikely.
As was noted above, no X-ray pulsations were found during the low state of the source, and only upper limits for the pulse fraction were obtained (Table 1). However, since these limits are rather large, we cannot completely rule out the presence of pulsations in the low state. Wojdowski et al. (1998) presented ROSAT measurements of the pulsation period in the low state. However, they stipulate that these measurements were made at the very beginning of the low state, when the source may have not yet been completely shielded by the disk. A similar situation was probably observed by the ART-P telescope on May 18, 1992, when the intensity of the source was low, but X-ray pulsations were recorded with low statistical significance ().
Magnetic Field
Based on the observed parameters of SMC X-1 obtained over a long observing period, we can try to estimate the magnetic field of the neutron star in the system by using the model of an accretion disk suggested by Li and Wang (1996).
The history of measurements of the pulsation period for SMC X-1 is indicative of a virtually uniform spinup of the neutron star since its discovery. The mean rate of change of the period during our observations in the period 1990-1992 was s yr-1. Subsequent ROSAT, ASCA, and RXTE observations of the source yield a similar value, s yr-1 (Wojdowski et al. 1998). Thus, assuming that the observed variability of the source is not related to the variations in the intrinsic radiation from the pulsar, but is determined by extraneous effects, we estimated its bolometric luminosity from the observed spectral parameters as erg s-1.
In a situation where the neutron star spins up almost uniformly over a long time interval, the change in its rotation period is related to the binary parameters by the equation
| (3) |
where is the accretion rate; is the moment of inertia of the star; is the inner edge of the accretion disk, which in our model is assumed to be equal to the Alfven radius ; is the dimensionless angular momentum; and is the speed parameter. The latter depends on the angular velocities and of the neutron star and the material at the inner edge of the accretion disk, respectively. We estimated the moment of inertia of the neutron star from the relation and assumed that its radius is cm, the mass is .
The magnetic moment of the neutron star estimated using formula (3) shows that the best agreement with the experimental data is achieved for G cm3, which is equivalent to a neutron-star surface magnetic field of G. This conclusion about the relative weakness of the magnetic field is consistent with the observation of bursts from the source that can be classified as type-II bursts (see Moon et al. 2003). Moon et al. (2003) also established that these bursts have much in common with the bursts observed previously from another super-Eddington pulsar, GRO J1744-28. They suggested separating out the so-called group of pulsars/bursters with magnetic fields of G. Another important argument for this hypothesis is the absence of cyclotron features in the spectrum of the source in the energy range 3-100 keV, which corresponds to magnetic fields of G.
Note that the applicability of the model under consideration at large is limited by the fact that the speed parameter reaches the critical value at which the angular momentum is not transferred to the neutron star. Having reached this level, the pulsar must pass from spinup to spindown, which is not observed for SMC X-1. The fact that approaches G cm3 means that the speed parameter falls within the range of critical values .
CONCLUSIONS
The X-ray pulsar SMC X-1 was repeatedly observed in 1990-1992 with the ART-P telescope onboard the Granat observatory. Over this period, we accumulated the data that allowed us to investigate the variability of the source on various time scales and its spectrum and to estimate the binary parameters.
We showed that, apart from the periodicities associated with the proper rotation of the neutron star and the orbital motion, the system has yet another, nearly periodic component that may be associated with the precession of the accretion disk. Its period days, as inferred from the ART-P data, agrees well with the observations of other observatories.
The spectrum of the source is typical of X-ray pulsars and can be described by a simple power law with a cutoff at high energies. Our analysis showed that the spectral shape depends weakly on the orbital phase and intensity of the source. Phase-resolved spectroscopy of the radiation from the source in the high state revealed no dependence of the spectral slope on the pulse phase either.
The above estimates of the magnetic field for the neutron star show that its strength must be G to be consistent with the observational data (the spinup rate the star, X-ray bursts, and the absence of cyclotron features in the spectrum).
This work was supported by the Russian Foundation for Basic Research (project no. 02-02-17347), the Ministry of Industry and Science (grant no. NSh-2083.2003.2 from the President of Russia), and the Nonstationary Phenomena in Astronomy Program of the Russian Academy of Sciences. We are grateful to M. Revnivtsev for their discussions and valuable remarks. We wish to thank Flight Director K.G. Sukhanov; the staffs of the Lavochkin Research and Production Center, RNIIKP, and the Deep Space Communications Center in Evpatoria; the Evpatoria team of the Space Research Institute (Russian Academy of Sciences); the team of I.D. Tserenin; and B.S. Novikov, S.V. Blagii, A.N. Bogomolov, V.I. Evgenov, N.G. Khavenson, and A.V. D’yachkov from the Space Research Institute who operated the Granat Observatory, provided the scientific planning of the mission, and performed a preliminary processing of telemetry data. We also wish to thank the team of M.N. Pavlinsky (Space Research Institute) and the staff of the former Research and Development Center of the Space Research Institute in Bishkek who designed and manufactured the ART-P telescope.
REFERENCES
L. Angelini, L. Stella, and N. White, Astrophys. J. 371, 332 (1991).
A. La Barbera, L. Burderi, T. Di Salvo, et al., Astrophys.J. 553, 375 (2001).
L. Bildsten, D. Chakrabarty, J. Chiu, et al., Astrophys.J., Suppl. Ser. 113, 367 (1997).
I. Howarth, Mon. Not. R. Astron. Soc. 198, 29 (1982).
T.S. Khruzhina and A.M. Cherepashchyuk, Astron.Zh. 64, 345 (1987) [Sov. Astron. 31, 180 (1987)].
J. Larwood, Mon. Not. R. Astron. Soc. 299, L32 (1998).
A. Levine, S. Rappoport, J. Deeter, et al., Astrophys.J. 410, 328 (1993).
X.-D. Li and Z.-R. Wang, Astron. Astrophys. 307, L5 (1996).
A.A. Lutovinov, S.A. Grebenev, R.A. Sunyaev, and M.N. Pavlinsky, Pis’ma Astron. Zh. 20, 631 (1994) [Astron. Lett. 20, 538 (1994)].
A.A. Lutovinov, S.A. Grebenev, M.N. Pavlinsky, and R.A. Sunyaev, Pis’ma Astron. Zh. 26, 803 (2000) [Astron. Lett. 26, 765 (2000)].
D.-S. Moon, S. Eikenberry, and I. Wasserman, Astrophys.J. Lett. 582, L91 (2003).
F. Nagase, Publ. Astron. Soc. Jpn. 41, 1 (1989).
R. Price, D. Groves, R. Rodrigues, et al., Astrophys.J. Lett. 168, L7 (1971).
A. Reynolds, R. Hilditch, W. Bell, and G. Hill, Astron. Astrophys. 261, 337 (1993).
E. Schreier, R. Giacconi, H. Gursky, et al., Astrophys.J. Lett. 178, L71 (1972).
R. A. Sunyaev, S. I. Babichenko, D. A. Goganov, et al., Adv. Space Res. 10 (2), 233 (1990).
N. White, J. Swank, and S. Holt, Astrophys. J. 270, 711 (1983).
P. Wojdowski, G. W. Clark, A. M. Levine, et al., Astrophys. J. 502, 253 (1998).
Translated by A. Dambis