ISAAC/VLT observations of a lensed galaxy at ††thanks: Based on observations collected with the ESO VLT-UT1 Antu Telescope (70.A-0355, 271.A-5013), the Hubble Space Telescope (HST) and the CFHT.
We report the first likely spectroscopic confirmation of a galaxy from our ongoing search for distant galaxies with ISAAC/VLT. Galaxy candidates at are selected from ultra-deep images in the core of gravitational lensing clusters for which deep optical imaging is also available, including HST data. The object reported here, found behind Abell 1835, exhibits a faint emission line detected in the band, leading to when identified as Ly, in excellent agreement with the photometric redshift determination. Redshifts are very unlikely for various reasons we discuss. The object is located on the critical lines corresponding to z9 to 11. The magnification factor ranges from 25 to 100. For this object we estimate M⊙yr-1 and M⊙ yr-1, both uncorrected for lensing. The steep UV slope indicates a young object with negligible dust extinction. SED fits with young low-metallicity stellar population models yield (adopting ) a lensing corrected stellar mass of M⊙, and luminosities of L⊙, corresponding to a dark matter halo of a mass of typically M⊙. In general our observations show that under excellent conditions and using strong gravitational lensing direct observations of galaxies close to the “dark ages” are feasible with ground-based 8-10m class telescopes.
Key Words.:
Galaxies: high-redshift – Galaxies: evolution – Galaxies: starburst – Galaxies: active – Infrared: galaxies1 Introduction
Spectacular progress during the last decade has permitted direct observations of galaxies and quasars out to redshifts (Hu et al. 2002, Fan et al. 2003, Kodaira et al. 2003), or in other words over more than 90 % of cosmic time. With the exception of the cosmic microwave background, direct exploration of more distant objects has so far been hampered by the need for observations beyond the optical domain, and technical difficulties related to near-IR observations of such faint objects. However, by combining a strong magnification of background galaxies by well known gravitational lensing clusters with present-day near-IR instruments on 8-10m class telescopes such an attempt appears feasible (Schaerer & Pelló 2002; Pelló et al. 2003). We present here the first spectroscopic results obtained from our prototype observational program with ISAAC/VLT on one of our best galaxy candidates.
In Sect. 2 we summarize the observational strategy adopted in the present study, and we present the photometric and spectroscopic characteristics of this object. The redshift identification is discussed in Sect. 3. The physical properties of this galaxy and implications of our finding are briefly discussed in Sect. 4.
2 Strategy, observations, and redshift determination
To search for galaxy candidates at very high redshift () we used the following strategy. We apply the traditional Lyman drop-out technique (Steidel et al. 1996) to deep optical images. At redshift the main spectral discontinuity is due to the Gunn-Peterson (GP) trough, i.e. the nearly complete absorption of the flux shortward of Ly (1216 Å), due to the large neutral H column density in the intergalactic medium (IGM). In practice we search for objects which are non-detected in optical () bands. In addition we require a detection in , , and , a fairly red due the appearance of the GP trough in , and a blue colour corresponding to an intrinsically blue UV restframe spectrum such as expected for UV bright starbursts. These criteria, devised from simulations based on synthesis models at different metallicities (Schaerer & Pelló 2002, Schaerer 2003, Pelló et al. 2003) allow us to select galaxies with redshifts between 7 and 10. Furthermore the detection in at least two bands longward of Ly and the combination with the above colour criterion allows us to avoid contamination by cool stars.
2.1 Photometry
Ultradeep JHKs imaging of the central arcmin2 of the lensing cluster Abell 1835 () was obtained at ESO/VLT with the near-IR imager and spectrograph ISAAC in February 2003. The total exposure times and the – excellent – seeing conditions are given in Table 1. Indeed, a large fraction of the total exposure time in H and Ks was obtained under excellent seeing conditions, with 74 % of the data below in H and 84 % below in Ks. Photometric data were complemented by deep observations taken at the Canada-France Hawaii Telescope (see Table 1) and band (F702W) WFPC2/HST images (Programme ID:8249, PI: Kneib, exposure time 7.5 ksec). Near-IR images were combined and stacked following a procedure similar to the one used by Labbe et al. (2003), which is well suited for point sources like the ones expected here. Some modifications were adopted to improve the background subtraction within a cluster of galaxies. Photometry was performed on a 1.5 arcsec aperture using the SExtractor package (Bertin & Arnouts 1996). Instead of adopting the SExtractor error bars, which are based on sky noise only, we have computed more realistic background noise statistics by randomly sorting 200 blank regions of 1.5 arcsec aperture on the neighbouring sky area 10 arcsec around the object. The resulting error estimates (adopted in Table 1) are larger by 0.1 mag () and 0.2 mag () than the SExtractor values. The above procedure has also been used to derive the random noise within apertures used to constrain the limiting magnitudes in the filters where the object is not detected. We have also checked that all the optical and near-IR colors for cluster galaxies and, in particular the versus color-color diagram, are fully compatible with the expected values for galaxies. A more detailed report of these observations and analysis of the photometric data will be published elsewhere (Richard et al. in preparation).
| Filter | seeing | mag | mag | ||
|---|---|---|---|---|---|
| [m] | [ksec] | [′′] | [Vega] | [AB] | |
| V | 0.54 | 3.75 | 0.76 | 28.5 | 28.6 |
| R | 0.66 | 5.4 | 0.69 | 28.5 | 28.7 |
| I | 0.81 | 4.5 | 0.78 | 27.6 | 28.1 |
| J | 1.26 | 6.48 | 0.65 | 25.83 1.00 | 26.77 1.00 |
| H | 1.65 | 13.86 | 0.5 | 23.59 0.25 | 25.00 0.25 |
| Ks | 2.16 | 18.99 | 0.38 | 23.64 0.36 | 25.51 0.36 |
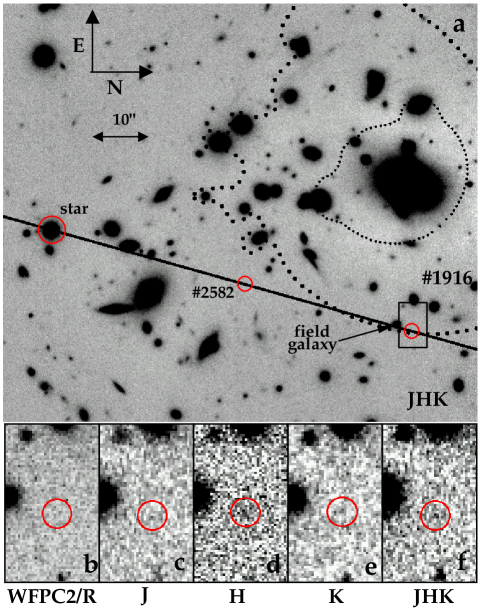
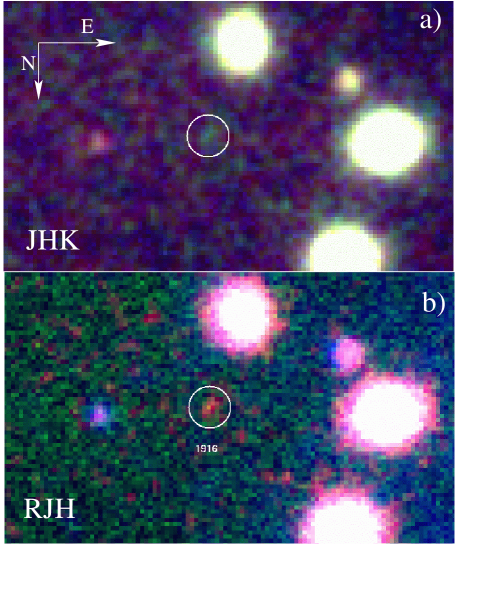
Applying the above search criteria has provided six galaxy candidates in the observed field. Among them, the best candidate (called #1916 hereafter) was retained for subsequent follow-up spectroscopy. The coordinates of this object are 14:01:00.06, +02:52:44.1. The location and broad-brand spectral energy distribution (SED) of #1916 are shown in Figs. 1 and 3; photometric data is given in Table 1. The radius of the circles in the thumbnail images in Fig. 1 is similar to the aperture used to compute magnitudes. Limiting magnitudes adopted in Table 1 correspond to a detection limit of 1 within the near-IR reference seeing aperture (), which is roughly equivalent to a detection limit of 3 within a region equivalent to 4 ISAAC pixels. The source is not detected on the WPC2/HST F702W image with 27.3 mag at 2 on 4 HST pixels. Figure 2 shows the JHK and RJH true color composite images displaying the color difference between galaxy #1916 and other objects in this field, in particular cluster galaxies.
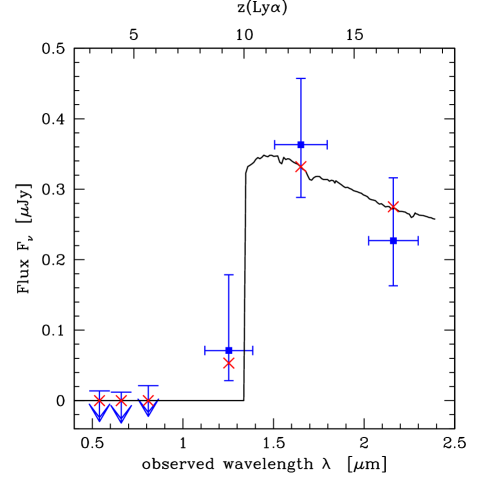
The broad band SED of #1916 was used to constrain the source redshift using our public photometric redshift code Hyperz (Bolzonella et al. 2000) including numerous empirical and theoretical spectral templates for both galaxies and AGNs, and keeping internal extinction as a free parameter. The resulting redshift probability distribution shows a clear maximum at redshift 9–11. This photometric redshift estimate is mainly corroborated by the finding of a strong break of 3.1 to 3.7 AB mags between and , which has a high significance independently of the definition used for the limiting magnitudes. The low -band flux is attributed to the presence of the GP trough located within this filter at these redshifts.
2.2 Spectroscopy
To attempt a spectroscopic redshift determination we have observed #1916 in the band with ISAAC. The observations were taken between 29 June and 3 July 2003, using a 1 arcsec slit width in order to achieve an optimum positioning using bright sources. The results presented here were obtained again under excellent seeing conditions ranging between 0.4 and 0.5 arcsec (about 3 pixels in the composite frames). The source is not resolved in the spatial direction. Thus, we obtained seeing-limited spectra for this source with an equivalent spectral resolution .
To search for possible faint emission lines, we have systematically explored the J band, where Ly should be located for objects within the redshift interval, with priorities set according to the photometric redshift probability distribution. For #1916, the following effective exposure times were obtained in the different adjacent ISAAC bands: 1.193 m (3.6 ksec), 1.255 m (6.4 ksec), 1.315 m (10.8 ksec) and 1.365 m (18.9 ksec). Each band has Å width. Thus the observed spectral interval covers the range from 1.162 to 1.399 m; in other words the “surveyed” interval corresponds to redshifts 8.5–10.5 for Ly. With a spectral resolution for the sky lines of , corresponding to the instrumental 1 arcsec slit width, the fraction of spectral band lost because of strong sky emission lines, mainly OH emission-lines, is of the order of 30%. Spectroscopic data were reduced using IRAF procedures and conforming to the ISAAC Data Reduction Guide 1.5111http://www.hq.eso.org/instruments/isaac/index.html, using the same procedure described in Richard et al. (2003).
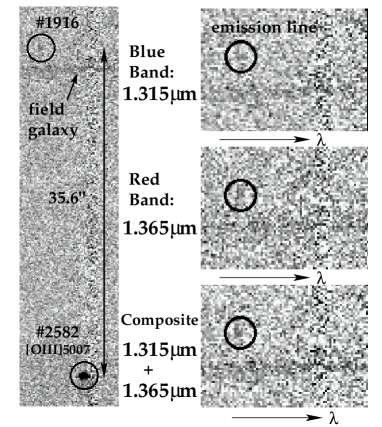
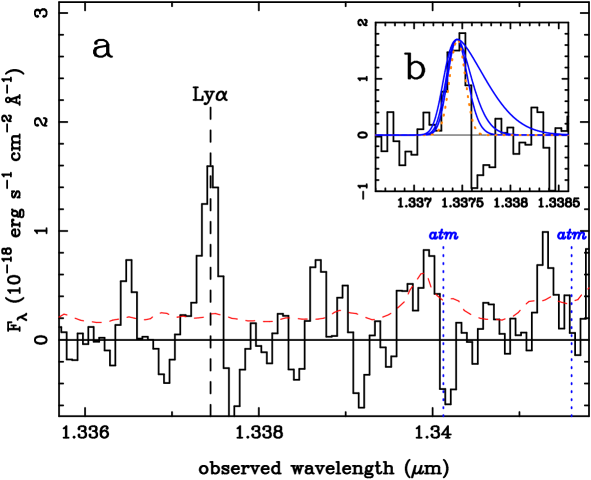
The deep exposures resulted in the detection of one weak emission line at the 4-5 level with an integrated flux of erg cm-2 s-1 at a wavelength of 1.33745 m (see Fig. 4 and Fig. 5), which appears on both the 1.315 and the 1.365 m bands. If identified as Ly the observed wavelength translates to a redshift of 222Note that the given accuracy reflects only the line measurement assuming a restframe Å. Given the lack of knowledge of the intrinsic line profile this represents a lower limit on the uncertainty on the true source redshift., in excellent agreement with the photometric redshift determination.
In the 1.315 m domain, we have also detected 3 emission lines on a secondary target (called #2582) included in the same slit as #1916 (Richard et al. 2003). This galaxy, a faint -band dropout at , shows [O iii] 4959,5007 Å and H. The weakest of them, H, has a flux of erg s-1 cm-2. This provides an independent verification that emission features as faint as erg s-1 cm-2 could have been detected in our spectra all the way from 1.25 m to the end of the band (1.399 m), with some gaps due to sky features. At wavelengths below 1.25 m, the detection efficiency becomes smaller. For an unresolved line of erg s-1 cm-2 a S/N ratio between 2 and 3.5 (from blue to red) would be expected at m. If present, an unresolved line of 10-17 erg s-1 cm-2 would have been detected, with a S/N of 3.6 to 5.5, all the way from 1.162 to 1.399 m.
We used the good S/N of the [O iii] 5007 line of the galaxy #2582 at , which is seen in both the 1.315 and 1.365 m overlapping bands, to compute the offsets required to stack both data sets. The reference star in the same slit, together with a standard star, were used to carefully model the telluric absorptions in these spectra. The correction applied on the relevant wavelength domain is smooth. Fig. 4 displays the 2D spectra obtained on the two different overlapping and independent bands. The combined 1D extracted spectrum around the emission-line is shown in Fig. 5.
3 On the redshift of #1916
How plausible is the observation of Ly from such distant an object? Despite the presence of neutral HI in the IGM at very high z, all galaxies with have been found through their Ly emission and several explanations exist for a partial transmission of Ly emission through the ambient ISM and intervening IGM (Haiman 2002, Santos 2003) which are also applicable to higher redshifts. In #1916 the comparison of UV and Ly luminosities indicates such a possible partial transmission (see Sect. 4). The observed line is hardly resolved and barely asymmetric (see Fig. 5). Best fits are obtained for rest frame widths below 60 km s-1 using a simple gaussian to fit the red half of the Ly emission convolved with the instrumental profile. Line widths beyond 200 km s-1 (similar to those of the sample of galaxies of Hu et al. 2003) are excluded with a high confidence level, but intermediate widths of the order of 100 km s-1 cannot be excluded because of the low S/N ratio in the wings of the line. In any case, starburst galaxies show in general a wide range of Ly profiles, especially objects which are not selected by their line emission, like #1916. In our case, a narrower Ly profile could also be related to the rather small inferred dark matter halo mass (cf. Sect. 4), corresponding to circular velocities of the order of km s-1. Small or negligible line asymmetries as observed here can be explained within simple models by a variety of combinations of parameters including the intrinsic emission line width, the size of the surrounding H ii region, and galactic winds (cf. Haiman 2002, Santos 2003). We therefore conclude that the detection of Ly emission from such a high redshift object and its observed profile are not unexpected.
How secure is the identification of the single line as Ly, i.e. the redshift ? Although other line identifications corresponding to lower redshifts cannot be ruled out in principle, they appear very unlikely for various reasons.
-
•
First, from the constraints of the broad-band SED all solutions with have a smaller probability (see Schaerer et al. 2004 for more details). In fact possible low- () solutions correspond either to young bursts with implausibly large extinction ( 2–3 mag) necessary to supress the flux blueward of the Balmer break, or to old stellar populations, for which, however, no emission lines are expected. For low- solutions invoking a Balmer break the single strongest emission line often seen in the corresponding wavelength domain is [O ii] 3726.0,3728.8. However, this identification is excluded as the doublet would easily be resolved in our observations. Indeed, if the line was [O ii] 3727 observed at z=2.59, it would appear as a double line with the 2 peaks separated by pixels, the two profiles overlapping even for moderate velocity dispersions (). However, this is not observed. Other obvious solutions such as H or [N ii] at z=1.03 are difficult to reconcile with the photometric SED and the absence of other lines in this interval.
A rather “exotic” solution at , albeit of lower probability, can be found with an empirical template of a metal-poor blue compact galaxy with strong emission lines such as SBS 0335-052. In this case the observed strong band flux is dominated by [O iii] 4959,5007, H, and H emission lines, whereas the spectral range covered by is devoid a strong lines. However, to decrease sufficiently the rest-frame UV flux between and an exceptionally large extinction of is required. In such a case the observed emission line should correspond to lines between [O ii] 3727 and 4000 Å, including e.g. relatively strong lines of [Ne iii] 3868 or [Ne iii]+H7 3968 (cf. Izotov & Thuan 1998). Whereas [O ii] 3727 can be excluded (cf. above), other identifications could be possible. However, more than one emission line could then possibly have been detected in the observed wavelength range (cf. above). Although quite unusual, such an explanation has the advantage of being easily testable, as several very strong emission lines would be expected in the band.
For the reasons just discussed redshifts seem very unplausible. For 7–10 other possible identifications of lines sometimes observed in ehigh excitation objects and Lyman break galaxies include lines at 1900 Å such as C iii] 1909 Å, He ii 1640 Å, C iv 1550, and N v 1240 Å. However, also in this case, more than one emission line could possibly have been detected in the observed wavelength range (cf. above).
-
•
The second argument in favour of our line identification is the consistency between the well defined photometric redshift and the spectroscopic measurement.
-
•
Finally, the location of our object on top of the critical lines at (cf. Sect. 4) represents an additional element supporting our redshift identification. It is worth noting that this fact was not considered as a selection criterion.
For these reasons we consider for now the identification of the observed line as Ly as the most likely one. Obviously future detections of other emission lines and possible imaging and morphological constraints on our lensing prediction would represent an important verification of our redshift determination. Also additional very deep imaging (e.g. at 1 m) could help improving further the photometric redshift of #1916 and of other candidates of our sample.
4 Properties of the galaxy and implications
Assuming “concordance” cosmological parameters (, , and km s-1 Mpc-1) the age of the Universe at redshift 10.0 is just 460 Myr after the Big Bang. In other words the galaxy we have detected lies at a distance corresponding to only 4 % of the current age of the Universe.
According to the lensing model for Abell 1835 (Smith et al. 2002), within modelling errors the object #1916 is located on top of the critical lines at . Therefore the magnification factor is very large, ranging with a large uncertainty from 25 to 100, i.e. 3.5 to 5 mag! As in principle the likelihood to obtain the largest amplification is small we will adopt the minimum value of . Once corrected for lensing, the intrinsic AB magnitude of #1916 is 28.5 and 29 in the and bands respectively (cf. Table 1). Clearly, without strong gravitational lensing and excellent seeing conditions near-IR photometry and spectroscopy of such a faint source would be impossible with current 8-10m class telescopes.
Because of its location close to the critical line the object must be multiply imaged by the cluster. However, the identification of the counter images is impossible with the present data. Deeper observations with the Hubble Space Telescope in the near-IR should allow to confirm our current interpretation. Redshift 7–10 sources are expected to have virial radius of the order of kpc, corresponding to , and thus they are unresolved on our present images. HST images with diffraction-limited resolution should thus allow to confirm the high-z nature of this source (e.g. by the detection of strong tangential magnification or multiple images), to constrain the lensing configuration through morphological considerations, and to determine the physical scales involved in star formation activities at such redshifts.
Estimates of the star formation rate (SFR) can be obtained from the Ly luminosity, the UV restframe flux, or SED fits. For a “standard” Salpeter IMF from 1–100 M⊙ and constant star formation at equilibrium we find a lower limit of M⊙yr-1 and M⊙ yr-1, both uncorrected for lensing, adopting published conversion factors (Schaerer 2003, Kennicutt 1998). The lower SFR derived from Ly is thought to reflect in large part the effects of photon “destruction” on the blue side of the Ly emission line by scattering in the IGM and losses due to other possible effects (dust, ISM geometry). SED fits with constant star formation rate (e.g. shown in Fig. 3 for and 3 Myr age) yield typically M⊙ yr-1 (0.8 to 4.8 M⊙ yr-1 after lensing correction) depending on the age after the onset of star formation. Lower SFR values would be obtained for “non standard” IMFs favouring massive stars.
In general the shape of the overall UV SED does not allow one to distinguish age, metallicity, and extinction as these parameters alter the UV spectrum in a degenerate way. In the present case the situation is somewhat different, as the UV restframe spectrum is very blue when compared to other known starbursts (Heckman et al. 1998) and to model predictions (Leitherer et al. 1999, Schaerer 2003) – the UV slope measured from the and -band flux is . Comparisons with observed UV spectra of galaxies and model predictions also show that the observed UV is unlikely to be significantly influenced by line emission (if present). From this we can quite safely conclude that the extinction must be small in this galaxy.
SED modeling also allows us to estimate the total stellar mass and luminosity involved in this star forming event. Scaling young burst models with metallicities to the observed SED we obtain M⊙ (or lensing corrected values of M⊙) and luminosities of L⊙ ( L⊙ lensing corrected) for the above Salpeter IMF. Larger masses are obtained for older bursts. The total current stellar mass estimated for constant star formation over 3 Myr is in good agreement with the above estimate. Note that, as star formation is likely to continue for longer time, the total mass of stars to be formed during this starburst event is likely larger than the “current” stellar mass.
The above estimates show that #1916 is comparable to or somewhat heavier than the most massive old Globular Clusters or the most massive super star cluster observed in nearby starbursts (Mandushev et al. 1991, Ho et al. 1996, Mengel et al. 2002). Assuming typical values for the baryonic/dark matter content and for the star formation efficiency () this translates to a total mass of the dark matter halo of M⊙. Such “massive” halos correspond to the collapse of 2 fluctuations at redshift , where, if metals are absent or very deficient, star formation is expected to occur thanks to cooling by atomic hydrogen (Tegmark et al. 1997, Barkana & Loeb 2001). “Massive” starbursts like the one found here should contribute to the cosmic reionization; they are possibly even the dominant contributors (Ciardi et al. 2003).
In short, the observed and derived properties of #1916 agree well with expectations of a young protogalaxy experiencing a burst of star formation at . If we are witnessing the first star formation event, therefore potentially the formation of a massive primordial (so-called Population III) star cluster, cannot be established or rejected from the present data. Additional spectroscopic observations searching for other possible emission line signatures (e.g. He ii 1640, C iv 1548+51 Å or other metal lines) are necessary to answer this question. In fact a measurement of such lines, although presumably intrinsically fainter than Ly, could well be feasible since the observed (“transmitted”) Ly flux represents only a relatively small fraction of the flux emitted from the source (cf. above). The expected flux in other lines could therefore become comparable to the observed emission line flux.
Finally, our observations show that under excellent conditions and using strong gravitational lensing direct observations of galaxies close to the “dark ages” are possible with ground-based 8-10m class telescopes. We are looking forward to the exploration of this yet unknown territory from the ground and with the forth-coming James Webb Space Telescope.
Acknowledgements.
We are grateful to R. Behrend, B. Ciardi, T. Contini, A. Ferrara, Y. Izotov, M. Lemoine-Busserolle, D. Pfenniger, D. Valls-Gabaud, S. White and various other colleagues for useful comments and discussions. C. Charbonnel, G. Schaerer also contributed indirectly to the finalisation of this work. We thank the ESO Director General for a generous allocation of Director’s Discretionary Time for ISAAC spectroscopy (DDT 271.A-5013). Also based on observations collected at the European Southern Observatory, Chile (70.A-0355), the NASA/ESA Hubble Space Telescope operated by the Association of Universities for Research in Astronomy, Inc., and the Canada-France-Hawaii Telescope operated by the National Research Council of Canada, the French Centre National de la Recherche Scientifique (CNRS) and the University of Hawaii. Part of this work was supported by the CNRS and the Swiss National Foundation. JPK acknowledges support from Caltech and the CNRS.References
- (1) Barkana, R., Loeb, A., 2001, Physics Report 349, 125
- (2) Bertin, E., Arnouts, S., 1996, A&AS, 117, 393
- (3) Bolzonella, M., Miralles, J.-M., Pelló, R., 2000, A&A, 363, 476
- (4) Ciardi, B., Ferrara, A. White, S.D.M., 2003, MNRAS, 344, L7
- (5) Czoske, O., Kneib, J.-P., Bardeau, S., 2002, in “Matter and Energy in Clusters of Galaxies”, Eds. S. Bowyer & C.-Y. Hwang, ASP Conf. Series, in press [astro-ph/0211517]
- (6) Fan, X. et al., 2003, AJ, 125, 1649
- (7) Haiman, Z., 2002, ApJ, 576, L1
- (8) Heckman,T. M., Robert, C., Leitherer, C., Garnett, D.R., van der Rydt, F., 1998, ApJ, 503, 646
- (9) Ho, L.C. Filippenko, A.V., 1996, ApJ, 472, 600
- (10) Hu, E. M., et al., 2002, ApJ, 568, L75
- (11) Hu, E. M., et al., 2003, ApJ, in press [astro-ph/0311528]
- (12) Izotov, Y.I., Thuan, T.X., 1998, ApJ, 500, 188
- (13) Kennicutt, R.C. Jr., 1998, ARAA, 36, 182
- (14) Labbé, I. et al. 2003, AJ, 125, 1107
- (15) Leitherer, C. et al., 2000, ApJS, 123, 3
- (16) Mandushev, G., Staneva, A., Spasova, N., 1991, A&A, 252, 94
- (17) Mengel, S., Lehnert, M.D., Thatte, N., Genzel, R., 2002, A&A, 383, 136
- (18) Pelló, R. et al., 2003, in “Gravitational lensing: a unique tool for cosmology”, Eds. D. Valls-Gabaud & J.-P. Kneib, ASP Conf. Series, in press [astro-ph/0305229]
- (19) Richard, J., Schaerer, D., Pelló, R., Le Borgne, J.-F., Kneib, J.-P., 2003, A&A, 412, L57
- (20) Santos, M.R., 2003, MNRAS, submitted [astro-ph/0305229]
- (21) Schaerer, D., 2003, A&A, 397, 527
- (22) Schaerer, D., Pelló, R., 2002, in “Scientific Drivers for ESO Future VLT/VLTI Instrumentation”, Eds. J. Bergeron and G. Monnet, Springer Verlag, p. 48
- (23) Schaerer, D., Pelló, R., et al., 2004, in preparation
- (24) Smith, G.P. et al., 2002, MNRAS, 330, 1
- (25) Steidel, C.C., Giavalisco, M., Pettini, M., Dickinson, M., Adelberger, K.L., 1996, ApJ, 462, L17
- (26) Tegmark, M. et al., 1997, ApJ, 474, 1