Multiple-Images in the Cluster Lens Abell 2218:
Constraining the Geometry of the Universe ?
In this Letter we present a detailed study of the lensing configuration in the cluster Abell 2218. Four multiple-images systems with measured spectroscopic redshifts have been identified in this cluster. These multiple images are very useful to constrain accurately the mass distribution in the cluster core, but they are also sensitive to the value of the geometrical cosmological parameters of the Universe. Using a simplified maximum likelihood analysis we find assuming a flat Universe, and and for a flat Universe with dark energy. Interestingly, an Einstein-de Sitter model is excluded at more than 4. These constraints are consistent with the current constraints derived with CMB anisotropies or supernovae studies. The proposed method constitutes an independent test of the geometrical cosmological parameters of the Universe and we discuss the limits of this method and this particular application to Abell 2218. Application of this method with more sophisticated tools and to a larger number of clusters or with more multiple images constraints, will put stringent constraints on the geometrical cosmological parameters.
Key Words.:
Gravitational lensing – Galaxies: clusters: individual: Abell 2218 – Cosmological parameters – Cosmology: observations – Cosmology: dark matter1 Introduction
The present Cosmology framework is characterized by a number of parameters which sets the global geometry of the Universe, its history and dynamics. The quest for these parameters is a long-standing issue in Observational Cosmology and is still the main driver of a large number of experiments. Combining constraints coming from the power spectrum of the CMB anisotropies and the luminosity distances of distant type Ia supernovae (SNIa), a new standard model of cosmology is emerging (Spergel et al. 2003): a flat Universe with an accelerating expansion ( and ). To quantitatively explain these results the concept of dark energy has been put forward, characterized by the ratio of pressure and energy density , which reduces to the vacuum energy (the cosmological constant) for . There is however, no strong observational constraints on yet (Spergel et al. 2003 give only ).
This new standard cosmology is getting very popular. Although the flatness of the Universe seems robust, the exact value of is still a matter of debate (Bridle et al. 2003; Blanchard et al. 2003) as it is essentially driven by the SNIa results which can be discussed (Rowan-Robinson 2002). In order to independently probe the large scale geometry of the Universe, we propose to explore the potential use of cluster lenses as a long range optical test bench. Preliminary analysis of this method was first detailed by Link & Pierce (1998) using simple lens models. Recently, we extended their work using more detailed simulations of realistic clusters of galaxies (Golse et al. 2002). The basic idea of this method is that each set of multiple-images identified in a cluster lens strongly constrains the cluster potential. As the scaling of the mass model depends on the ratio of the angular distances , it will also depends on the geometrical cosmological parameters (, and ). In order to constrain these parameters, the combination of several sets of multiple images in a single lens is mandatory to disentangle between the degeneracies in the lens model. With a minimum of 4 systems of multiple images with known spectroscopic redshifts, we showed (Golse et al. 2002) that one can put reasonable constraints in the () plane with some characteristic degeneracies in the fitted parameters (Golse et al. 2002).
In this Letter we apply this lensing test to the well studied cluster-lens Abell 2218. Section 2 describes details of the lens modeling and the cluster mass distribution. The results of the optimization are discussed in Section 3 and a conclusion is presented in Section 4. When necessary we scale the physical parameters with with Hubble constant km s-1 Mpc-1. Thus at the cluster redshift , corresponds to a linear scale of kpc.
2 Lens Modeling
2.1 Lensing and other constraints
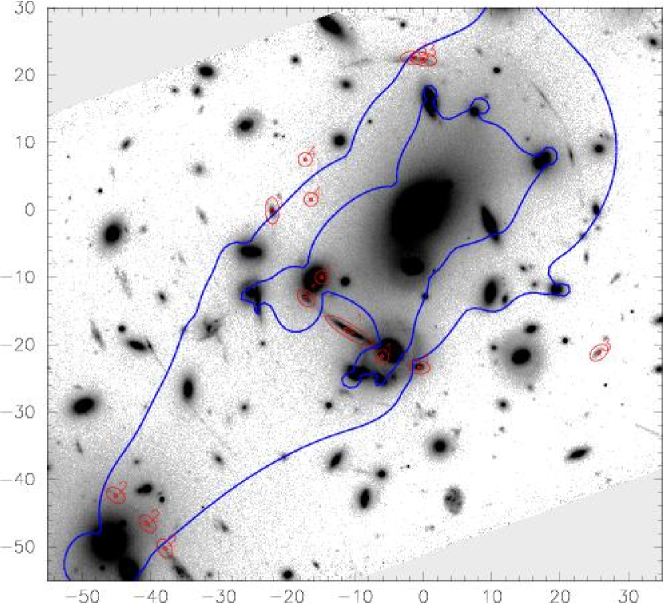
Abell 2218 is one of the richest clusters in the Abell catalog (Abell et al. 1989). A spectroscopic survey of the galaxies by Le Borgne et al. (1992) led to an average redshift and a galaxy velocity dispersion km s-1 (based on 50 cluster members). It is also one of the few clusters for which both an accurate lens model and the identification of 4 systems of lensed multiple images with spectroscopic redshift are presently available. Figure 1 and Table 1 show this list of multiple images with their properties. A number of strong lensing models have been discussed in the literature (Kneib et al. 1996; Allen 1998; Ellis et al. 2001; Natarajan et al. 2002b) using only part of the current available constraints.
Comparisons of the inferred lensing mass with the mass distribution derived from the X-ray emission of the cluster pointed to a strong discrepancy between the two estimators (Miralda-Escudé & Babul 1995; Allen 1998), if one assumes hydrostatic equilibrium. A recent and detailed study of the gas distribution in this cluster using high quality Chandra observations (Machacek et al. 2002) partly confirms this discrepancy, especially near the center. It demonstrates that A 2218 is probably not fully relaxed. However a much better agreement is found in the outer parts of the cluster where the X-ray mass compares with weak lensing masses (Squires et al. 1996; Allen 1998). Our analysis is however independent of the physical state of the intra-cluster gas.
| Multiple image system | References | |||
|---|---|---|---|---|
| #1 | 0.702 | 4 | 6 | (1) |
| #2 | 1.034 | 3 | 4 | (1) |
| #3 | 2.515 | 3 | 4 | (2) |
| #4 | 5.576 | 2 | 2 | (3) |
2.2 The different gravitational lens components
We start from the model described in Kneib et al. (1996): the cluster mass is distributed within two halos of dark matter centered respectively on the main cD galaxy and on the second brightest galaxy. The mass profile of each halo is modeled with a so-called truncated PIEMD ( “Pseudo-Isothermal Elliptical Mass Distribution”, Kassiola & Kovner 1993, Kneib et al. 1996) characterized by 7 parameters: 4 are geometrical (center , ellipticity and position angle ) and 3 describe the mass profile (velocity dispersion , core radius and truncation radius ). Note that our definition of the ellipticity is . The numerical simulations of many different lens configurations and their fits by several analytical mass distributions have shown that cosmological constraints are not very sensitive to the choice of the analytic model: provided there is enough freedom in the number of parameters, the fits can easily adjust the true mass profile at the location of the multiple images. For illustration if a characteristic core radius is included among the free parameters, it will shrink to very small values if the true profile is singular (see some examples in the simulations of Golse et al. 2002).
Furthermore, we include the contribution of the 37 brightest cluster galaxies with magnitude (i.e. m∗+2) and we associated a truncated PIEMD to each of them. The geometrical parameters (center, ellipticity, position angle) are fixed to those of galaxy light parameters, and the mass profile parameters are scaled with the total magnitude, using the prescription proposed by Natarajan & Kneib (1997) and inspired from the standard Faber-Jackson and Kormendy relations:
, and are reference values for a galaxy. For the last relation, means that a constant ratio applies to all galaxies, while for , scales as . To minimize the number of parameters in the model, we fix to a very small value (or a physical scale kpc) for a nearly singular mass profile. Indeed, galaxies are essentially characterized by their central velocity dispersion and the extension of their halo (Natarajan & Kneib 1997).
2.3 Optimization of the main lens parameters
In order to avoid biases in the determination of the cosmological parameters, we use the following procedure, already tested and evaluated by previous numerical simulations (Golse et al. 2002): using a sparse sampling in the plane (with steps of 0.1 for both parameters), we optimize all the other model parameters with a Monte-Carlo method. Thus we do not bias the final optimization toward a given cosmology. For each of the 2 main dark matter halos, we adjust the 7 parameters of the PIEMD and for the individual galaxies we explore the 3 parameters: and .
A wide range of values is allowed for each parameter during the Monte-Carlo initialization. When scanning the area , the minimum is found for and , with a reduced . Similarly, assuming a flat Universe and scanning the area the minimum is located at and , with a reduced . These high values are likely representative of yet non-perfect mass models and possibly also of underestimation of intrinsic errors, especially in the image positions. Anyhow, in both cases, the values of the parameters which describe the two halo potentials and the galaxies are close to those obtained by Kneib et al. (1996) and Natarajan et al. (2002b). The main halo is centered on the central cD galaxy with a shift of a few arc seconds with respect to it. The second halo is well positioned on the second brightest galaxy, again with a few arc seconds shift with respect to its center (Fig. 1).
The orientations of the two main halos are slightly different from those of the light distribution but they show a clear tendency of alignment between two halos. Moreover, the ellipticity of the main halo () is significantly smaller than that of the cD isophotes () while the ellipticity of the secondary halo is quite large (). These features were already pointed out by Kneib et al. (1996) in their lens model. They may represent the signature of a merging phase of the secondary halo the main mass concentration, in good agreement with the recent X-ray analysis of the Chandra data by Machacek et al. (2002).
The characteristic values of galaxy halo mass distribution are compatible with current values deduced from galaxy-galaxy lensing analysis like those found by Natarajan et al. (2002a) in their study of 6 clusters of galaxies. The parameter which represents the variation of the truncature radius with luminosity is about 0.9. The value 0.5 which corresponds to a constant value for all galaxies is ruled out, as already claimed by Natarajan et al. (2002b) and the ratio then scales as . The brightest galaxies seem to have a more extended and massive halo than fainter ones, as already suggested in studies of the fundamental plane of elliptical galaxies (Dressler et al. 1987; Jorgensen et al. 1996).
2.4 Cosmological constraints
Starting from the lens model determined in the previous section, we perform a second level of optimization within the or the plane, with steps of 0.01. Only the most critical parameters are optimized in this modeling, the others being fixed at their previously determined “best value”. The fitted parameters are the velocity dispersions and , and the core radii and of the two main halos. When changing the cosmology, we keep the lens efficiency of the other clumps identical by rescaling the velocity dispersion of the galaxies so that , therefore reducing the number of free parameters.
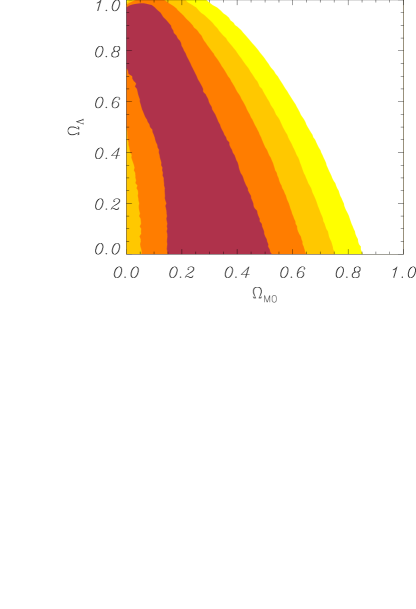
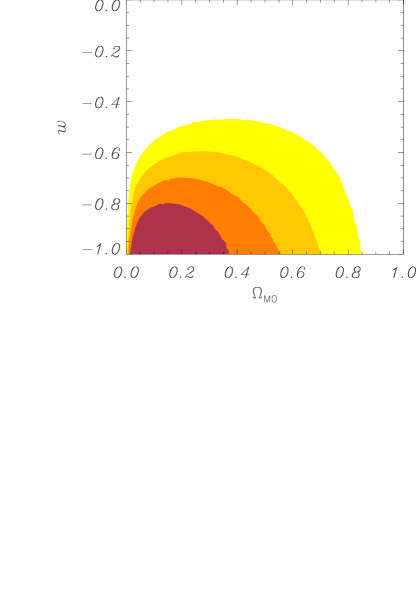
The results of this optimization are displayed in Fig. 2. Only the best model and its value are kept at each step, with no real marginalization on the lens parameters. This is an approximation which is justified by analogy with the analysis of CMB data: in the case of Gaussian distributions of the errors, Tegmark & Zaldarriaga (2000) demonstrate the equivalence between a full multidimensional marginalization and a much simpler maximization. In our case, it is not clear whether the probability distribution function of the lens parameters is close to Gaussian, but to save computer time, we decided to use a similar approach. Further analysis of the full likelihood distribution is necessary to fully validate the method. But is is out of the scope of this paper, presented mainly as a demonstration case applied on a single cluster lens. In Fig. 2, the confidence levels are given for a number of degrees of freedom , where is the number of constraints displayed in Table 1 and is the number of parameters in the optimization (4 for the cluster model and the 2 cosmological parameters). The contours of these confidence levels follow very clearly the expected degeneracy except at low (see Golse et al. (2002) for a detailed discussion about these degeneracies). Therefore we are confident a posteriori that the modeling of the cluster is a fair representation of the true potential and mass distribution.
| (km s-1) | (km s-1) | (″) | (″) | |
|---|---|---|---|---|
In addition, if we overlay on the contours the contours of the fitted lens parameters , we derive an estimate of the variation of these parameters for the ”best models”. Table 2 summarizes these values considered as an estimate of the error bars of the lens parameters.
The consequences on the constraints of the cosmological parameters are encouraging. It is clear from this analysis that an Einstein de Sitter Universe is excluded, at more than 5 . And as expected, the constraints are more stringent on than on . If we assume a flat Universe we get some narrow windows on the parameters:
in close agreement with the constraints derived from Supernovae experiments. And if we assume the existence of a dark energy component in a flat Universe, we find
These results are comparable to those obtained by combining CMB and supernovae data (, Spergel et al. (2003)). Our results also compare well with other recent determinations issued from the statistics of gravitational lenses. For example, the CLASS (Cosmic Lens All Sky Survey) survey of radio galaxies provided constraints on and or very similar to ours, but with larger error bars (Chae et al. 2002).
However some limitations in the procedure are quite obvious. Sources of uncertainties are shared between uncertainties in the image positions (even with the accuracy of Hubble Space Telescope (HST) images), and errors in the mass models. Indeed, although the dependence in the mass profile has been addressed in our previous paper, with accompanying simulations, the reality of the mass distribution in clusters of galaxies is likely to be more complex (Sand et al. 2003). Further examination of these limitations are in progress and will be presented in a forthcoming dedicated paper.
3 Conclusion and future prospects
We have shown in this paper that we can derive reasonable cosmological constraints from the very detailed analysis of the lensing configuration of the cluster of galaxies A2218. The necessary conditions for this study are simple: deep multicolor HST images of a well selected cluster-lens, identification of a minimum of 4 families of multiple-images systems and secure redshift measurement of each family, which ranges from 0.702 to 5.576 . With these constraints, and provided the mass distribution can be modeled by the sum of a dominant component and smaller additional ones (all following a truncated PIEMD mass profile), the geometrical problem can then be solved. The cosmological constraints presented in this paper are of similar accuracy than those derived from Supernovae analysis. Interestingly, both analysis are purely geometrical and completely independent tests, but they are not sensitive to the same combination of distances thus providing nearly orthogonal constraints in the plane.
This new method to constrain the cosmological parameters is very attractive, especially in view of the outstanding performances of the Advanced Camera for Surveys (ACS) on board of HST and the development of Integral Field spectrography that allow to secure the redshift of many multiple images in a very efficient way. The very spectacular ACS images presented by Benitez et al. (2002) on Abell 1689 show that in a very near future, we can use the proposed method as a very serious cosmological test, by focusing on those clusters with more than 4 multiple images with spectroscopic redshift. One advantage of this method is its relatively low-cost in terms of telescope time and relatively easy to implement - although progress is needed to thoroughly explore the parameter space of the mass models and to implement a fully comprehensive likelihood analysis. Such improvements are currently under investigation and will in a near future allow a better treatment of this exciting problem.
Acknowledgements.
We wish to thank B. Fort, R. Pain, M. Douspis and R. Blandford for encouragements and fruitful discussions. Part of this work was supported by the European Network LENSNET: “Gravitational Lensing : New Constraints on Cosmology and the Distribution of Dark Matter” of the European Commission under contract No : ERBFMRX-CT98-0172 and by the Programme National de Cosmologie of the CNRS. JPK acknowledges support from CNRS and Caltech. JPK and GS thank W.M. Keck Observatory and CFHT respectively, for their hospitality.References
- Abell et al. (1989) Abell, G. O., Corwin, H. G., & Olowin, R. 1989, ApJS, 70, 1
- Allen (1998) Allen, S. 1998, MNRAS, 296, 392
- Benitez et al. (2002) Benitez, N., Broadhurst, T. J., Ford, H., et al. 2002, BAAS, 201
- Blanchard et al. (2003) Blanchard, A., Douspis, M., Rowan-Robinson, M., & Sarkar, S. 2003, A&A, 412, 35
- Bridle et al. (2003) Bridle, S., Lahav, O., Ostriker, J., & Steinhardt, P. 2003, Sci, 299, 1532
- Chae et al. (2002) Chae, K.-H., Biggs, A. D., Blandford, R. D., et al. 2002, Phys. Rev. Lett., 89, 151301
- Dressler et al. (1987) Dressler, A., Lynden-Bell, D., Burstein, D., et al. 1987, ApJ, 313, 42
- Ebbels et al. (1996) Ebbels, T. M. D., Le Borgne, J.-F., Pello, R., et al. 1996, MNRAS, 281, L75
- Ellis et al. (2001) Ellis, R. S., Santos, M. R., Kneib, J.-P., & Kuijken, K. 2001, ApJ, 560, L119
- Golse et al. (2002) Golse, G., Kneib, J.-P., & Soucail, G. 2002, A&A, 387, 788
- Jorgensen et al. (1996) Jorgensen, I., Franx, M., & Kjaergaard, P. 1996, MNRAS, 280, 167
- Kassiola & Kovner (1993) Kassiola, A. & Kovner, I. 1993, ApJ, 417, 450
- Kneib et al. (1996) Kneib, J.-P., Ellis, R. S., Smail, I., Couch, W. J., & Sharples, R. M. 1996, ApJ, 471, 643
- Le Borgne et al. (1992) Le Borgne, J.-F., Pello, R., & Sanahuja, B. 1992, A&AS, 95, 87
- Link & Pierce (1998) Link, R. & Pierce, M. J. 1998, ApJ, 502, 63
- Machacek et al. (2002) Machacek, M. E., Bautz, M. W., Canizares, C., & Garmire, G. P. 2002, ApJ, 567, 188
- Miralda-Escudé & Babul (1995) Miralda-Escudé, J. & Babul, A. 1995, ApJ, 449, 18
- Natarajan & Kneib (1997) Natarajan, P. & Kneib, J. 1997, MNRAS, 287, 833
- Natarajan et al. (2002a) Natarajan, P., Kneib, J.-P., & Smail, I. 2002a, ApJ, 580, L11
- Natarajan et al. (2002b) Natarajan, P., Loeb, A., Kneib, J.-P., & Smail, I. 2002b, ApJ, 580, L17
- Pelló et al. (1992) Pelló, R., Le Borgne, J. F., Sanahuja, B., Mathez, G., & Fort, B. 1992, A&A, 266, 6
- Rowan-Robinson (2002) Rowan-Robinson, M. 2002, MNRAS, 332, 352
- Sand et al. (2003) Sand, D., Treu, T., Smith, G., & Ellis, R. 2003, ApJ, submitted, preprint astro-ph/0309465
- Spergel et al. (2003) Spergel, D. N., Verde, L., Peiris, H. V., et al. 2003, ApJS, 148, 175
- Squires et al. (1996) Squires, G., Kaiser, N., Babul, A., et al. 1996, ApJ, 461, 572
- Tegmark & Zaldarriaga (2000) Tegmark, M. & Zaldarriaga, M. 2000, ApJ, 544, 30