Search for cosmic-ray point sources with KASCADE
Abstract
A survey of the northern hemisphere for astrophysical point sources with continuous emission of high-energy cosmic rays is presented. Around 47 Mio extensive air showers with primary energies above 300 TeV measured by the KASCADE detector field are selected for this analysis. Besides the sky survey, a search for signal excess in the region of the galactic plane and of selected point source candidates has been performed. There is no evidence for any significant excess. This is valid for an analysis of all recorded showers as well as for a data set enhanced in gamma-ray induced showers. An upper flux limit of around m-2s-1 for a steady point source that transits the zenith is obtained. Additionally, the distribution of the arrival directions of extensive air showers with energies above 80 PeV were studied by an autocorrelation analysis.
1 Introduction
The origin of high-energy cosmic rays is still unknown. Their sources are obscured due to the deflection of the charged particles in galactic magnetic fields. Only neutral particles, i.e. neutrons or high-energy photons, can point back to their sources. But besides restrictions from the known acceleration processes, several limitations for the detection of neutral particles arise from propagation effects and from the large background of charged cosmic rays.
Neutrons can reach the Earth if their energy and hence their decay length is comparable with the distance of the source. A decay length of 1 kpc corresponds to a neutron energy of about eV, the distance to the galactic center (8.5 kpc) to an energy of roughly eV. There are models proposing neutron emission from the center of the galaxy (Hayashida et al., 1999). They could explain the excess of events from this direction (which is unfortunately not visible from the KASCADE site) measured by the AGASA experiment (Hayashida et al., 1999) at around eV. In the present work the possibility of neutrons originating from more nearby sources ( kpc) is analysed with the data set of KASCADE.
TeV -ray sources are potential sites for the acceleration of high-energy cosmic rays. Several sources have been established in the last decade. The energy spectrum of some of them extend up to 80 TeV (e.g. Tanimori et al. (1998)). Limitations for the detection of PeV -ray sources are: very low fluxes due to the steeply falling energy spectra of the sources, a possible cutoff in their spectra, and the attenuation of -rays on their way to the observer as a result of the interaction with low energy photons from the cosmic microwave background radiation (Coppi & Aharonian, 1997). A review of the status of high-energy -ray astronomy can be found in (Ong, 1998; Hoffmann et al., 1999).
All TeV -ray sources have been observed by imaging atmospheric Cherenkov telescopes. While these instruments are very sensitive to -ray showers (low energy threshold, good rejection of hadron-induced extensive air showers), the major drawback for the search of new sources is their small field of view and their limitation to dark observation periods. Large field arrays measuring the secondary particle distribution of extensive air showers on ground have large fields of view and duty cycles independent of day and night periods. Unfortunately, they suffer from the huge background of hadron-induced extensive air showers. Only the Tibet air shower array and the Milagro experiment reported the detection of a TeV -ray source (Crab-Nebula) (Amenomori et al., 1999; Atkins, 2003).
Several sky surveys for steady -ray sources have been performed by air shower experiments at energies from 1 TeV to 1 PeV (CYGNUS (Alexandreas et al., 1991b), CASA (McKay et al., 1993), Milagrito (Wang et al., 2001), Tibet (Amenomori et al., 2002), HEGRA (Aharonian et al., 2002)). None of the experiments have found point sources. In this article a survey of the northern sky for primary energies above 300 TeV in the declination range 15∘ 80∘ with data recorded by the KASCADE detector field is presented. Compared to the experiments mentioned above, KASCADE measures in a different energy region or observes a different part of the sky. An analysis of the arrival-direction distribution of charged cosmic rays on large angular scales covering the effects of their diffusion in the galactic magnetic field is presented elsewhere (Antoni et al., 2003c).
2 KASCADE - experimental setup and shower reconstruction
KASCADE (KArlsruhe Shower Core and Array DEtector) is located at Forschungszentrum Karlsruhe, Germany ( E, N) at 110 m a.s.l. corresponding to an average vertical atmospheric depth of 1022 g/cm2. The experiment measures the electromagnetic, muonic, and hadronic components of extensive air showers with three major detector systems: a large field array, a muon tracking detector, and a central detector. A detailed description of the KASCADE experiment can be found in (Antoni et al., 2003a).
In the present analysis data from the 200200 m2 scintillation detector array are used. The 252 detector stations are uniformly spaced on a square grid of 13 m. The stations are organized in 16 electronically independent so-called clusters with 16 stations in the 12 outer and 15 stations in the four inner clusters. The stations in the inner/outer clusters contain four/two liquid scintillator detectors covering a total area of 490 m2. Additionally, plastic scintillators are mounted below an absorber of 10 cm of lead and 4 cm of iron in the 192 stations of the outer clusters (622 m2 total area). The absorber corresponds to 20 electromagnetic radiations lengths entailing a threshold for vertical muons of 230 MeV. This configuration allows the measurement of the electromagnetic and muonic components of extensive air showers. The detector array reaches full efficiency on the detection of showers for electron numbers . The trigger rate is about 3 Hz.
Applying an iterative shower-reconstruction procedure the number of electrons and muons in a shower are determined basically by maximizing a likelihood function describing the measurements with the Nishimura-Kamata-Greisen (NKG) formula (Kamata & Nishimura, 1958; Greisen, 1965) assuming a Molière radius of 89 m. Detector signals are corrected for contributions of other particles, i.e. the electromagnetic detectors for contributions of muons, gammas, and hadrons (Antoni et al., 2001). Shower directions and hence the directions of the incoming primary particles are determined without assuming a fixed geometrical shape of the shower front by evaluating the arrival times of the first particle in each detector and the total particle number per station.
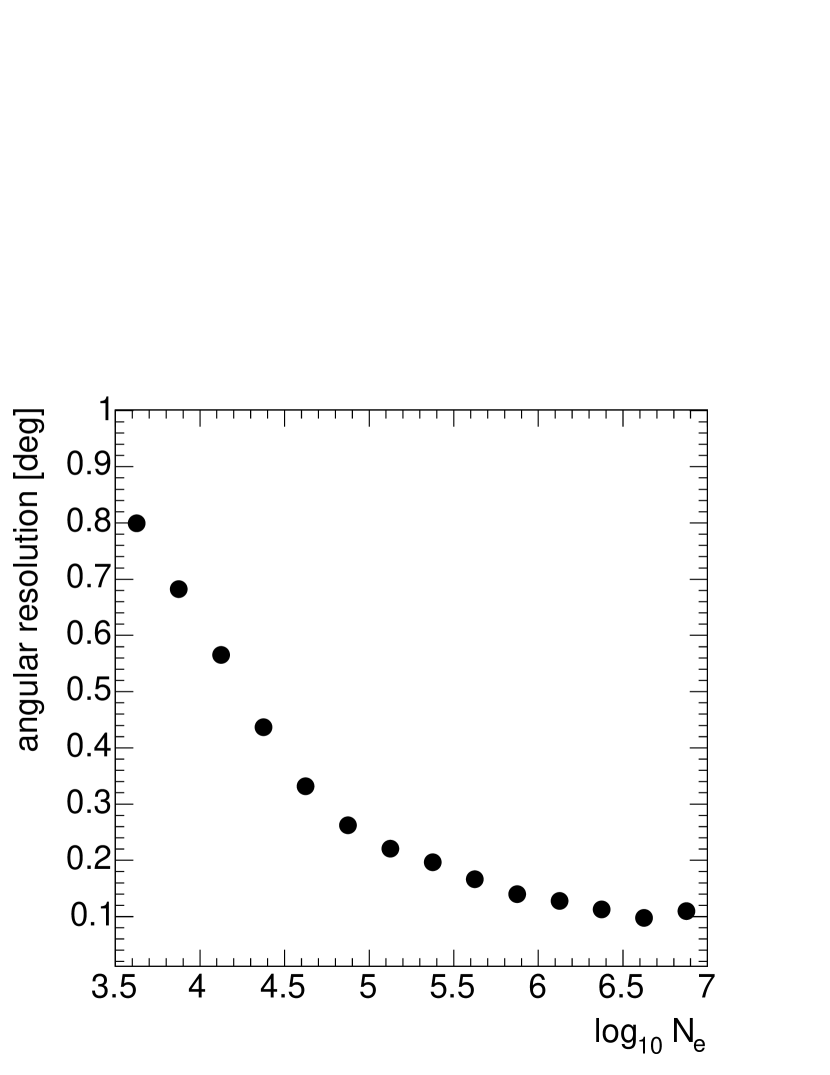
The angular resolution of the KASCADE detector field is determined by the application of the chequer board method. Dividing the detector field in two subarrays and comparing shower directions using the one or the other subarray gives a measure for the angular resolution. Shower directions are reconstructed with a resolution (68% value) of 0.55∘ for small showers with and 0.1∘ for showers with an electron number of (see Figure 1). The angular resolution is almost independent of the zenith angle at all shower sizes, e.g. small showers with zenith angles larger than 35∘ are reconstructed with an accuracy of about 0.58∘.
Systematic uncertainties in the angular reconstruction have been studied by shower simulations and by real shower measurements. The simulation chain consists of CORSIKA (version 6.014) (Heck et al., 1998) using the hadronic interaction models QGSJet (Kalmykov, Ostapchenko & Pavlov, 1997) and GHEISHA (Fesefeldt, 1985), and for the electromagnetic part EGS4 (Nelson, Hirayama & Rogers, 1985) followed by a detailed simulation of the detector response based on GEANT (GEANT, 1993). After completion of the simulations a GHEISHA version (Heck et al., 2003) corrected for program mistakes was available, but recent comparision show no effect of these corrections to the presented investigations. No systematic uncertainties are visible neither in simulations nor in real shower measurements. In the second method the reconstructed shower direction of the detector field is compared with the shower direction of the same shower determined by the muon tracking detector of KASCADE (Doll et al., 2002). This component of KASCADE measures tracks of individual muons ( MeV) with an arrangement of three layers of limited streamer tubes of 128 m2 area each. The comparison results in an angular difference between both reconstructed shower directions of ∘∘.
The energy threshold of KASCADE is defined by the trigger conditions and the data cuts given below. It is a function of zenith angle and therefore declination dependent. Figure 2 shows the mean values for 75% detection probability of -induced showers vs. declination. The realistic zenith angle distributions as function of declination are taken into account for these calculations. The threshold is determined with the already described extensive air shower simulations. The threshold is increasing from 280 TeV at ∘ to 550 TeV at the edges of the field of view.
3 Data selection and suppression of hadron induced showers
To clean the data set from poorly reconstructed showers, the following cuts were applied: more than 13 out of 16 clusters are working, shower core positions are inside a circular area of 91 m radius around the center of the array to omit large reconstruction errors at the edges of the detector field, and zenith angles are requested to be 40∘.
The data set was recorded between May 1998 and October 2002 corresponding to an effective time of about 1300 days. About 47 Mio events are left for the analysis after the mentioned cuts.
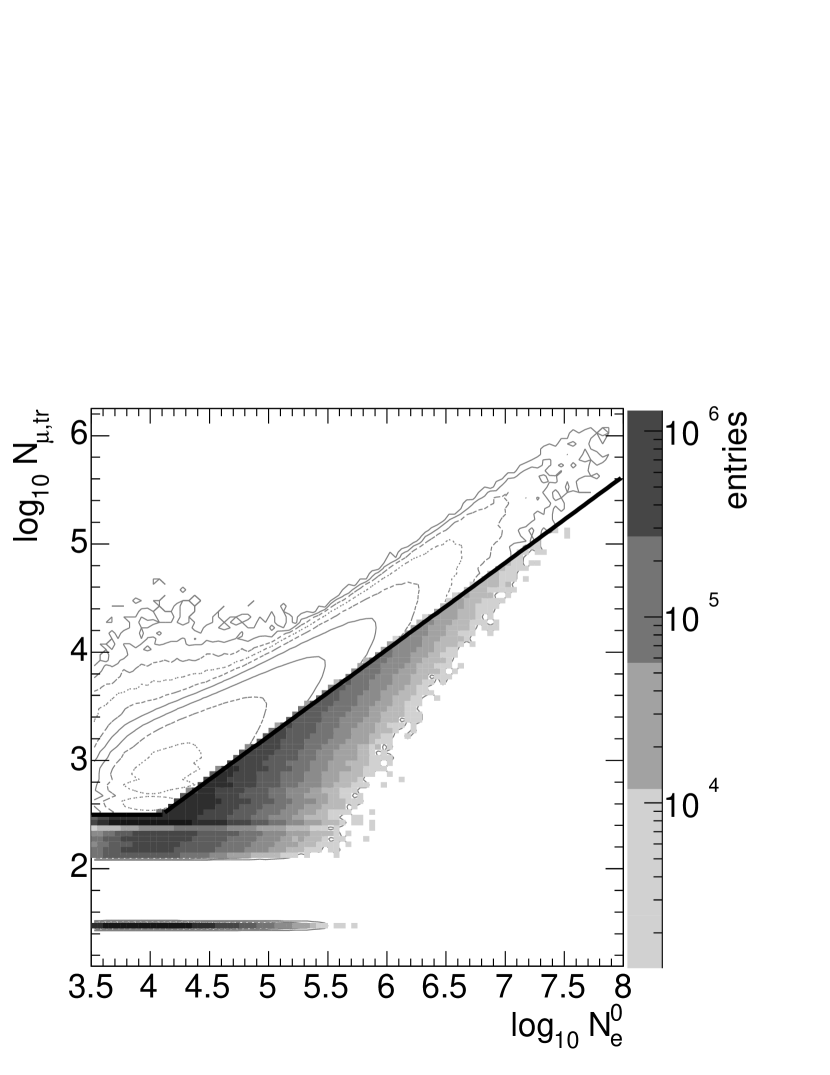
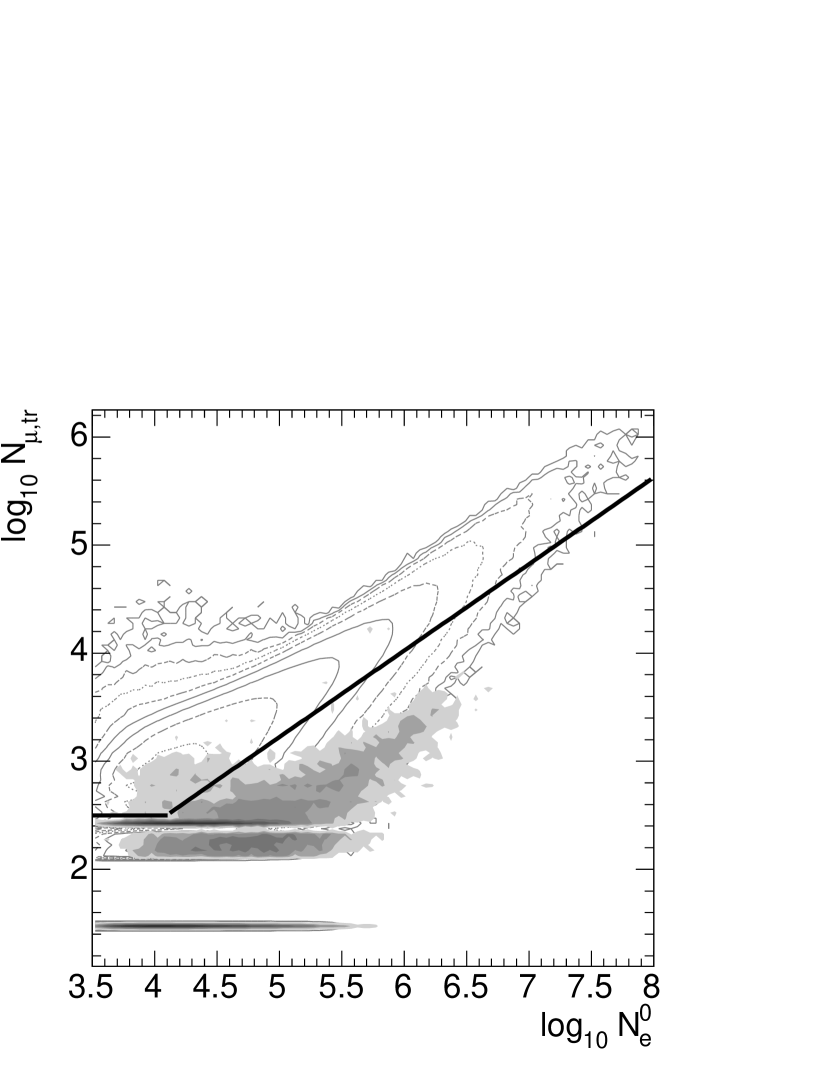
The sensitivity to -ray induced showers can be enhanced by the suppression of hadron-induced extensive air showers using the ratio of number of muons to number of electrons in a shower. Figure 3 (left-hand side) shows the distribution of electron vs. truncated muon number (-) for measured showers. denotes the number of muons in the distance range from 40 to 200 m to the shower core. The electron number is corrected to a zenith angle of ∘ using an attenuation length of g/cm2 (Antoni et al., 2003b). The - distribution for simulations of -induced showers is shown in Figure 3 (right-hand side). The showers are simulated in the energy range eV eV following a power law with a spectral index of -2. The distribution of shower sizes for -induced showers motivates the following cuts to suppress hadron-induced showers: for and for . This selection of muon-poor showers is indicated by straight lines in Figure 3. About 75% of the hadron-induced showers are suppressed by this procedure. All results in the following section are presented for the whole data set as well as for the data set consisting of muon-poor showers only.
4 Point source search
4.1 General method
A region in the sky of a certain angular size is analyzed by comparing the number of events from the assumed direction with an expected number of background events. Sky regions with significant excesses indicate possible point-like sources. The significance for the deviations from the expected background is calculated by the widely used method of Li & Ma (1983).
The so-called time-shuffling method (Cassiday, 1990; Alexandreas et al., 1991a) has been used for the background calculation. With this method artificial background events are created with the same arrival times as the measured events. The shower directions in horizontal coordinates (azimuth and zenith) for these new events are taken from other randomly selected measured events. In this manner artificial data sets are generated by many repetitions of this procedure and by usage of the time dependent conversion from horizontal to equatorial coordinates. The mean shower-direction distribution from these generated data sets has most of the properties of an isotropic background. Exposure, angular distributions and possibly existing systematic reconstruction errors are the same as in the real data set. Interruptions in the data acquisition are taken into account as well. The loss of sensitivity due to the overestimation of the number of background events by the usage of possible source events is negligible since showers are distributed over the whole right-ascension range. In this analysis the expected background is determined by the average of 50 artificial data sets.
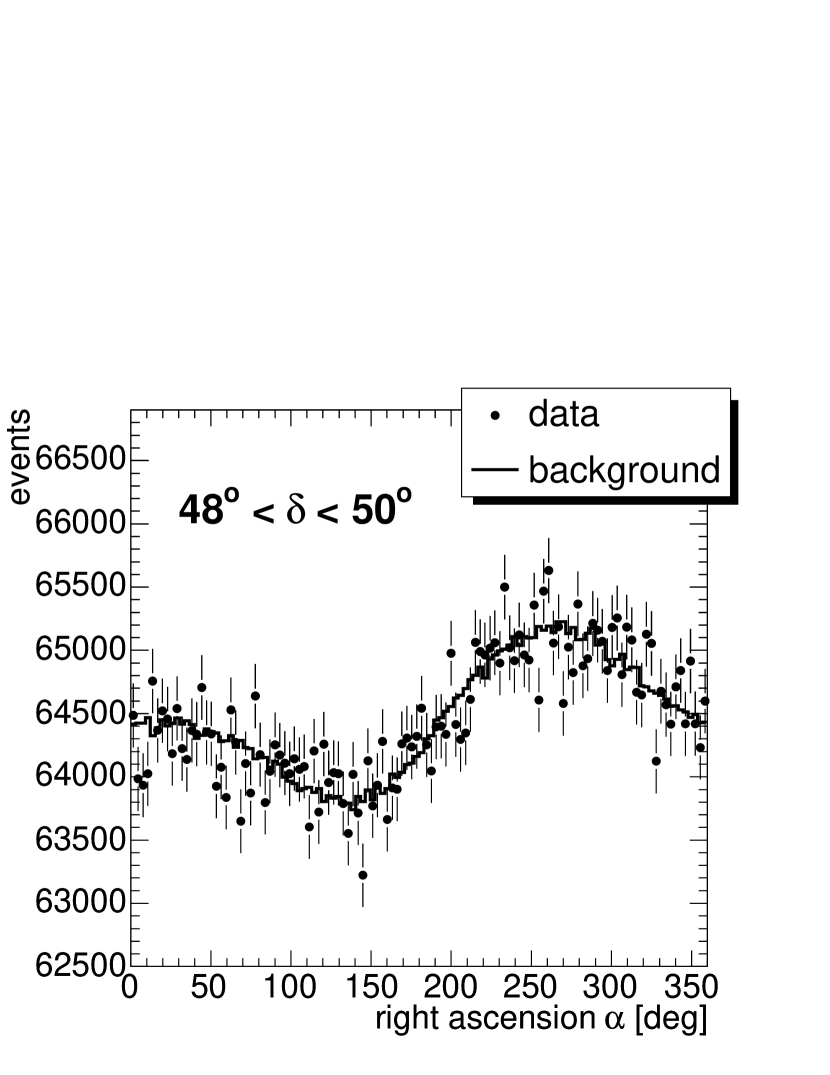
Sky maps in equatorial coordinates of the distribution of arrival directions of the measured events and the expected background are generated by the time-shuffling technique. Sky maps of significance values are calculated by comparing the content of each bin in the data maps with the corresponding value in the background maps. The bins in the sky maps are of constant solid angle, the bin width is optimized by Monte Carlo calculations to give maximum sensitivity to point-like sources. The solid angle of a bin is selected to be sr with a bin width in declination of 0.5∘ and 0.5∘ in right ascension. The bins are independent and non-overlapping. To avoid the loss of sensitivity to sources located on the edge of the bins, all analyses are repeated with sky maps of different binning definitions. As example, Figure 4 shows the data and background maps in the declination range 48∘ 50∘. The smoothness of the generated background distribution compared with the measured data is clearly visible. The modulation of the distributions (amplitude 1%) is due to interruptions during the data acquisition.
In case of no point-like sources, the distribution of significances in the sky map is expected to be Gaussian with a mean value and width (Li & Ma, 1983). Deviations from isotropy would be visible in a non-gaussian shape of the significance distributions or in the occurrence of values with unlikely large significances.
The 90% upper limits of events above background in the source regions are determined by the method of Helene (1983). With the assumption of equal power laws in the energy spectra of background and source events, the upper flux limits for showers with primary energies larger than are calculated by:
| (1) |
is the number of background events in the analyzed bin or region, the background flux above a certain primary energy , the observed solid angle and the average fraction of source events in the search region. Monte-Carlo simulations of shower directions from a point-like source with consideration of the angular resolution of KASCADE yield %, assuming a neglectable error of the source position.
Circular regions around the objects of the current catalog of TeV--ray sources are inspected in more detail. The search radius is 0.5∘. The expected background is generated as described with the time-shuffling technique using arrival times and directions of the off-source events. The significance of the deviations from the expected background as well as upper flux limits are calculated in the same manner as for the sky survey.
4.2 Sky survey
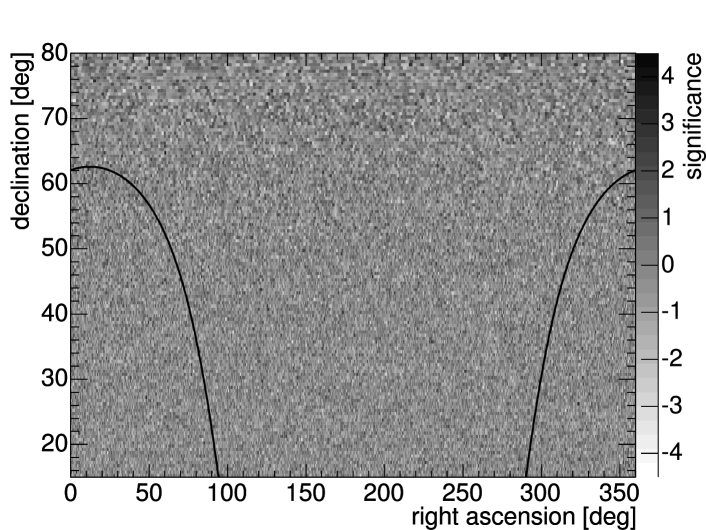
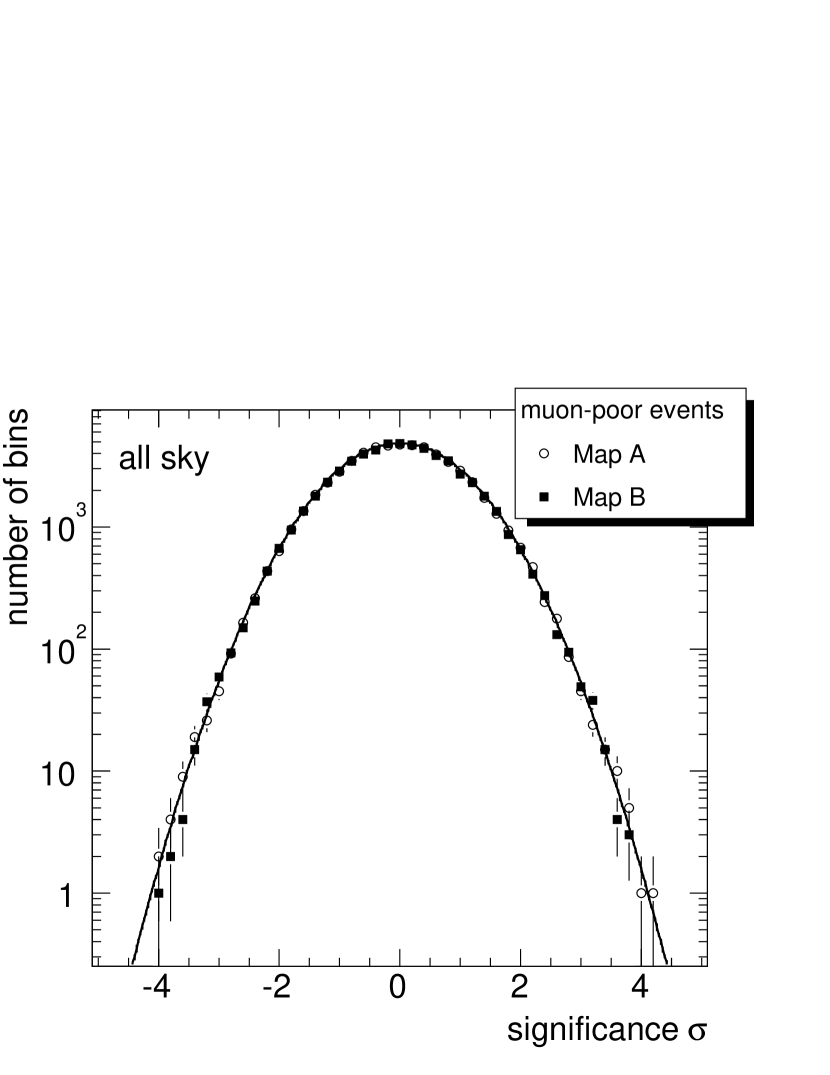
Figure 5 shows the sky map of significance values in equatorial coordinates for the data sample of muon-poor events. Most of the significance values are between -1 and 1, the extreme values are around . The distributions of the significance values derived from this graph and from maps generated from all events are shown for two examples of binning definitions in Figure 6. The shift of the binning grid between maps A and B in Figure 6 is roughly half a bin width on both axes. Although there are deviations of about four sigma from the expected background visible in the sky map of significance values in Figure 5, the one-dimensional distributions show that these are expected fluctuations. This is due to the large number of bins in the sky map (). No unexpectedly large significance values are visible, neither in the all data nor in the muon-poor sample.
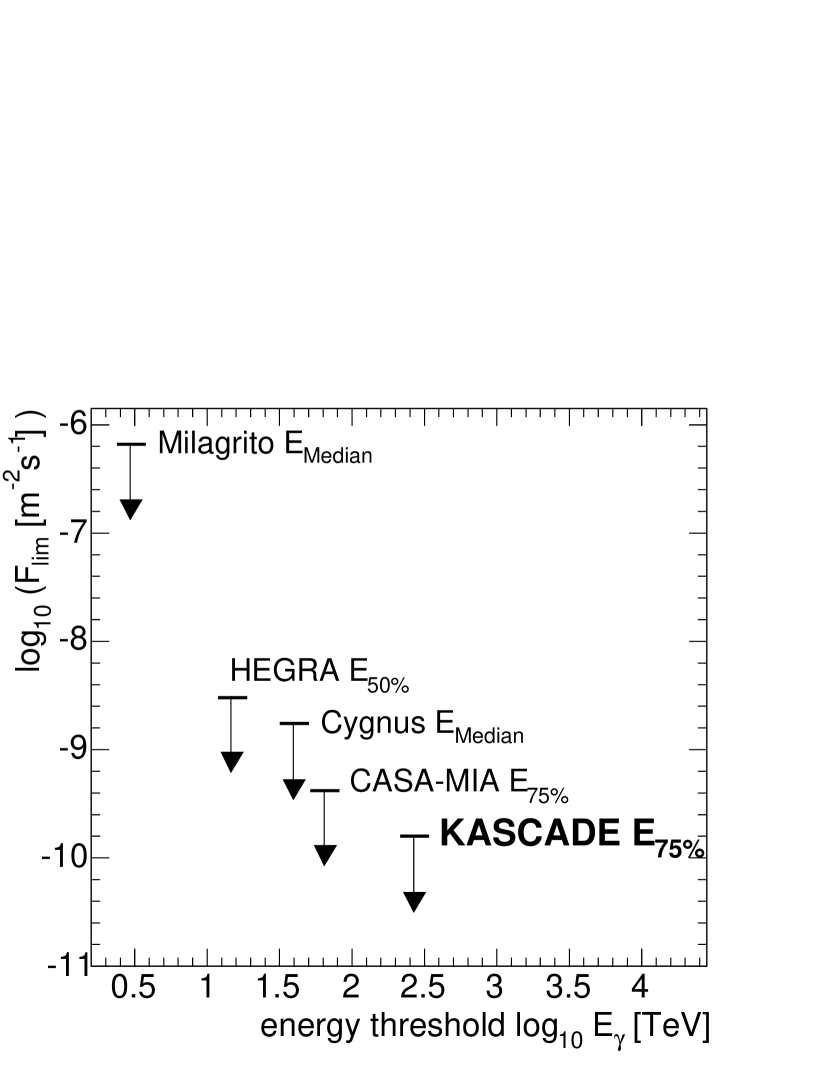
The result of the upper flux limit (90% confidence) calculated according to equation 1 for a source moving through the zenith is compared with results from other experiments in Figure 7. The different definitions of the energy threshold should be noted. Some of the experiments use the energy, where 50% or 75% of the showers are detected, others the median energy of a source moving through the zenith. The decrease of the upper flux limits with energy reflects the power law of the primary energy spectrum. The typical upper flux limit determined for the present data set is about m-2 s-1 at an energy of about 300 TeV. This is roughly 1-2 orders of magnitude larger than the flux of the Crab-Nebula extrapolated up to this energy.
4.3 Analysis of point source candidates
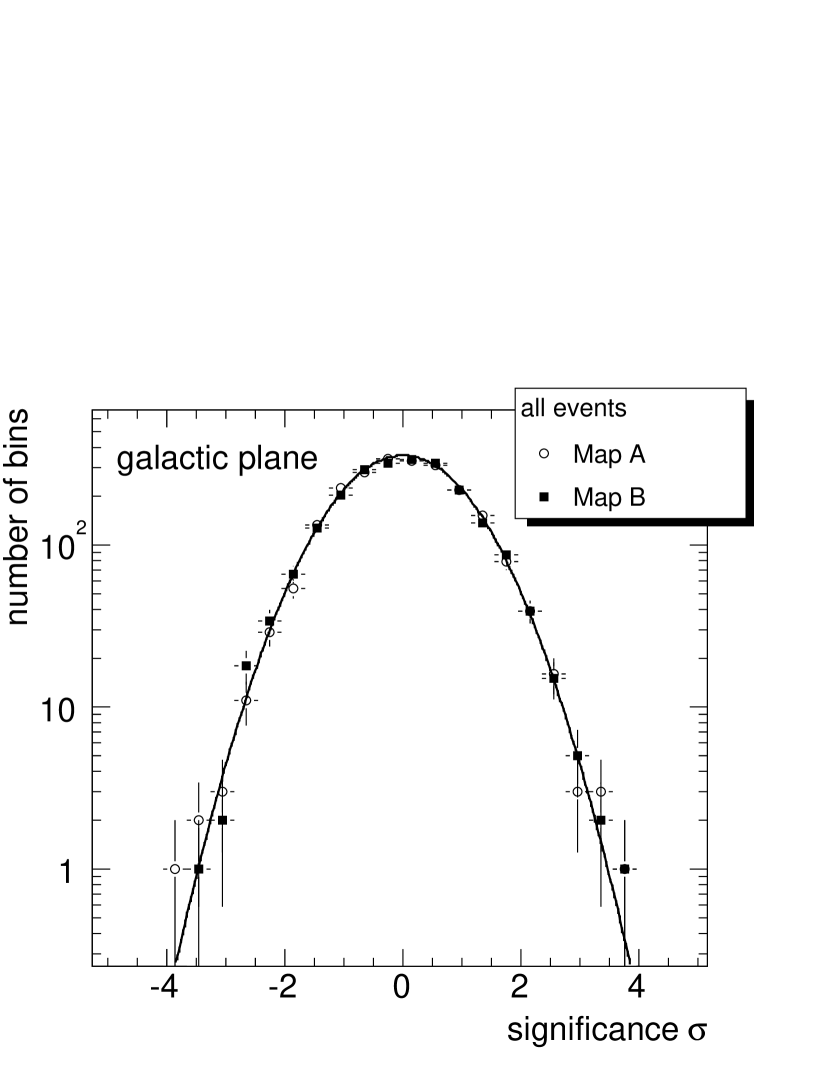
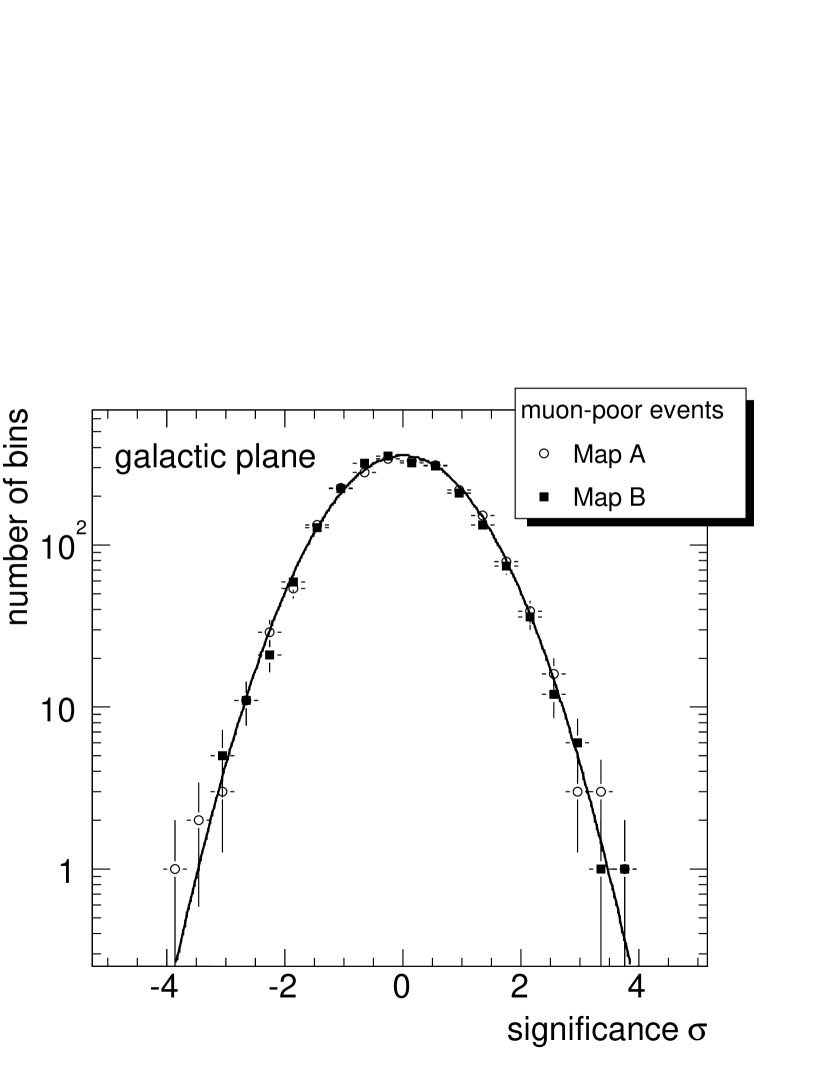
The most probable candidates for cosmic-ray point sources are expected to be of galactic origin. The distribution of the significances in a band-like region with a width of 1.5∘ around the galactic plane is shown in Figure 8. Again, no large unexpected significance values have been detected, i.e. the distributions have Gaussian shapes.
The results of the analysis of discs (radius 0.5∘) centered at the position of presently known TeV -ray sources are listed in Table 1. There is no indication for an excess from any of these source candidates, the largest positive significance is .
Chilingarian, Martirosian, & Gharagyozyan (2003) reported recently the detection of a source of high-energy cosmic rays in the Monogem Ring, from right ascension 7.h5, declination 14∘ (750+14). This is just outside the declination range considered here, but changing slightly the quality cuts extends the visible sky of KASCADE sufficiently. In the KASCADE data set there are in total 742 events with a maximum distance of 0.5∘ to the suggested location. The number of expected events is 716, this corresponds to an excess significance of 0.94 and an upper flux limit of m-2 s-1. Furthermore, no significant signal (, 785 measured and 745 expected events) is seen from the region around PSR B0656+14 in the center of the Monogem Ring, which was proposed by Thorsett et al. (2003) as a nearby cosmic-ray source.
5 Autocorrelation of showers 80 PeV
The most energetic extensive air showers measured by the KASCADE experiment correspond to primary energies around 80-140 PeV. The data set is analyzed using an estimator of the autocorrelation function according to Landy & Szalay (1993), which has the advantage of a Poisson-like error calculation. It describes essentially the ratio of the probabilities to find a pair of showers separated by a certain angular distance in the measured data set and the one derived from an isotropic distribution:
| (2) |
denote the angular distance distributions of data-data, data-random and random-random events. To reproduce an isotropic background, random directions are generated from the measured directions again using the time-shuffling technique averaging this time over 1000 artificial data samples.
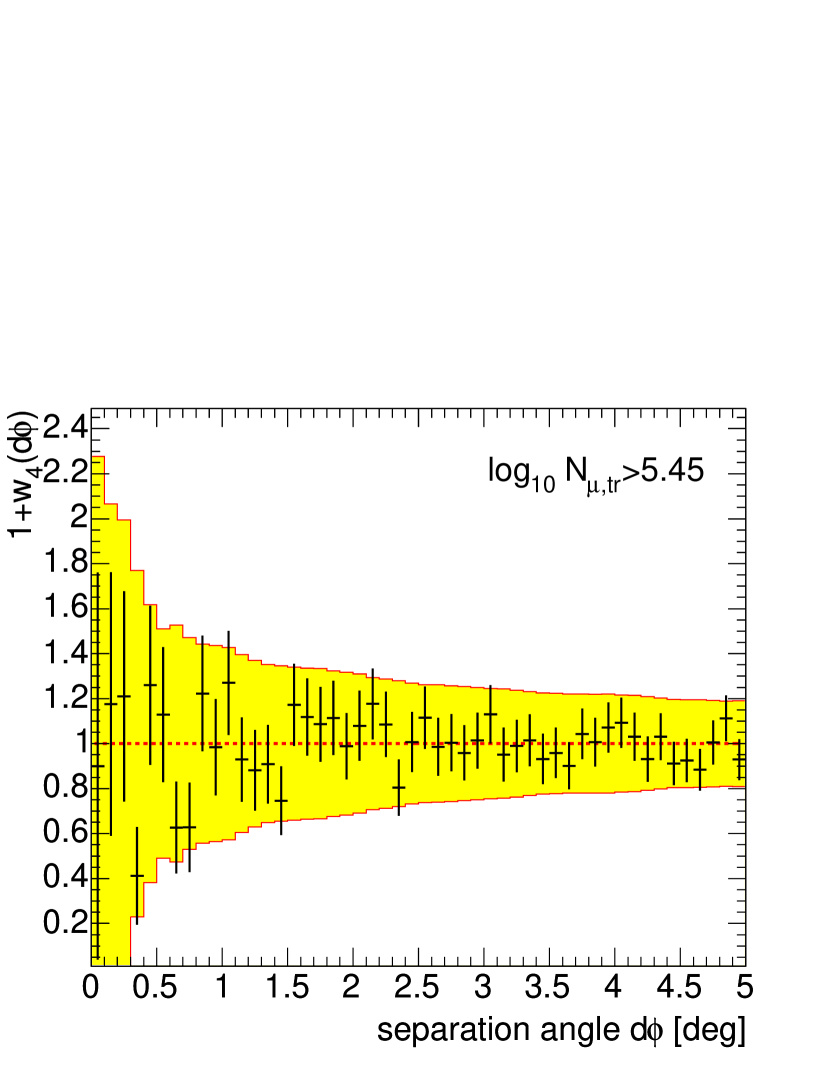
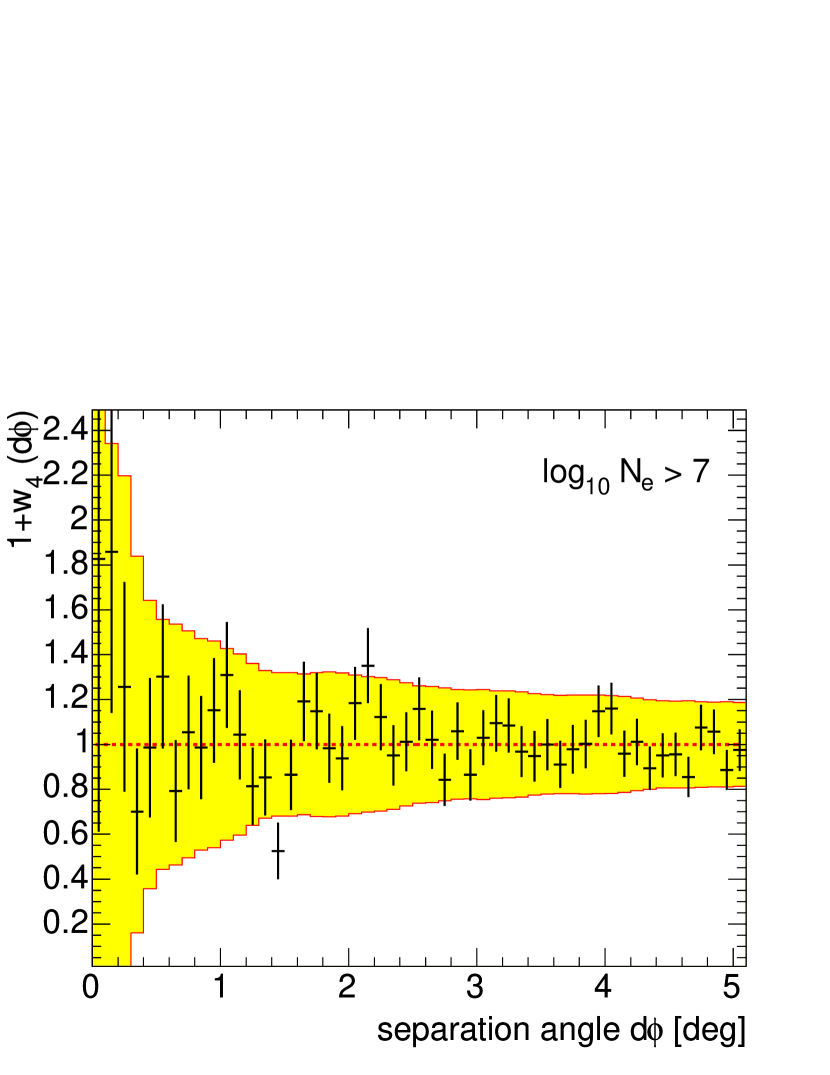
Figure 9 shows the distributions for the 1000 largest showers selected by truncated muon numbers (left-hand side) and selected by electron numbers (right-hand side). The number of muons is a better estimator of the primary energy compared to the electron number , but a selection of showers by their muon number suppresses possible -ray induced showers. No significant deviation from the isotropic expectation, which is exactly one, is detected. A potential point source would be visible in an enhancement of values below 0.2∘, which corresponds to the angular reconstruction accuracy. The points are inside the estimation of the two sigma (95%) confidence regions indicated by the shaded area. These results are expected, since a clustering of the showers at this primary energies is unlikely due to the low flux and large attenuation of -rays or the short decay length of neutrons of only about 1 kpc.
6 Summary
A search for small scale anisotropies in a data set of about 47 Mio extensive air showers measured with the KASCADE experiment has been presented. The arrival direction of all events in this data set as well as a subset of muon-poor events, i.e. extensive air showers which are more similar to -ray induced showers, are analysed. No evidence for any point-like source has been found, which is in accordance with theoretical expectations. This is valid for the sky survey as well as for a detailed analysis of a region around the galactic plane and known TeV -ray sources. Upper limits for the detection of point-like sources are determined to be around m-2 s-1. Also no clustering of the arrival direction for showers with primary energies above 80 PeV is visible.
References
- Aharonian et al. (2002) Aharonian, F. et al. (HEGRA collaboration) 2002, A&A, 390, 39
- Alexandreas et al. (1991a) Alexandreas, D.E. et al. 1991a, Nucl. Instr. and Meth. A, 328, 570
- Alexandreas et al. (1991b) Alexandreas, D.E. et al. 1991b, ApJ, 383, L53
- Amenomori et al. (1999) Amenomori, M. et al. (Tibet AS collaboration) 1999, ApJ, 525, L93
- Amenomori et al. (2002) Amenomori, M. et al. (Tibet AS collaboration) 2001, Proc. 27th ICRC (Hamburg), p.2395
- Antoni et al. (2001) Antoni, T. et al.(KASCADE collaboration) 2001, Astropart. Phys., 14, 245
- Antoni et al. (2003a) Antoni, T. et al.(KASCADE collaboration) 2003a, Nucl. Instr. and Meth. A, 513, 490
- Antoni et al. (2003b) Antoni, T. et al.(KASCADE collaboration) 2003b, Astropart. Phys., 19, 703
- Antoni et al. (2003c) Antoni, T. et al.(KASCADE collaboration) 2003c, ApJ, submitted
- Atkins (2003) Atkins, R. 2003, ApJ, 595, 803
- Cassiday (1990) Cassiday, G. 1990, Nucl. Phys. B (Proc.Suppl.), 14, 291
- GEANT (1993) CERN 1993, GEANT 3.21, Detector Description and Simulation Tool, CERN Program Library Long Writeup W5015, Application Software Group
- Chilingarian, Martirosian, & Gharagyozyan (2003) Chilingarian, A., Martirosian, H., & Gharagyozyan G. 2003, ApJ, 597 L129
- Coppi & Aharonian (1997) Coppi, P. & Aharonian, F. 1997, ApJ, 487, L9
- Doll et al. (2002) Doll, P. et al. 2002, Nucl. Instr. and Meth. A, 488, 517
- Fesefeldt (1985) Fesefeldt, H. 1985, Report PITHA-85/02, RWTH Aachen
- Greisen (1965) Greisen, K. 1965, Progress in Cosmic Ray Physics, 3, North Holland Publ.
- Hayashida et al. (1999) Hayashida, N. et al. 1999, Astropart. Phys., 10, 303
- Heck et al. (1998) Heck, D. et al. 1998, Report FZKA 6019, Forschungszentrum Karlsruhe
- Heck et al. (2003) Heck, D. et al. 2003, Proc. 28th ICRC (Tsukuba), p.279
- Helene (1983) Helene, O. 1983, Nucl. Instr. and Meth., 212, 319
- Hoffmann et al. (1999) Hoffmann, C. , Sinnis, C. , Fleury, P., & Punch, M. 1999, Rev. Mod. Phys., 71, 897
- Kalmykov, Ostapchenko & Pavlov (1997) Kalmykov, N.N., Ostapchenko, S.S., & Pavlov, A.I. 1997, Nucl. Phys. B. (Proc. Suppl.), 52B, 17
- Kamata & Nishimura (1958) Kamata, K. & Nishimura, J. 1958, Prog. Theoret. Phys. Suppl. 6, 93
- Landy & Szalay (1993) Landy, S. & Szalay, A. 1993, ApJ, 412, 64
- Li & Ma (1983) Li, T.-P. & Ma, Y.-Q. 1983, ApJ, 272, 317
- McKay et al. (1993) McKay, T. et al. 1993, ApJ, 417, 742
- Nelson, Hirayama & Rogers (1985) Nelson, W.R., Hirayama, H., & Rogers, D.W.O. 1985, Report SLAC 265, Stanford Linear Accelerator Center
- Ong (1998) Ong, R. 1998, Phys. Rep., 305, 93
- Tanimori et al. (1998) Tanimori, T. et al. 1998, ApJ, 492, L33
- Thorsett et al. (2003) Thorsett, S.E. et al., 2003, ApJ, 592, L71
- Wang et al. (2001) Wang, K. et al. (Milagro collaboration) 2001, ApJ, 558, 477


| all events | muon-poor events | ||||||||||||
|---|---|---|---|---|---|---|---|---|---|---|---|---|---|
| source name | RA | Dec | |||||||||||
| (h) | (TeV) | (m-2s-1) | (m-2s-1) | ||||||||||
| Crab Nebula | ∘’ | 5843 | 510 | 2680 | 2695 | -0.29 | -9.50 | 927 | 925 | 0.08 | -9.81 | ||
| Cas A | ∘’ | 11077 | 300 | 11069 | 11204 | -1.26 | -9.32 | 3487 | 3483 | 0.06 | -9.96 | ||
| MRK 421 | ∘’ | 8610 | 315 | 8497 | 8650 | -1.64 | -9.35 | 2666 | 2667 | -0.02 | -9.64 | ||
| MRK 501 | ∘’ | 8969 | 318 | 9289 | 9246 | 0.45 | -9.18 | 2871 | 2855 | 0.30 | -9.62 | ||
| 1ES2344+514 | ∘’ | 10275 | 280 | 11733 | 11549 | 1.69 | -9.07 | 3681 | 3599 | 1.35 | -9.52 | ||
| 1ES1959+650 | ∘’ | 11664 | 340 | 9604 | 9711 | -1.08 | -9.39 | 2990 | 3096 | -1.90 | -9.80 | ||
| 3C66A | ∘’ | 9295 | 288 | 10198 | 10111 | 0.85 | -9.14 | 3139 | 3108 | 0.55 | -9.67 | ||
| H1426+428 | ∘’ | 9322 | 285 | 10108 | 10149 | -0.41 | -9.23 | 3133 | 3149 | -0.28 | -9.66 | ||
| TeV J2032+4130 | ∘’ | 9110 | 285 | 9724 | 9668 | 0.56 | -9.16 | 3004 | 2998 | 0.11 | -10.18 | ||
Note. — The meaning of the columns is (from left to right): right ascension (J2000), declination (J2000), total observation time of this sky region (), threshold energy (), number of measured events in this source region (), number of background events (), significance of deviation of from , and the upper flux limit () calculated with Eq. 1. The values are given for the whole data set and the selection of muon-poor events.