Late evolution of the X–ray afterglow of GRB 030329
The X–ray afterglow of the Gamma-Ray Burst GRB 030329 , associated to SN2003dh at =0.1685, has been observed with XMM–Newton 258 days after the burst explosion. A source with flux of (6.22.3) erg cm-2 s-1 (0.5-2 keV) has been detected at the GRB position. This measurement, together with a re–analysis of the previous X–ray observations, indicates a flattening of the X–ray light curve 40 days after the burst. This is in remarkable agreement with the scenario invoking the presence of two jets with different opening angles. The wider jet should be responsible for the observed flattening due to its transition into the non–relativistic Sedov–Taylor phase.
Key Words.:
Gamma Rays : bursts1 Introduction
Multifrequency studies of Gamma–Ray Burst (GRB) afterglows at late times (10 days) can be used to test some predictions of the standard, as well as alternative, models. This has been done so far for a handful of bursts (e.g., Frail, Waxman & Kulkarni 2000; Frail et al. 2004). Thanks to its high flux and low redshift (=0.1685, Greiner et al. 2003; Caldwell et al. 2003), GRB 030329 is an ideal target for such kind of investigations.
In fact GRB 030329 had a very large fluence of 10-4 erg cm-2 (30–400 keV, Ricker et al. 2003), in the top 1% of all detected GRBs, and its optical transient had magnitude 13 one hour after the explosion (Peterson & Price 2003; Torii 2003). GRB 030329 is also the first GRB unambiguously associated with a supernova (SN2003dh, Stanek et al. 2003; Hjorth et al. 2003). Systematic multiwavelength monitoring of its afterglow (e.g., Lipkin et al. 2004; Matheson et al. 2003; Tiengo et al. 2003; Sheth et al. 2003) is yielding important information for the understanding of the jet structure, GRB energetics and circumburst environment.
Here we report on a new XMM–Newton observation performed 258 days after the burst in order to study the late evolution of the X–ray afterglow. We also re–analysed the previous observations to derive in a consistent way all the X–ray fluxes in the 0.5-2 keV energy range. This is the range where the effective area of the XMM–Newton EPIC instrument is highest and the corresponding fluxes are less affected by uncertainties in the afterglow spectral shape.
2 Data analysis and results
XMM–Newton observed the position of GRB 030329 starting on December 12, 2003 at 7:30 UT, for an observation length of 24 hours. After excluding the time intervals affected by high particle background, the net exposure times were 68 and 73 ks, respectively in the PN and MOS cameras of the EPIC instrument (Strüder et al. 2001; Turner et al. 2001). All the cameras operated in Full Frame mode and with the thin optical blocking filter. The data were processed using SAS version 5.4.1.
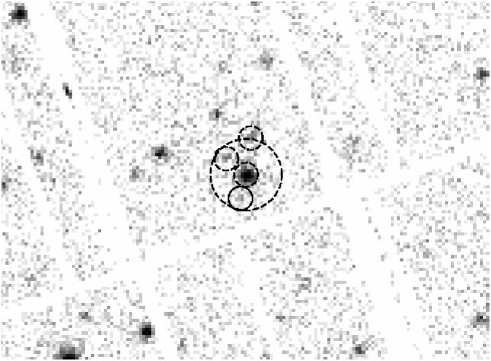
A faint source at the GRB position is visible, albeit barely, in the 0.5–10 keV images. The previous X–ray observations (Tiengo et al. 2003) indicated a rather soft spectrum and a low absorption, which, combined with the high effective area of the PN camera at very low energies, results in a significant fraction of the source counts in the 0.2–0.5 keV band. To increase the signal to noise ratio we therefore analyzed the data over the larger 0.2–10 keV range. This required an additional cleaning procedure111 we processed the PN data using an experimental version of the task “epchain” included in a development version of the SAS software to reduce the instrumental noise, which in the PN detector increases very rapidly below 0.4 keV. The resulting image is shown in Fig.1, where the small solid circle indicates the GRB 030329 position.
The estimate of the afterglow flux requires particular care, due to the proximity (30′′) of an X-ray emitting AGN, which in this observation was much brighter than the GRB afterglow. For this reason we followed different methods to estimate the background and the fraction of AGN counts falling in the source extraction region. For the afterglow counts we used a circular region with radius of 15′′ centered at the accurately known GRB position (Taylor et al. 2003). The total number of counts (i.e. background, AGN contamination, and afterglow) contained in this region is 148 for the PN and 174 for the sum of the two MOS.
With the first method, we estimated separately the background and the AGN contamination. The former was derived from a source free region (a circle of radius 40′′) in the same CCD chip, while our estimate of the latter was based on the well known model of the instrumental Point Spread Function (PSF, Ghizzardi 2002). We measured the net AGN counts within 15′′ from the AGN position (57226 in the PN and 45625 in the two MOS summed). The PSF model predicts that a number of counts corresponding to 5% and 4% of these values (for the PN and MOS cameras, respectively) will fall in the 15′′ radius GRB extraction region. Thus we finally obtain an estimate of 5019 net afterglow counts in the 0.2–10 keV energy band (3313 in the PN camera alone).
An alternative approach consists in directly measuring the background and AGN contamination based on an appropriate extraction region close to the afterglow position, as was done in Tiengo et al. (2003). In this way we obtain 5419 net afterglow counts in the 15′′ GRB extraction region (see Fig. 1).
As a further test we developed a maximum likelihood analysis program and used it to model the region of the 0.2–10 keV PN image containing GRB 030329 and the AGN. We used the appropriate PSF and let the positions and intensities of the two sources, as well as the background level, as free parameters. This yielded an intensity normalization for the afterglow corresponding to 34 PN counts within a radius of 15′′. The source positions, the background level and the AGN intensity derived in this way were also consistent with the values found with the methods described above.
In conclusion, since all methods gave consistent results, in the following we adopt the count estimate obtained with the first method, which corresponds to a 2.7 detection. Since the small statistics does not permit to carry out a detailed spectral analysis, a spectral model must be assumed to convert count rates to physical flux units. The spectra measured in the previous X–ray observations were well fitted by a power law. In the first Rossi–XTE observation the photon index could be tightly constrained at =2.17. The following observations, performed by XMM–Newton , gave a strong upper limit on the neutral hydrogen column density, which cannot differ substantially from the Galactic value of NH=2 cm-2. We have then verified that an absorbed power law with =2.17 and cm-2 gives an acceptable fit to all the X–ray spectra of the GRB 030329 afterglow measured up to now. We thus assume such a spectrum, which yields an observed flux (i.e. not corrected for the absorption) of (6.22.3) erg cm-2 s-1 in the 0.5–2 keV range.
3 The X–ray afterglow long term evolution
To derive the long term flux history of the afterglow in a consistent way, we have re-analyzed the two XMM–Newton observations of May 2003 using the procedures described above. In particular, we reprocessed the PN data with the new cleaning algorithm and verified that the different ways of estimating the AGN contamination gave consistent results.
As for the December observation, we finally adopt the values based on the first method: 50125 and 40025 net afterglow counts for the first and second observation, respectively. The light curve from the three XMM–Newton observations is well fit by a power law decay with index =1.450.2 (Fig. 2).
For a power law spectrum with =2.17 and cm-2, the above count rates correspond to 0.5–2 keV observed fluxes of (1437) and (795) erg cm-2 s-1, respectively 222the corresponding values in the 0.2–10 keV range ((35117) and (19412) erg cm-2 s-1) are slightly different, but consistent within the uncertainties, from those reported in Tiengo et al. (2003), which were derived from spectral fitting. These flux estimates do not change significantly if the spectral parameters are allowed to vary within their 90% confidence intervals (Tiengo et al. 2003).
To draw a complete X–ray light curve containing both the XMM–Newton and Rossi–XTE data, an extrapolation of the X–ray spectrum is unavoidable. In fact, most of the counts detected by EPIC have energies below 2 keV, while the PCA instrument of the Rossi–XTE satellite is not sensitive to such low energy photons. We therefore extracted the 0.5–2 keV fluxes of the Rossi–XTE observations from the best fit absorbed power law model to each PCA spectrum, obtaining the values reported in Table 1. The corresponding errors take into account the uncertainties on the spectral shape. The resulting light curve is shown in Figure 3. Fitting it with a single power law yields a time decay with =1.780.02 and reduced of 2.6.
| Time since burst | Satellite | 0.5–2 keV flux |
|---|---|---|
| (days) | (10-12 erg cm-2 s-1) | |
| 0.2065 | Rossi–XTE | 15315 |
| 0.2125 | Rossi–XTE | 14615 |
| 0.2185 | Rossi–XTE | 16215 |
| 0.2515 | Rossi–XTE | 13418 |
| 1.2762 | Rossi–XTE | 9.33 |
| 37.3 | XMM–Newton | 0.01430.0007 |
| 60.9 | XMM–Newton | 0.00790.0005 |
| 258.3 | XMM–Newton | 0.000620.00023 |
4 Discussion
As shown above, a single power law decay gives a marginally acceptable (1.6% c.l.) description of the X–ray afterglow from 5 hours to almost nine months from the burst.
The data presented in Tiengo et al. (2003) were consistent with a break in the X–ray light curve at t0.45 days. Similarly to the optical data available at that time, the decay slope changed from 0.9 to 1.9. Note that in Tiengo et al. (2003) we used fluxes in the 2–10 keV energy band, which was optimal to represent the observed flux in the PCA range, but implied a substantial extrapolation of the poorly constrained XMM–Newton spectra. This resulted in large errors on the XMM–Newton 2–10 keV fluxes. Due to the different energy range used here (0.5–2 keV), the points at t=37 and 61 days have smaller errors. They are not consistent with a slope of 1.9 but are instead fitted by a flatter power law (see Fig. 2).
In the following we give a more complex interpretation of the X–ray data driven by the two-jet model proposed by Berger et al. (2003). Although this is not the unique way to fit the X–ray light curve, it has the advantage of explaining the complete X–ray data set presented here as a natural consequence of an already published interpretation of the light curves at optical and radio wavelengths.

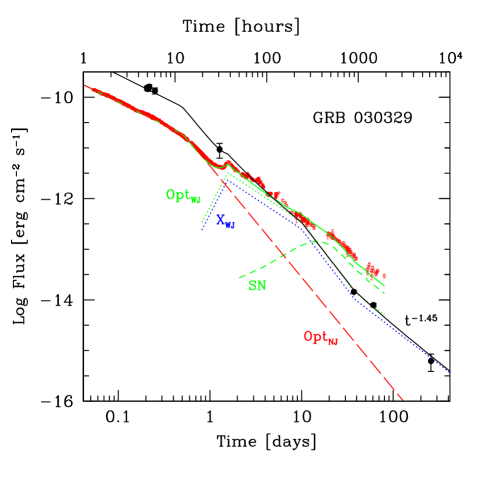
On the basis of multifrequency radio data, Berger et al. (2003) suggested that GRB 030329 is characterized by a two–component jet, with different opening angles (5 and 17 degrees). The wide jet has an intrinsic kinetic energy, corrected for collimation, of erg, while the narrow jet emits an intrinsic –ray energy of erg. Both jets are assumed to move in an interstellar medium with a constant density of cm-3. The initial part of the optical and X–ray afterglow should originate from the narrow jet, while the wide jet should be responsible for the radio flux, the late X–ray afterglow, and it also explains the resurgence of the optical flux after 1 day (Berger et al. 2003; Sheth et al. 2003; Lipkin et al. 2004).
The isotropic equivalent energies of the two jets are erg (narrow jet, assuming a kinetic to gamma–rays conversion factor of =0.2) and erg (wide jet). As a consequence, the wide jet should become non–relativistic earlier than the narrow jet. The transition to the non–relativistic Sedov–Taylor phase manifests itself through a change in the decaying slope of the flux, which becomes , where in the case of constant density medium, and is the slope of the injected relativistic electron distribution. In our case, for any reasonable value of , the transition should give a flattening of the light curve, if it occurs after the jet break.
The time of such a transition is not unambiguously predicted theoretically, but for GRB 970508 (=0.835) it was seen to occur at days (Frail, Waxman & Kulkarni 2000). Since in that case an isotropic equivalent total kinetic energy of erg and cm-3 were estimated, we can assume
| (1) |
This value is also consistent with theoretical expectations (see e.g. Dai & Lu 1999; Livio & Waxman 2000; Huang, Dai & Lu 1998) and also with the interpretation given by Berger (2003) of the radio light curve of GRB 980703. With the parameters derived by Berger et al. (2003) for the wide jet component of GRB 030329, we obtain
| (2) |
which is close to the time of the first XMM–Newton observation. The flat time decay () can thus be explained by the wide jet component which becomes non–relativistic. This value of gives a slope of the electron distribution , corresponding to an X–ray spectrum with . The XMM–Newton spectra are consistent with this value333the coincidence with the spectral slope derived by the first Rossi–XTE observation is, in this scenario, a pure coincidence, since the early X–ray emission is due to the narrow jet..
At these late times, the cooling frequency is already below the optical band. Therefore, the optical and the X–ray light curves should have the same decay slope. After accounting for the contribution from the supernova, Berger et al. (2003) and Lipkin et al. (2004) derived 2.35 between day 10 and day 40 (i.e. after the jet break of the wide jet). This is in agreement with the expected value (Sari, Piran & Halpern (1999)). Note that the optical light curve after 40 days is dominated by the supernova light, which masks the predicted flattening.
Finally, we would like to caution the reader that there may exist other possible interpretations of the observed flattening of the X–ray light-curve. In the cannonball scenario (e.g. Dado, Dar & De Rujula 2002) a flattening of the light curve can be associated to the afterglow contribution of a new cannonball: indeed, in Dado, Dar & De Rujula (2004) the optical afterglow of GRB 030329 is explained with two cannonballs (plus the SN contribution) up to 70 days after the trigger. A flattening of the X–ray light-curve could then be possible if a third cannonball starts to contibute in the X–ray band (but not in the optical, which is dominated by the SN light). However, the number of cannonballs should be equal to the number of main pulses in the prompt –ray emission, which are only two in GRB 030329.
In the dyadosphere model (e.g. Ruffini et al. 2003), a flattening of the light-curve is predicted, as in the more conventional fireball scenario, when a transition to the Newtonian expansion occurs, but other features specific to GRB 030329 (such as the break at days) would remain unexplained.
5 Conclusions
The combination of the exceptional brightness of GRB 030329 and the high sensitivity of XMM–Newton has allowed us to study a GRB X–ray afterglow up to very late time, leading to a 3 detection of the afterglow 258 days after the burst.
Although other interpretations are possible, the XMM–Newton data at 37, 61 and 258 days are consistent with the X–ray light curve being dominated by the wide jet component envisaged by Berger et al. (2003), Lipkin et al. (2004) and Sheth et al. (2003). In particular, and more importantly, we have evidence that this component became non–relativistic at 40 days after the GRB explosion, in remarkable agreement with what predicted assuming the parameters (kinetic energy and density of the external medium) derived by the above authors by fitting the radio and optical light curves. The immediate prediction of this interpretation is that also the radio light curve should show a flattening from to after 40 days. The publicly available radio data at these late times have large uncertainties and cannot exclude such a behavior. Only further analysis of more radio data could settle this issue. The lack of a flattening in the radio light curve would imply that the fireball has not yet reached the non–relativistic phase, due to a larger total kinetic energy of the wide jet and/or a smaller density for the interstellar medium. This would then require a different reason for the observed flattening in the X–ray light curve, e.g. a larger supernova contribution in the X–ray band. This would imply an X–ray luminosity at least one order of magnitude higher than that observed in other type Ic and II supernovae (see Fig. 3 of Kouveliotou et al. (2004)).
Acknowledgements.
Based on observations obtained with XMM–Newton , an ESA science mission with instruments and contributions directly funded by ESA Member States and NASA. We thank the XMM–Newton Project Scientist Fred Jansen for granting time to observe this source and Davide Lazzati for useful discussions. This work has been supported by the Italian Space Agency and by MIUR (COFIN 2003020775).References
- Berger (2003) Berger, E. 2003, astro–ph/0304346
- Berger et al. (2003) Berger, E., Kulkarni, S. R., Pooley, G., et al. 2003, Nature, 426, 154
- Caldwell et al. (2003) Caldwell, N., et al. 2003, GCN Circ. 2053
- Dai & Lu (1999) Dai, Z. G., & Lu, T. 1999, ApJ, 519, L155
- dado (1) Dado, S., Dar, A. & De Rujula, A., 2002, A&A, 388, 1079
- dado (6) Dado, S., Dar, A. & De Rujula, A., 2004, astro–ph/0402374
- Frail, Waxman & Kulkarni (2000) Frail, D. A., Waxman, E., & Kulkarni, S. R. 2000, ApJ, 537, 191
- Frail et al. (2004) Frail, D. A., Metzger, B. D., Berger, E., Kulkarni, S. R., & Yost, S. A. 2004, ApJ, 600, 828
-
Ghizzardi (2002)
Ghizzardi, S. 2002, “In flight calibration of the PSF for the PN camera”, http://xmm.vilspa.esa.es/external/xmm_sw_cal
/calib/documentation.shtml - Greiner et al. (2003) Greiner, J., et al. 2003, GCN Circ. 2020
- Hjorth et al. (2003) Hjorth, J., Sollerman, J., Meller, P., et al. 2003, Nature, 423, 847
- Huang, Dai & Lu (1998) Huang, Y. F., Dai, Z. G., & Lu, T. 1998, A&A, 336, L69
- Kouveliotou et al. (2004) Kouveliotou, C., Woosley, S. E., Patel, S. K., et al. 2004, subm. to ApJ, astro–ph/0401184
- Lipkin et al. (2004) Lipkin, Y. M., Ofek, E. O., Gal–Yam, A., et al. 2004, astro–ph/0312594
- Livio & Waxman (2000) Livio, M., & Waxman, E. 2000, ApJ, 538, 187
- Matheson et al. (2003) Matheson, T., et al. 2003, ApJ, 599, 394
- Peterson & Price (2003) Peterson, B. A., & Price, P. A. 2003, GCN Circ. 1985
- Ricker et al. (2003) Ricker, G. R., et al. 2003, IAU Circ. 8101
- (19) Ruffini, R., Bianco, C.L., Chardonnet, P., Fraschetti, F., Vitagliano, L. & Xue, S.S., 2003, Xth Brazilian School of Cosmology and Gravitation, M. Novello, editor, AIP, in press, astro–ph/0302557
- Sari, Piran & Halpern (1999) Sari, R., Piran, T., & Halpern, J. P. 1999, ApJ, 519, L17
- Sheth et al. (2003) Sheth, K., Frail, D. A., White, S., et al. 2003, ApJ, 595, L33
- Stanek et al. (2003) Stanek, K. Z., et al. 2003, ApJ, 591, L17
- Strüder et al. (2001) Strüder, L., et al. 2001, A&A, 365, L18
- Taylor et al. (2003) Taylor, G. B., Berger, E., Frail, D. A., & Kulkarni, S. R. 2003, GCN Circ. 2129
- Tiengo et al. (2003) Tiengo, A., Mereghetti, S., Ghisellini, G., et al. 2003, A&A, 409, 983
- Torii (2003) Torii, K. 2003, GCN Circ. 1986
- Turner et al. (2001) Turner, M. J. L., et al. 2001, A&A, 365, L27