The Counter Arc to MS1512-cB58 and a Companion Galaxy111 Data presented herein were obtained at the W.M. Keck Observatory, which is operated as a scientific partnership among the California Institute of Technology, the University of California and the National Aeronautics and Space Administration. The Observatory was made possible by the generous financial support of the W.M. Keck Foundation.
Abstract
We present near-infrared spectra of “A2”, the primary counter arc to the gravitationally lensed galaxy MS1512-cB58. The spectra show redshifted H, [NII], [OIII], and H at . We observe the same H/[OIII] ratio as cB58, which together with the redshift confirms that A2 is indeed another image of a single background galaxy. Published lensing reconstruction reports that A2 is a magnification of the entire source, while cB58 is an image of only a part. At marginal significance, A2 shows higher line to continuum ratios than cB58 (by a factor of ), suggesting a non-uniform ratio of young to old stars across the galaxy. We observe a second emission line source in the slit. This object, “W5”, is predicted to be a lensed image of another galaxy at a redshift similar to cB58. W5 is blueshifted from cB58 by km s-1 and has a significantly lower H/[OIII] ratio, confirming that it is an image of a different background galaxy in a group with cB58. The H emission line in W5 implies a star formation rate of 6 ( km s-1 Mpc-1, ), after correcting for lensing magnification.
1 Introduction
Most of the detailed spectral information on galaxies has come from observation of the rest-frame ultraviolet redshifted into the optical passband. The Lyman Break Galaxies (LBGs; Steidel et al. 1996, 2003) are strongly starbursting galaxies, and in principle may be the tracers of the global star formation history of the universe (Madau et al. 1998) if the effects of dust extinction on the UV continuum can be quantified. The average attenuation from dust has been suggested to be between a factor of and 10 (Pettini et al. 1998; Trager et al. 1997). Even with the advent of IR spectrographs on large telescopes, only a few dozen starbursts have been spectroscopically observed in the rest frame optical (e.g. Teplitz et al. 2000a, 2000b; Kobulnicky & Koo 2000; Pettini et al. 1998, 2001; Lemoine-Busserolle et al. 2003; Erb et al. 2003).
MS1512-cB58 (hereafter cB58) is a strongly lensed, but otherwise typical, star-forming galaxy at z=2.729 (Yee et al. 1996; Seitz et al. 1998, hereafter S98). Its magnification by a factor of makes it the apparently brightest LBG known. Spectra have been obtained in the rest-frame UV (Pettini et al. 2000) and optical (Teplitz et al. 2000b, hereafter T00). Lensing reconstruction identifies another faint source in the same field as a counter arc to cB58 (S98). This object, designated “A2” by S98, is a magnification of a different part of the same background source. Thus the gravitational lensing provides a means to spatially resolve the observations of this intrinsically faint source. Reconstruction shows that cB58 is a magnification of only half of the source galaxy, including the nucleus, and that A2 is a magnification of the entire source.
The lensing model also identifies several other faint objects as probable arclets that are magnified by the foreground cluster (see S98 and their Figure 1). At least four background objects are likely to be lensed: the A source, magnified as cB58 and A2; the B source, possibly at ; the C source, most likely at a redshift slightly larger than cB58; and the W source, which should have a redshift similar to cB58. The W system of consists of five arclets: three sources with “shrimp-like” morphologies in the Hubble Space Telescope (HST) imaging; a fourth, very faint source; and a probable 5th image with an uncertain predicted location.
In this paper, we present near-infrared (NIR) spectra and K′ imaging of A2 and the probable fifth image of the W source, which we call W5. The data were obtained with the NIRSPEC instrument on the Keck II telescope. We also compare our new observations with archival HST imaging of the objects. Throughout the paper, we will adopt a flat, -dominated universe ( km s-1 Mpc-1, ).
2 Observations and Data Reduction
2.1 Spectroscopy
On 4 April 2002, we obtained the NIR spectrum of A2, using NIRSPEC (McLean et al. 1998, 2000) on the 10-m W. M. Keck II telescope. Observations were taken in the low resolution, long slit mode, using a four pixel wide slit (0.76′′). Spectra were obtained in both the H and K bands (1.5-2.5 m). In this mode, the instrumental resolution is . The weather was photometric and seeing was very good during the observations, with point source full width at half maximum (FWHM) of 0.4′′ or better throughout. The spectra were obtained with the N6 and N7 filters, corresponding roughly to the H- and K bands respectively. Individual integration times were 600 seconds. The telescope was nodded along the slit between exposures to facilitate sky subtraction. The total integration times were 1800 and 3600 seconds in the H- and K-bands respectively.
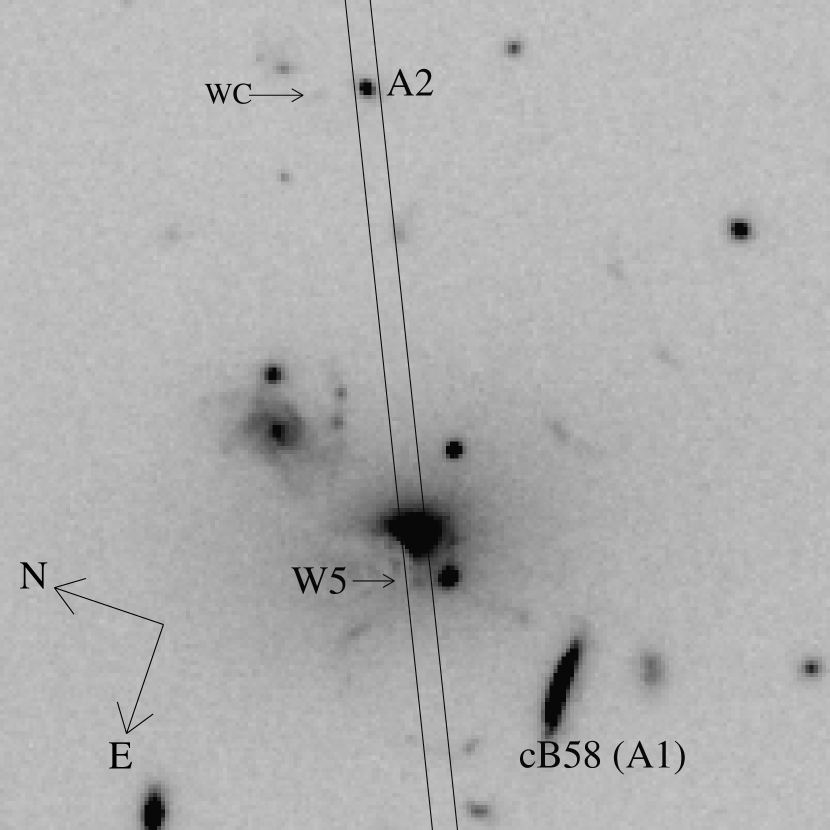
The slit was rotated to a position angle chosen to observe both a bright reference object and A2. The reference object facilitates registration of nodded observations and allows us to monitor the guiding during the observation. By choosing the cD galaxy at the center of the MS1512 cluster for our reference, we also placed W5 in the slit. The position angle of the slit was 294.58∘ East of North. Figure 1 shows the orientation and location of the slit.
To reduce systematic uncertainties, we observed the same calibration stars used by T00 for atmospheric extinction correction and flux calibration. These stars are a G star for the H-band (PPMM 130690) and an A2V star for the K-band (HR5569). Halogen flat fields and spectra of argon and neon arc lamps were taken immediately after the target observations and before moving the mechanisms, in order that the calibration most closely reproduce conditions during the observations.
Data were reduced following the procedures in T00 and Teplitz et al. (2000a). Standard IDL and IRAF444IRAF is distributed by NOAO, which is operated by AURA Inc. under contract to the NSF. routines were used for flat fielding and fixing bad pixels. Rectification of the 2D spectra was performed using custom IDL software, which uses linear interpolation to independently rectify the spatial and spectral dimensions. The output pixel scale is 4.16Å/pix, and unresolved arc lines have Å, for a final resolution of at 1.6 m.
For spectroscopy of faint objects in the near-IR, sky subtraction is a crucial step. The sky frame for each observation was made by scaling the other half of the nodded pair. The OH sky lines vary independently from each other and therefore must be scaled individually. Each nodded pair was rectified in two dimensions and a scaling factor determined for each row (the spatial dimension). Then the image of scaling factors was de-rectified onto the original pixel scale and applied to the unrectified sky image. By subtracting the sky in original pixels, we obtain better signal to noise, because the interpolation in the process is of the scaling factor.
The sky-subtracted spectra were then rectified in two dimensions and the nodded pairs registered. The final 2D spectrum was a weighted mean of the individual frames. Weights were determined using variation in the brightness of the reference object, under the assumption that such variation was the result of small guiding errors. A 1D spectrum was extracted using an optimal extraction vector determined from the calibration star continuum shape. Extracted spectra were corrected for atmospheric absorption using the standard stars. Flux calibration also relied on the calculation of flux density per data number per pixel in the standard star.
2.2 Imaging
NIRSPEC’s slit-viewing camera, SCam, images a area around the entrance slit in parallel with spectroscopic observations. The camera has a pixel (PICNIC) HgCdTe array detector, with a plate scale of 0.18′′ per pixel. During setup for the first spectrum, we used the SCam to observe the MS1512 field in the K′ filter. Four 60 second, dithered exposures were taken, each consisting of 4 coadds of 15 seconds. The images were reduced using standard IRAF procedures. A flat field was created from the median of all K′ observations throughout the night. We were unable to observe photometric standard stars in the same filter during that night; however, we use the image to measure differential photometry from published values for cB58 (Ellingson et al. 1996).
WFPC2 optical images of the field were obtained from the Hubble Space Telescope archive. The data were processed by the Space Telescope Science Institute as part of the new WFPC2 associations archive555http://archive.stsci.edu/hst/wfpc2/, which provides mosaiced data combined using the drizzle technique (Fruchter & Hook 2002). Data were originally obtained by the programs GO 6003 (Saglia et al., see S98) and GO 6832 (Yee et al.). Fully-reduced mosaics were available in the archive in the F555W, F675W, and F814W filters, corresponding roughly to the V, R, and I passbands, with exposure times 19,800 seconds, 10,400 seconds, and 7600 seconds respectively.
In both the WFPC2 and K′ images, the flux in cB58 is measured using ellipse fitting to establish the curve of growth. The flux is then scaled to the photometry from Ellingson et al. (1996) to establish relative zero points for the images. A2 is well separated from nearby objects and we measure its flux using aperture photometry. The W5 photometry is contaminated by its juxtaposition with the foreground cD galaxy. We measure the flux from W5 in a small aperture (0.3 arcsecond radius). To estimate contamination from the cD galaxy, we measure the same aperture in other regions of the cD galaxy at equal distance from its center. We then perform an aperture correction to estimate W5’s total flux, basing the correction on the curve of growth of A2. To check this procedure, we also measured W5 in an image with a model of the cD galaxy subtracted (from S98) and obtained results consistent at the 20% level.
2.3 Equivalent Widths
In order to compare the new observations directly with the spectrum of cB58, we have re-reduced that data to use the same flux calibration technique. In T00, the flux calibration relied on measurement of the equivalent width using the continuum in the spectrum. They performed a linear fit to the continuum across the entire wavelength range (either J, H or K) and used the derived flux at the wavelength of each emission line in the calculation of the equivalent width (EW). This procedure was not fully explained in the text of T00.
In the present data, EWs cannot be measured directly from the spectra, because detection of the continuum is poor. Instead, the EW of lines in A2 is estimated as the ratio of the measured flux to the continuum flux density in the photometry. The flux density is normalized to the median wavelength of the filter, and the slope of the continuum is assumed to match that measured in cB58. H-band photometry is not yet available for A2 or W5. For A2, we assume that the H-K color is the same as in cB58. The optical colors are of the two counterparts are nearly identical. This assumption introduces an unknown uncertainty into our ability to compare the EW([OIII]) of A2 to cB58.
The K-band photometry of W5 has a low signal to noise ratio, and the H-K color is not known, so EWs are not estimated for W5. The lines must have fairly high equivalent width to be detectable, given how faint W5 is in the continuum. We do not detect the continuum in the spectra, but the lines are convincingly real. Each line is detected in each of the individual exposures of each nodded pair of spectra.
2.4 Estimating the Uncertainties
Each step in the calculation of the EW has an associated uncertainty:
First, we measure the line intensity in DN and convert to flux using the spectrophotometric calibration from the standard star. The spectrophotometric calibration is uncertain due to our knowledge of the standard star and the variation in the atmosphere between the observations of the source and of the standard. Together, we assume those factors introduce a 10% uncertainty. The measurement of the line is uncertain due to shot noise in the background and Poisson noise in the source. We measure these from the square root of an extracted sky spectrum added to the object spectrum.
Next, we divide by the flux density of the continuum under the line, assuming the slope of the continuum in A2 matches that in cB58. The linear fit is uncertain at the 5% level (based on repeated measurements of the cB58 spectrum). The linear fit is normalized by the photometric measurement, which has less than 10% uncertainty for cB58, but has 16% uncertainty in A2.
Finally, as noted above, the [OIII] measurement has additional (unquantified) uncertainty due to the current lack of H-band photometry.
3 Results
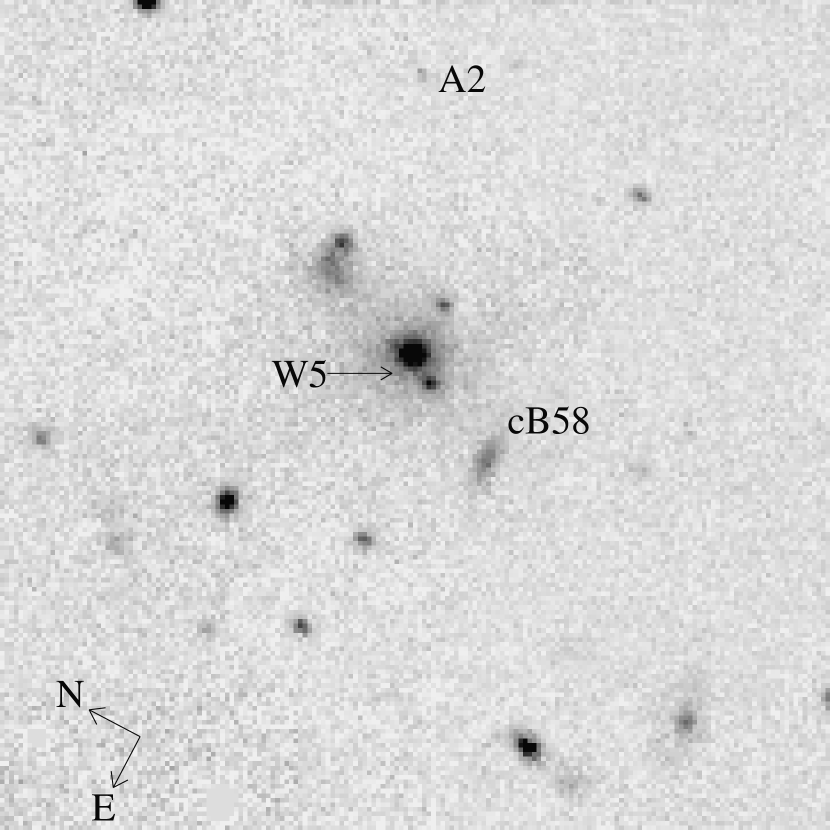
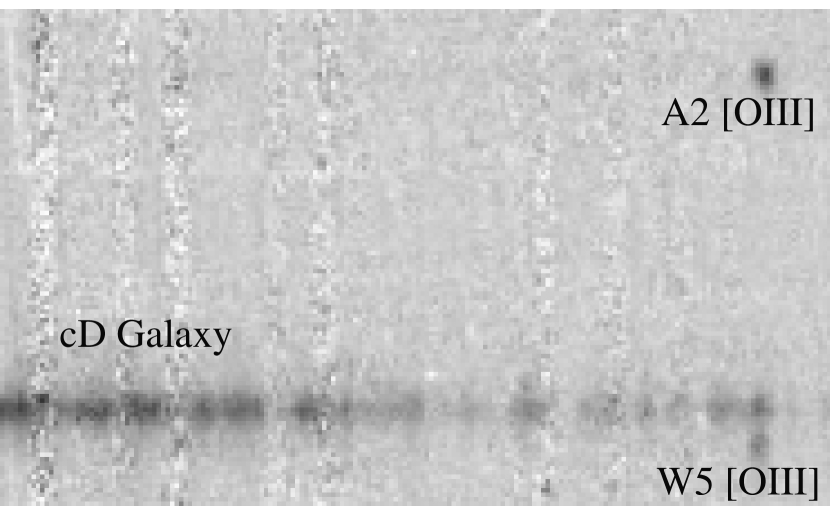
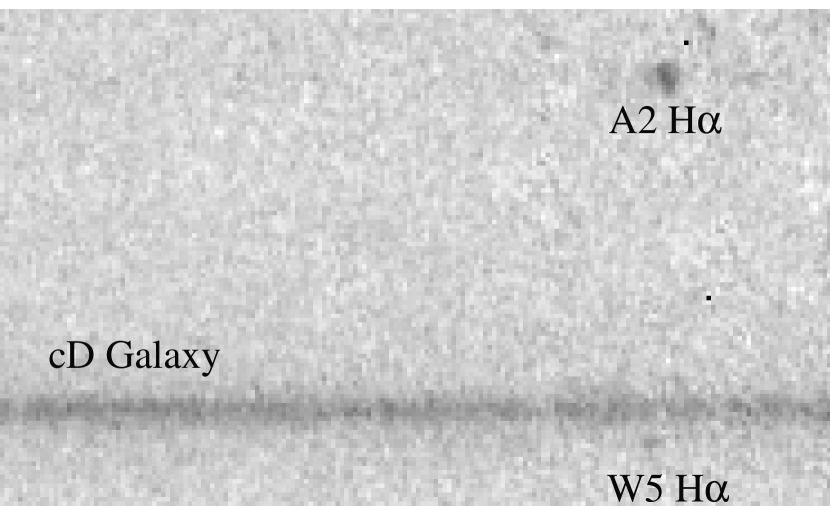
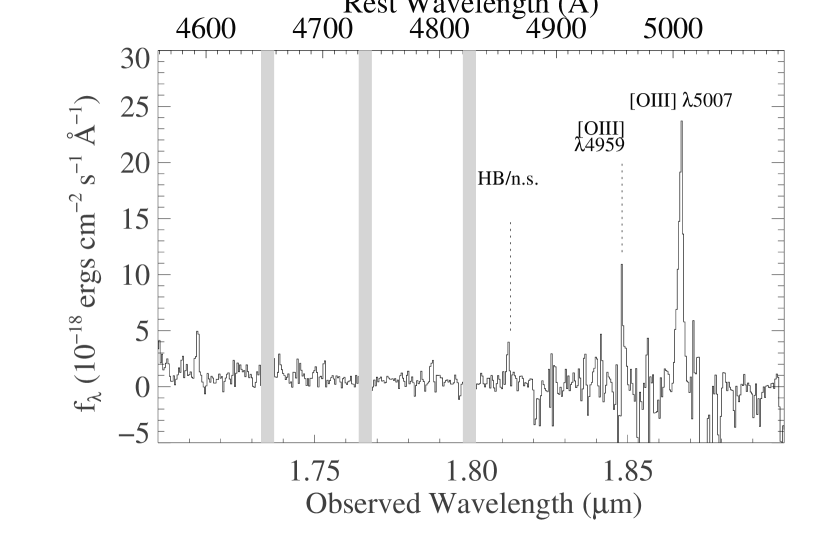
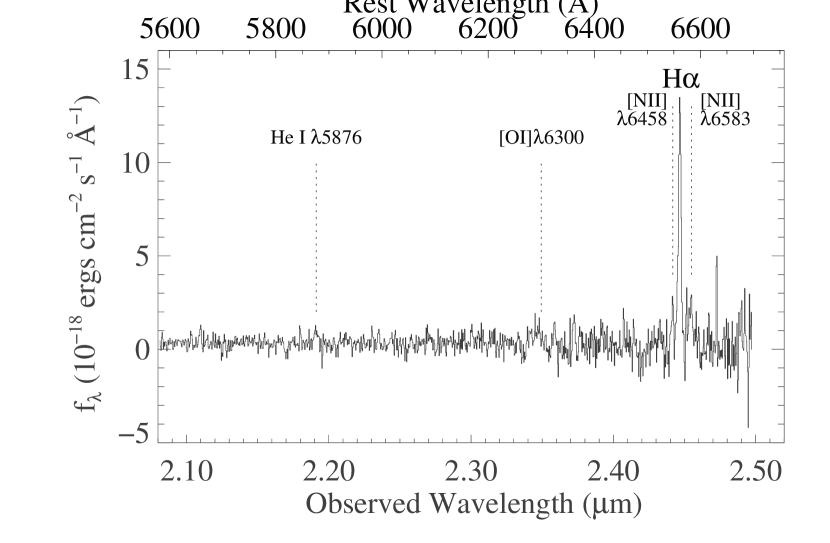
Figure 2 shows the NIRSPEC-SCam K-band image of the MS1512 field. Table 1 lists the photometry measured in the WFPC2 and NIRSPEC imaging. Figure 3 shows the two dimensional NIRSPEC spectra; Figures 4 and 5 show the extracted H and K spectra of A2 and W5. We clearly detect the [OIII] doublet and H in both objects. H falls partially on a night sky line. Table 4 gives the measured flux for the H and [OIII] 5007Å emission lines.
3.1 Comparison of A2 and cB58
The spectra confirm that A2 is a magnification of the same source galaxy as cB58. Their redshifts are nearly identical, compared to (T00). The -band WFPC2 photometry is consistent with the S98 measurements from separate reduction of the same data. The additional - and K-band data confirm the brightness and therefore that the magnification of A2 is times less than that of cB58.
Any possible differential velocity between A2 and cB58 must be less than 125 km s-1. This small velocity difference provides no evidence of a systematic rotational velocity across the face of the source galaxy. Erb et al. (2003) observe rotational velocities of km s-1 from H in LBGs at . Only the largest values of in their sample would be detectable with the resolution we obtain in comparing A2 and cB58. That is, if were calculated only twice for each galaxy in the Erb et al. sample (once averaged over the entire source, and once averaged of half the source), then only the largest would be detected. Lemoine-Busserolle et al. (2003) observe velocity gradients of km s-1 in spatially resolved NIR spectra of galaxies. Gradients of that magnitude are detectable with our resolution.
The limit on rotational velocity in the A source is consistent with the value inferred from the emission line widths. The FWHM of lines detected in cB58 suggests km s-1, after correcting for instrumental resolution. None of the emission lines in A2 are resolved in velocity. Given the four-pixel entrance slit, this velocity resolution limit is km s-1, which is consistent with cB58. The resolution of the A2 spectra is lower than in the cB58 observation, because we used a wider entrance slit for A2.
Comparison of the characteristics of A2 and cB58 provide spatially resolved information about the source galaxy. The ratio of the strongest emission lines (H, [OIII]) is the same, within the uncertainties, for the two arcs. Better measurements are needed to estimate metallicity from the A2 spectra. Detections of H and [OII] would allow us to infer the oxygen abundance from the ([OII] + [OIII])/H ratio, which is often denoted (Pagel et al. 1979). Nonetheless, the H:[OIII] ratio suggests that the metallicity is the same in A2 as cB58, indicating no metallicity gradient in the source galaxy. A strong spatial variation of the extinction could also cause a difference in the emission-line ratio, so we conclude that the extinction has no strong gradient.
[NII] is marginally detected. Its EW is consistent with cB58 as measured by T00, but we cannot rule out a factor of two overestimate in the previous measurement as suggested by Pettini et al. (2002). The nitrogen abundance sets a lower limit on the age of the galaxy if it is high enough to require a secondary phase of metal production (Kobulnicky & Zaritsky 1999). The Pettini et al. estimate suggests that such a phase is not needed.
A possible difference between cB58 and A2 is that the EW of the strong emission lines in A2 is larger than that observed in cB58. This difference is significant only at the 2.5 level in the current data, but is nonetheless intriguing. We assume that the continuum comes mostly from older stars and that the strong emission lines are reprocessed radiation from young stars. The difference in EW, then, may result from a non-uniform distribution of recent star formation across the face of the source galaxy. Adopting this explanation, we infer the relative the star formation rate (SFR) in the two images of the A source. From Kennicutt (1998): . The SFR of A2 is 144 M⊙/yr, only a factor of four lower than cB58, compared to a magnification ratio of 11. The lensing reconstruction (S98) shows that cB58 is a magnification of only half the galaxy, including most of the nuclear region. It is unlikely, therefore, that the difference is simply the result of nucleus-centered star formation.
The apparent EW difference between A2 and cB58 is strikingly large. Both images encompass at least half of the source galaxy. Thus, an EW ratio of two would imply that the part of the galaxy not magnified into cB58 has a line to continuum ratio that is three times larger of the other half. This difference would be surprising for a galaxy that does not have an highly irregular morphology. Although, there are examples of intrinsically asymmetric starbursts at similar redshift (Lowenthal et al. 1996), perhaps the results of mergers (Conselice et al. 2003), there is no indication of such asymmetry in the HST image of cB58. In fact, S98 suggest that, contrary to our results, cB58 should be a “zoom” into the region of highest star formation density.
3.2 Confirmation of W5
The location of W5 is consistent with the position of a lensing arc of the W source galaxy as predicted by S98. We convincingly measure H and [OIII], although the continuum is too faint for detection. From the optical emission lines, we infer a systematic redshift of . This redshift confirms the S98 prediction that the W source is a different galaxy than the A source, although both are at similar redshift.
The faintest component of the W system, WC (see Figure 1), has a magnitude of (S98). WC is too faint to be seen in the NIRSPEC K-band image. Extinction by the cD galaxy may suppress the observed -band flux of W5, but it is about a magnitude brighter than WC, so it appears to be magnified by at least that much. The -band detection of W5 is consistent with this estimate, but the -band fluxes of both W5 and WC are more uncertain. The one magnitude of magnification is small compared to the factor of 10 by which the W1 component of the system is magnified (S98).
From the magnification-corrected H emission line, we can infer SFR of the W source. A magnification factor of 2.5 suggests an unlensed SFR of 6 . It is impractical to infer the SFR from the UV continuum of W5, given the extinction by the cD galaxy. We can estimate the redshifted 1500Å continuum of the W source from the F555W flux of its other lensed images. The UV continuum implies SFR (Kennicutt 1998). This factor of four difference between the SFRs inferred from H and the UV, is the same as the difference observed for cB58.
The H/[OIII] ratio in W5, , is significantly lower than in the A source. This ratio is an upper limit, as one might expect there to be some absorption by the foreground cD galaxy. It is tempting to explain the difference in the H/[OIII] ratio between the W5 and cB58 (i.e. the A source) as the result of lower intrinsic reddening in the W source. However, we have seen that the ratio of SFRs inferred for the W source from UV-continuum and H is consistent with the extinction in the cB58, E(B-V) (T00; Pettini et al. 2000; Baker et al. 2001). Apart from reddening, the stronger [OIII] emission in W5 could also be a sign that it has lower metallicity than cB58. Oxygen line strengths in sub-solar metallicity galaxies can decrease with increasing oxygen abundances due to cooling. A lower limit on this effect occurs at , because the lack of oxygen atoms reduces the line strength (i.e. Kobulnicky et al. 1999). The W source is likely to have relatively low metallicity; most LBGs have oxygen abundances of several tenths of solar (Pettini et al. 2001), and metallicity is typically lower in less massive star forming galaxies (i.e. Melbourne & Salzer 2002). Finally, the [OIII] strength in W5 could be an indication of an active nucleus. However, we do not detect other lines that might be expected from a narrow-line Seyfert (such as strong [OI] 6300Å) or the presence of broadened wings to the Balmer line.
We do not know the transverse separation of the A and W sources in the spatial dimension, but we expect that it is smaller than the apparent separation between the counter arcs. The separation of cB58 and A2 is 15.3′′, and the widest separation in the W system is comparable. At , this implies a proper distance of 121 kpc. Such a separation suggests these objects are not interacting, but may be in a small group. It is possible that other potential lensed objects in the system are at the same redshift. Some members of the same group may lie outside the region magnified by the foreground lensing cluster.
4 Discussion
The large magnification of cB58 makes it an important target for available instrumentation at many wavelengths. For example, it is a planned target for Spitzer guaranteed time observations, which will probe the star-formation and dust content of such galaxies. The addition of the counter arc, A2, and the companion galaxy, W, serve to increase the return on future observations of the field. We expect that confirmation of the C and possibly B sources will soon show them to be members the same group.
We have shown that A2 is the counter image of MS1512-cB58. The spatial resolution provided by differential magnification suggests an uneven distribution of star-forming regions in the source galaxy. The rotational velocity limit obtained from the A2 spectrum supports other observations of LBGs at somewhat lower redshift. We have also confirmed the existence of the companion W source, which is intrinsically fainter than the A source. The probable lower metallicity in the W source might be evidence of the luminosity-abundance relationship at high redshift (Kobulnicky et al. 2003).
These lensed LBGs are valuable examples of moderate luminosity galaxies. The magnification enables detailed studies of average luminosity galaxies at high redshift. A larger sample is still needed, however, to draw more general conclusions. Other galaxy clusters offer magnified star-forming galaxies at high redshift as well (i.e. Fosbury et al. 2003), but so far none of comparable brightness have been discovered. Future study of lensed LBGs will extend to higher redshifts (i.e. Ellis et al. 2001). In fact, the observation of gravitationally lensed sources may reveal the highest redshift and intrinsically faintest sources (Pelló et al. 2003).
References
- (1)
- (2) Baker, A. J., Lutz, D., Genzel, R., Tacconi, L. J., & Lehnert, M. D. 2001, A&A, 372, 37
- (3)
- (4) Conselice, C.J., Bershady, M.A., Dickinson, M., & Papovich, C. 2003, AJ, 126, 1183
- (5)
- (6) Ellingson, E., Yee, H.K.C, Bechtold, J., & Elston, R. 1996, ApJL 466, 71
- (7)
- (8) Ellis, R., Santos, M. R., Kneib, J.-P., Kuijken, K. 2001, ApJ, 560, 119
- (9)
- (10) Erb, D. K., Shapley, A. E., Steidel, C. C., Pettini, M., Adelberger, K. L., Hunt, M. P., Moorwood, A. F. M., & Cuby, J.-G. 2003, ApJ in press, astro-ph/0303392
- (11)
- (12) Fosbury, R.A.E., et al. 2003, in press, astro-ph/0307162
- (13)
- (14) Fruchter, A. S. & Hook, R. N. 2002, PASP, 114, 144
- (15)
- (16) Kennicutt, R. C., Jr. 1998, ARA&A, 36, 189
- (17)
- (18) Kobulnicky, H.A., Kennicutt. R.C. Jr., & Pizagno, J.L. 1999, ApJ, 514, 544
- (19)
- (20) Kobulnicky, H. A. & Zaritsky, D. 1999, ApJ, 511, 118
- (21)
- (22) Kobulnicky, H. A. & Koo, D. C. 2000, ApJ, 545, 712
- (23)
- (24) Kobulnicky, H. A., et al. 2003 in press, astro-ph/0305024
- (25)
- (26) Lemoine-Busserolle, M., Contini, T., Pelló, R., Le Borgne, J.-F., Kneib, J.-P., & Lidman, C. 2003, A&A, 397, 839
- (27)
- (28) Lowenthal, J. D., et al. 1997, ApJ, 481, 673L
- (29)
- (30) Madau, P., Pozzetti, L., & Dickinson, M. 1998, ApJ, 498, 106
- (31)
- (32) McLean, I. S., et al. 1998, SPIE, Vol. 3354, 566
- (33)
- (34) McLean, I. S., Graham, J. R., Becklin, E. E., Figer, D. F., Larkin, J. E., Levenson, N. A., & Teplitz, H. I. 2000, SPIE, 4008, 1048
- (35)
- (36) Melbourne, J., & Salzer, J.J. 2002, AJ, 123, 2302
- (37)
- (38) Pagel, B.E.J., Edmunds, M.G., Blackwell, D.E., Chun, M.S. & Smith, G. 1979, MNRAS, 189, 95
- (39)
- (40) Pelló, R., et al. 2003, to appear in To appear in ”Gravitational Lensing: a unique tool for cosmology”, ASP Conf. S., eds. D. Valls-Gabaud & J.-P. Kneib; astro-ph/0305229
- (41)
- (42) Pettini, M., Kellogg, M., Steidel, C.C., Dickinson, M., Adelberger, K.L., & Giavalisco, M. 1998, ApJ, 508, 539
- (43)
- (44) Pettini, M., Steidel, C.C., Adelberger, K.L., Dickinson, M., & Giavalisco, M. 2000, ApJ, 528, 96
- (45)
- (46) Pettini, M., Shapley, A. E., Steidel, C. C., Cuby, J.-G., Dickinson, M., Moorwood, A. F. M., Adelberger, K. L., & Giavalisco, M. 2001, ApJ, 554, 981
- (47)
- (48) Pettini, M., Rix, S. A., Steidel, C. C., Adelberger, K. L., Hunt, M. P., & Shapley, A. E. 2002, ApJ, 569, 742
- (49)
- (50) Seitz, S., Saglia, R.P., Bender, R., Hopp, U., Belloni, P., & Ziegler, B. 1998, MNRAS 298, 945 (S98)
- (51)
- (52) Steidel, C.C., Giavalisco, M., Pettini, M., Dickinson, M., & Adelberger, K.L. 1996, ApJ Letters, 462, L17
- (53)
- (54) Steidel, C.C., Adelberger, K.L., Shapley, A.E., Pettini, M., Dickinson, M., Giavalisco, M. 2003, ApJ in press, astro-ph/0305378
- (55)
- (56) Teplitz, H.I. et al. 2000a, ApJ, 542, 18
- (57)
- (58) Teplitz, H.I. et al. 2000b, ApJLetters, 533, 65 (T00)
- (59)
- (60) Trager, S.C., Faber, S.M.,Dressler, A., & Oemler, A. 1997, ApJ, 485, 92
- (61)
- (62) Yee, H.K.C., Ellingson, E., Bechtold, R.G., Carlberg,R.G., Cuillandre, J.-C. 1996, AJ, 111, 1783
- (63)
- (64)
| Object | F555WAB | F675WAB | F814WAB | KAB
|
|---|---|---|---|---|
|
|
||||
| A2 | ||||
| W5 |
|
| Object | [OIII] 5007 | H | ||||
|---|---|---|---|---|---|---|
|
|
||||||
|
|
1.86678 | 2.4475 | ||||
| A2 | 1.86731 | 2.4468 | ||||
| W5 | 1.86338 | 2.4453 | ||||
|
|
||||||