X-Ray Emission from the Double Pulsar System J0737–3039
Abstract
We report on a 10 ksec observation of the double pulsar system J0737–3039 obtained with the Chandra X-ray Observatory’s Advanced CCD Imaging Spectrometer. We detect the system as a point source with coordinates (J2000) , , making this the first double neutron star system to be detected at X-ray energies. Only 77 source counts are detected. The data are represented satisfactorily by a power-law spectrum with photon index . The inferred 0.2–10 keV luminosity is erg s-1 for a distance of 0.5 kpc. We do not detect any significant variability with orbital phase in these data, which span one full orbit. These results are consistent with the X-ray emission originating solely from the magnetosphere of the energetic A pulsar, with an efficiency for conversion of rotational energy to X-rays in this band of 0.04%, although we cannot exclude other possibilities.
1 Introduction
Thirty years following the discovery of the first double neutron star Hulse & Taylor (1975), only eight such systems are known. A few of these rare binaries are wonderful laboratories for the study of relativistic gravity and gravitational radiation. One of the more recently discovered of these systems, J0737–3039 Burgay et al. (2003), is fundamentally different from all of the others observationally in that it contains two detected pulsars Lyne et al. (2004). The first pulsar discovered in the system (A) spins every 22 ms, has a low inferred surface magnetic field strength, a characteristic age of 210 Myr, and a relatively high rate of rotational energy loss, erg s-1. Pulsar B has a period of 2.7 s, a characteristic age of 50 Myr, and an that is 3600 times smaller than that of A. Its mass, 1.25 M⊙, is the lowest known for any neutron star and is 0.09 M⊙ less than that of A. Both pulsars orbit their common center of mass every 2.4 hr with eccentricity of 0.09. We observe the system nearly edge-on, with an orbital inclination of .
A unique aspect of the system is that radio emission from pulsar B is only detected strongly in two repeatable orbital phase ranges, each of duration min. A s-long eclipse of pulsar A is also observed at its superior conjunction. Both of these effects most likely result from the interaction of the fast-spinning pulsar’s relativistic wind with the magnetosphere of its much less energetic companion Lyne et al. (2004).
This system will be an exceptional laboratory for relativistic astrophysics and should provide unique insights into the magnetospheres and the local environment of both neutron stars. High-energy observations, particularly at X-ray energies, could be especially valuable for understanding the energetics of the system. Whether resulting from magnetospheric or thermal processes, most pulsars emit of order in soft X-rays Becker & Trümper (1999). This translates to an expected luminosity of order erg s-1 for pulsar A, and means that B should be undetectable due to its very low and relatively large age. But in this particular system, while still unlikely, it is conceivable that a portion of A’s relativistic Poynting/particle flux might heat the surface of B, perhaps causing it to emit detectable radiation. Such emission could prove invaluable for probing the atmosphere of B, which is likely to deviate significantly from standard models. A more likely source of “unusual” X-ray emission might be the shock that undoubtedly forms near pulsar B owing to the collision between A’s relativistic wind and B’s magnetosphere. Some of this emission could be time variable, for instance due to Doppler boosting.
Many of these emission modes are clearly speculative and hard to quantify with the present understanding of the system. Nevertheless, given the potential for unusual insights into the physics of this unique interacting binary, we have obtained a short X-ray observation of this system, awarded through the Chandra Director’s Discretionary Time program, in order to better plan future multi-wavelength studies. In this Letter we report the detection of a point source at the position of the J0737–3039 system and describe its properties.
2 X-Ray Observations and Analysis
The double pulsar system J0737–3039 was observed with the Advanced
CCD Imaging Spectrometer S-array (ACIS-S) instrument aboard Chandra on 2004 January 18 for 10 ksec (corrected exposure time
was 10,009 s). The system’s position was located on the aim point of
the ACIS S3 chip. We used the CIAO package111Available
at http://asc.harvard.edu/ciao., version 3.0.2, to perform much of the
analysis of these data, using the most recent release of the calibration software,
CALDB 2.26, which corrects for the loss of quantum efficiency at low energies
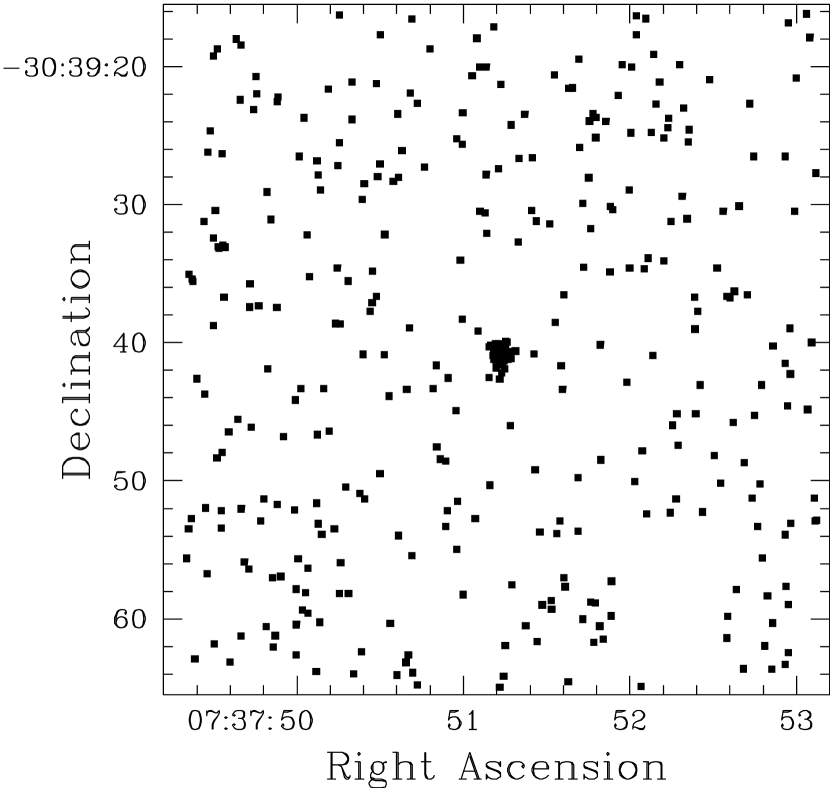
due to molecular contamination. As shown in Figure 1, we detect a
source at (J2000) , . No other sources are detected in the entire
S3 chip. This position is away from that derived from radio
timing of the pulsars Lyne et al. (2004), well within the X-ray
position uncertainty of , dominated by the satellite pointing
error of approximately . We have therefore detected the
J0737–3039 system in X-rays. Using a circular aperture of radius
centered on the position of the system, and four background regions, we
determine that counts originate from the pulsar, corresponding
to a rate of counts/s. The system
is detected as a point source, with the spatial spread consistent with
the point spread function of the instrument.
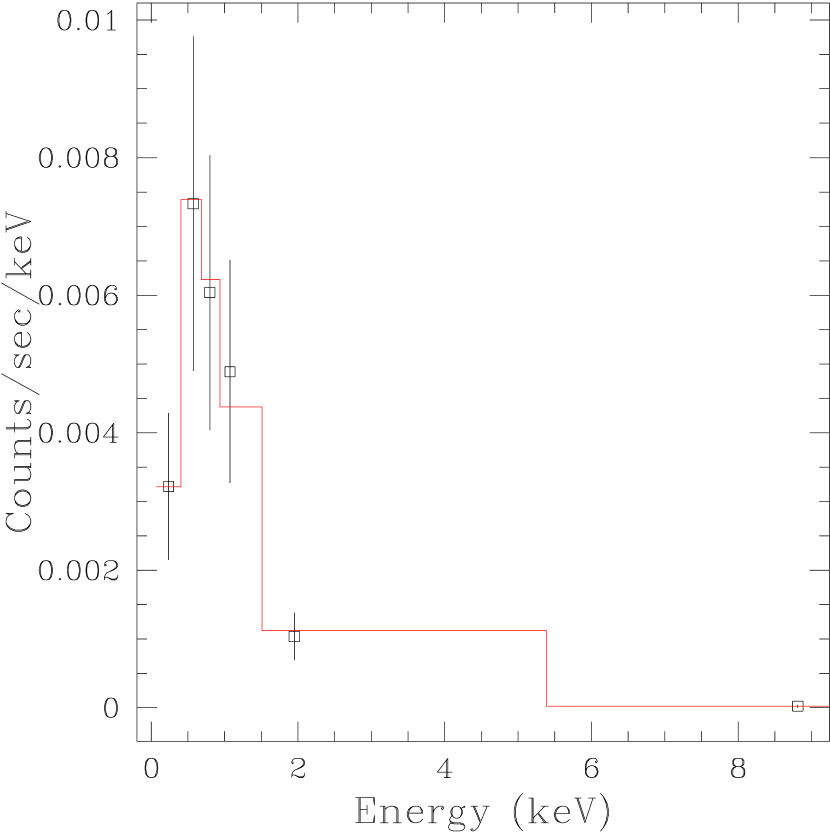
We used psextract to obtain a spectrum for this source
and fit it using Sherpa, the CIAO modeling
and fitting package. As shown in Figure 2, a steep
power-law spectrum fits the data satisfactorily, with photon index
and neutral hydrogen column density cm-2. Because
of the small number of counts we use the maxium likelihood method to fit
these data, implemented in Sherpa with the CSTAT statistic Cash (1979).
This fit returns a Q-value (i.e., the probability that we would
observe the measured CSTAT statistic or higher if the best-fit model is true)
of 0.96. The best-fit blackbody and Raymond-Smith
models return Q-values of and .
A thermal bremsstrahlung model returns a Q-value of 0.55, but the best-fit value of cm-2 is unreasonably low. Fitting for multi-component
models or models with more free parameters is unreasonable due to the
small number of counts available. While
there are only two counts
with energies greater than 3 keV, the fitted parameters do not change substantially if these counts are removed.
Similarly, the fit does not change
substantially if we exclude photons with energies less than 0.5 keV, where ACIS-S calibration is somewhat uncertain.
Figure 3 shows the a contour plot of the CSTAT statistic for the best-fit model in the plane. From the derived count rate and spectral fit, we calculate a 0.2–10 keV unabsorbed flux of erg cm-2 s-1. Assuming isotropic emission, and for a distance kpc, inferred from its dispersion measure (i.e. free electron column density) and a model for the Galactic electron density Cordes & Lazio 2002 , we obtain a 0.2–10 keV luminosity of erg s-1. In Table 1 we list all relevant spectral quantities and their uncertainties. We stress that , and hence the derived luminosity, may be uncertain by a factor of two or more due to unmodeled electron density features associated with its position near the Gum Nebula Mitra & Ramachandran (2001). VLBI observations will be important for determining the actual distance.
The value of derived for the system, while rather uncertain, is much smaller than the total Galactic value of cm-2 derived by Dickey & Lockman (1990) from neutral hydrogen measurements. It is also smaller (at ) than the value of cm-2 derived from its dispersion measure, assuming 10 H atoms for each . Our derived , however, is marginally greater than expected given the measured neutral hydrogen absorption to other sources with similar longitude, latitude and kpc distance222See the ISM Column Density Search Tool at http://archive.stsci.edu/euve/ism/ismform.html., and is more consistent with the measurements if a distance of at least kpc is assumed. Such discrepancies between measurements and dispersion-measure derived distances for pulsars are not unusual (e.g. Nicastro et al. 2004). Also, since the source closest to J0737–3039 with a neutral hydrogen absorption measurement is a radial distance of kpc away, and because the errors on our and distance measurements are large, further observations are necessary to determine if such a discrepancy exists.
In Figure 4 we plot the number of photons detected in each of 10 time bins over the 10 ksec observation (i.e. 1.13 orbital periods). There is no significant evidence for variability, with a test revealing only a 51% probability that the data were drawn from a non-uniform distribution. We also do not see any correlation between time and the energy of the photons. The small number of detected photons makes searching for variability on shorter time scales impossible.
3 Discussion
We have detected the J0737–3039 system as a faint X-ray source that is best described by a steep power-law spectrum with and erg s-1 (see Table 1). This result is compatible with the emission originating solely from the magnetosphere of pulsar A: Becker & Trümper (1999) find that for recycled radio pulsars that are detected at X-ray energies, , and that when their spectra can be fit by a power law, . While by comparison our spectral index is a bit steep and our efficiency for conversion of rotational to X-ray energies is a little small (), uncertainties in spectral parameters and distance make this interpretation perfectly plausible. We note in passing that the X-ray luminosity detected from the system is roughly equal to the entire spin-down luminosity of pulsar B.
Another intriguing possibility is that these X-rays are produced when the relativistic winds of A and B collide. As shown by Arons & Tavani (1993), the synchrotron emission produced in such interactions would also be expected to have a power law X-ray spectrum with . Unfortunately, the data from this short observation are not sufficient to discriminate between these two possibilities. More sensitive observations with better time resolution are necessary in order to: obtain a better spectral fit; determine what portion of the detected X-ray flux is pulsed at the rotation period of pulsar A; quantify better any possible time variability (the observed radio flux density of B varies dramatically on –10 min timescales that are impossible to investigate with the present data); measure any thermal component that may be contributing to the total X-ray flux of this system.
References
- Arons & Tavani (1993) Arons, J. & Tavani, M. 1993, ApJ, 403, 249
- Becker & Trümper (1999) Becker, W. & Trümper, J. 1999, A&A, 341, 803
- Burgay et al. (2003) Burgay, M. et al. 2003, Nature, 426, 531
- Cash (1979) Cash, W. 1979, ApJ, 228, 939
- (5) Cordes J. M., & Lazio T. J. W., 2002, preprint (astro-ph/0207156)
- Dickey & Lockman (1990) Dickey, J. M. & Lockman, F. J. 1990, ARA&A, 28, 215
- Hulse & Taylor (1975) Hulse, R. A. & Taylor, J. H. 1975, ApJ, 195, L51
- Lyne et al. (2004) Lyne, A. G. et al. 2004, Science, 303, 1153
- Mitra & Ramachandran (2001) Mitra, D. & Ramachandran, R. 2001, A&A, 370, 586
- Nicastro et al. (2004) Nicastro, L. et al. 2004, A&A, 413, 1065
| Parameter | Value |
|---|---|
| , photon index | |
| , neutral hydrogen column density ( cm-2) | |
| , flux (0.2–10 keV) ( erg cm-2 s-1) | |
| , luminosity (0.2–10 keV) ( erg s-1) | |
| (0.2–10 keV) () |
Note. — Results from a fit to ACIS-S3 data of the form . Flux has been corrected for interstellar absorption. Luminosity assumes a distance of 0.5 kpc (see § 2) and is the same, within the errors, for the 0.2 – 3 keV energy range. Uncertainties correspond to confidence levels.