Low-Mass Pre-Main Sequence Stars in the Large Magellanic Cloud - III: Accretion Rates from HST-WFPC2 Observations†
Abstract
We have measured the present accretion rate of roughly 800 low-mass () pre-Main Sequence stars in the field of Supernova 1987A in the Large Magellanic Cloud (LMC, ). It is the first time that this fundamental parameter for star formation is determined for low-mass stars outside our Galaxy. The Balmer continuum emission used to derive the accretion rate positively correlates with the excess. Both these phenomena are believed to originate from accretion from a circumstellar disk so that their simultaneous detection provides an important confirmation of the pre-Main Sequence nature of the and UV excess objects, which are likely to be the LMC equivalent of Galactic Classical T Tauri stars. The stars with statistically significant excesses are measured to have accretion rates larger than at an age of 12-16 Myrs. For comparison, the time scale for disk dissipation observed in the Galaxy is of the order of 6 Myrs. Moreover, the oldest Classical T Tauri star known in the Milky Way (TW Hydræ, with 10 Myrs of age) has a measured accretion rate of only , i.e. 30 times less than what we measure for stars at a comparable age in the LMC. Our findings indicate that metallicity plays a major role in regulating the formation of low-mass stars.
1 Introduction
The processes at play during star formation determine much of the appearance of the visible Universe. The shape of the stellar Initial Mass Function (IMF) and its normalization (the star-formation rate) are, together with stellar evolution theory, key ingredients in determining the chemical evolution of a galaxy and its stellar content. Yet, our theoretical understanding of the processes that lead from diffuse molecular clouds to stars is still very tentative, as many complex physical phenomena concur in producing the final results. While clear variations in the star-formation rate are observed in different regions of the Milky Way and in external galaxies, with their histories showing bursts and lulls (e.g., Tolstoy, 2000), the observational evidence for (or against) variations in the IMF is often contradictory (see the review of Scalo, 1998, or the Gilmore vs Eisenhauer debate in “Starbursts: Near and Far’, 2001). Yet, variations in the IMF can dramatically alter the chemical evolution of a galaxy (e.g., Wyse, 1998).
From an observational standpoint, most of the effort has traditionally been devoted to nearby Galactic star-forming regions, such as the Taurus-Auriga (catalog ) complex, Orion (catalog ), etc. If this, on the one hand, permits one to observe very faint stars at the best possible angular resolution, on the other it is achieved at the expense of probing only a very limited set of initial conditions for star formation (all these clouds have essentially solar metallicity, e.g., Padget, 1996).
Studying the effects of a lower metallicity on star formation is also essential to understand the evolution of both our own Galaxy, in which a large fraction of stars were formed at metallicities below solar, and what is observed at high redshifts. As a matter of fact, the global star formation rate appears to have been much more vigorous (a factor of 10 or so) at than it is today (Madau et al, 1996, and subsequent incarnations of the so-called “Madau plot”). At that epoch the mean metallicity of the interstellar gas was similar to that of the Large Magellanic Cloud (catalog ) at present (LMC, e.g. Pei et al, 1999). This fact makes the study of star forming regions in the LMC especially important for the understanding of galaxy evolution.
With a distance modulus of (see the discussion in Romaniello at al, 2000), the LMC is our closest galactic companion after the Sagittarius (catalog ) dwarf galaxy. At this distance one arcminute corresponds to about 15 pc and, thus, one pointing with a typical imaging instrument comfortably covers almost any star forming region in the LMC (10 pc see, e.g., Hodge, 1988). In particular, the field of view of about of the WFPC2 on board the HST corresponds to , and leads to the detection of several thousands of stars per pointing (e.g., Romaniello et al, 2002). The LMC is especially suited for stellar populations studies for two additional reasons. First, the depth of the LMC along the line of sight is negligible, at least in the central parts we consider (van der Marel and Cioni, 2001). All of the stars can, then, effectively be considered at the same distance, thus eliminating a possible spurious scatter in the Color-Magnitude Diagrams. Second, the extinction in its direction due to dust in our Galaxy is low, about (Bessell, 1991; Schwering, 1991) and, hence, our view is not severely obstructed.
There is currently a widespread agreement that low mass stars form by accretion of material until their final masses are reached (e.g. Bonnell et al, 2001, and references therein). As a consequence, the accretion rate is arguably the single most important parameter governing the process of low-mass star formation and its final results, including the stellar Initial Mass Function. Ground and HST-based studies show that there may be significant differences between star formation processes in the LMC and in the Galaxy. For example, Lamers et al (1999) and de Wit et al (2002) have identified by means of ground-based observations high-mass pre-Main Sequence stars (Herbig AeBe stars) with luminosities systematically higher than observed in our Galaxy, and located well above the “birthline” of Palla and Stahler (1991). They attribute this finding either to a shorter accretion timescale in the LMC or to its smaller dust-to-gas ratio. Whether such differences in the physical conditions under which stars form will generally lead to differences at the low mass end is an open question, but Panagia et al (2000) offer tantalizing evidence of a higher accretion also for LMC low mass stars.
In this paper we present the first measurement of the accretion rate onto low-mass pre-Main Sequence stars outside of our Galaxy. The data and the reduction process are presented in the next section, while the detection of Balmer continuum excess and its conversion into an accretion rate are described in section 3. Section 4 is devoted to deriving the stellar parameters of our sample, i.e. the stars’ masses and ages. Finally, the conclusions are drawn in section 5.
2 Observation and data reduction
The field of SN 1987A (catalog ) in the LMC was repeatedly imaged over the years with the WFPC2 on-board the HST to monitor the evolution of its Supernova remnant. We have taken advantage of this wealth of data and selected from the HST archive a uniform dataset providing broad-band coverage from the ultraviolet to the near infrared, as well as imaging in the line. The log of the observations we have used is reported in Table 1. A description of the camera and its filter set can be found in Biretta et al (2001). All images are centered with the Planetary Camera chip on SN 1987A (), but have different position angles on the sky, resulting in complete coverage of an almost circular region of (about 30 pc) in radius.
The data were processed through the standard Post Observation Data Processing System pipeline for bias removal and flat fielding. In all cases cosmic ray events were removed combining the available images after accurate registration and alignment.
The plate scale is 0.045 and 0.099 arcsec/pixel in the Planetary Camera and in the three Wide Field chips, respectively. We performed aperture photometry following the prescriptions by Gilmozzi (1990) as refined by Romaniello (1998), i.e. measuring the flux in a circular aperture of 2 pixels radius and the sky background value in an annulus of internal radius 3 pixels and width 2 pixels. Due to the undersampling of the WFPC2 Point Spread Function, this prescription leads to a smaller dispersion in the Color-Magnitude Diagrams, i.e. better photometry, than PSF fitting for non-jittered observations of marginally crowded fields (Cool and King, 1995; Romaniello, 1998). Photometry for the saturated stars was recovered by either fitting the unsaturated wings of the PSF for stars with no saturation outside the central 2 pixel radius, or by following the method developed by Gilliland (1994) for the heavily saturated ones. The flux calibration was done using the internal calibration of the WFPC2 (Whitmore, 1995), which is typically accurate to within 5% at optical wavelengths. The spectrum of Vega is used to set the photometric zeropoints (VEGAMAG system).
In the following, as a measure of the overall photometric accuracy, we will use the mean error in five broad bands defined as:
| (1) |
2.1 From colors to luminosity and temperature
Once the observed fluxes of the stars are carefully measured, we derive their intrinsic properties, i.e. luminosity and temperature, as well as the extinction caused by the intervening interstellar dust along the line of sight, using the prescriptions developed by Romaniello et al (2002). The intrinsic stellar parameters and their associated errors are derived with a minimum technique by comparing the observed magnitudes to the ones expected based on the theoretical stellar atmosphere models of Bessell et al (1998) computed in the HST-WFPC2 bands using the IRAF synphot task. In order to cope with the effects of interstellar dust we have used the the extinction law appropriate for this region of the LMC (Scuderi et al, 1996). Let us stress here that, by convolving the theoretical spectra with the filter sensitivity curves provided in IRAF, we ensure that the observations are faithfully modeled. In particular, the red leak that affects the WFPC2 F336W (U-band-like) filter is properly taken into account.
The dereddening method is extensively described in Romaniello et al (2002), but let us briefly summarize it here:
-
1.
stars for which both and can be simultaneously derived are selected according to their photometric error () and their location in the vs plane, where is a reddening-free color defined as:
This color-based selection is aimed at solving the possible non-monotonicity of broad-band colors with temperature (see, for example, Allen, 1973, p207). The stars for which and can be derived simultaneously turn out to be hotter than 10,000 K or between 6,750 and 8,500 K.
Also, a star’s location in the vs plane provides a first guess of its temperature and reddening;
-
2.
for the stars selected in step 1, , , and their associated uncertainties are derived starting from the first guesses by performing a minimum multi-band fit of synthetic colors from Bessell et al (1998) to the observed magnitudes;
-
3.
for each star for which and cannot be derived simultaneously because of its intrinsic temperature and/or too large errors, the reddening is set as the mean of the ones of its 4 closest neighbors with direct reddening determination. The corresponding rms is used as an estimate of the uncertainty on the adopted value of . The effective temperature, luminosity and associated errors are, then, derived from a minimum multi-band fit.
In the case of the field discussed here, there is, on average, one star with direct determination every 13 arcsec2. Of course, it is possible that a few stars have, in reality, extinction values significantly different from the local mean, but the global effect is negligible.
The errors on and are computed from the maps and propagated to the luminosity. A full discussion on the errors is reported in Romaniello et al (2002), but it is important to keep in mind here that the procedure outlined above does not introduce any systematic errors on the derived stellar parameters.
Panagia et al (2000), using this same dataset, have measured the age of the massive stars in the field to be Myrs. Also, they have identified several hundreds pre-Main Sequence stars through their emission. We will now measure, for the first time outside our Galaxy, the accretion rate on these low mass pre-Main Sequence stars.
3 Measuring the accretion rate
The idea that the strong excess emission observed in some Galactic low-mass, pre-Main Sequence stars (T Tauri stars) is produced by accretion of material from a circumstellar disk dates back to the pioneering work of Lynden-Bell and Pringle (1974). The excess luminosity is, then, related to the mass accretion rate. In particular, the Balmer continuum radiation produced by the material from the disk as it hits the stellar surface has been used as an estimator of the mass infall activity (see, for example, Gullbring et al, 1998, and references therein).
3.1 The U-band excess
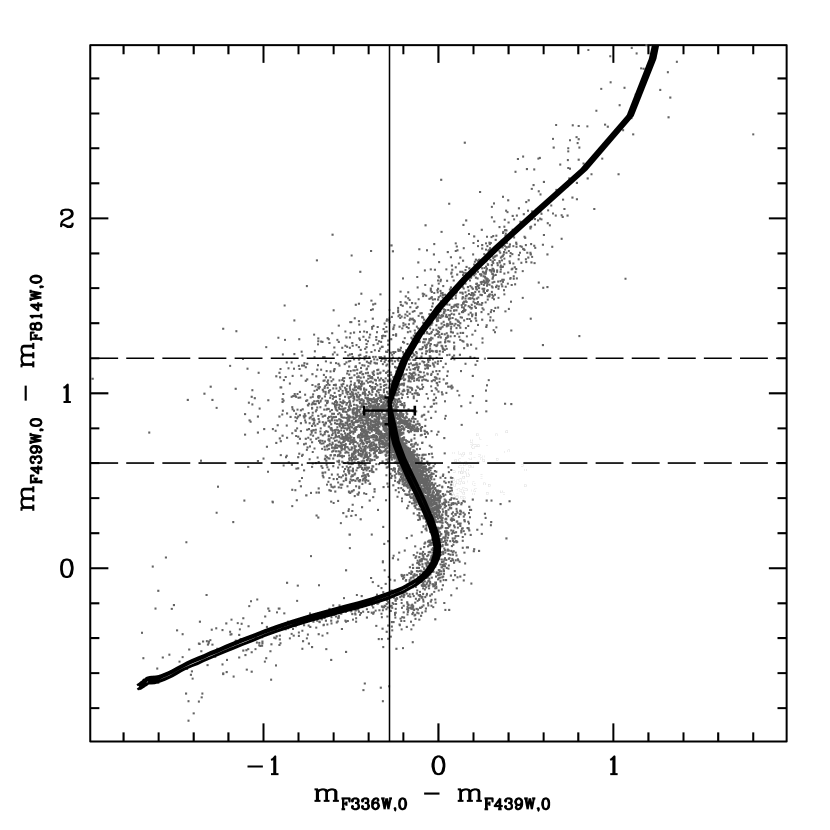
The presence of a rich population of stars with U-band excess in the field of SN 1987A is clearly detected in Figure 1, where we plot as gray dots the dereddened vs , i.e. vs , colors for stars with good overall photometry (). The F336W and F439W filters bracket the Balmer jump and an excess in the color translates in an excess emission in the Balmer continuum. The typical errorbar, computed as the mean of the photometric errors of the stars with , is shown as a cross. For reference, the expected locus from the stellar atmosphere models of Bessell et al (1998) for and is shown as a solid line. At the end of this section we will discuss the influence of chemical composition and surface gravity on our results.
The reddening and intrinsic stellar parameters for the stars with possible U band excess were computed excluding the F336W magnitudes from the multi-band minimum fit described in section 2.1. This is because the excess itself can make the observed F336W flux significantly different from that of a photosphere, hence yielding incorrect results for the stellar parameters. For example, the roughly 600 stars under the Main Sequence noted by Panagia et al (2000) in this same field have too high a temperature precisely because the U band was not excluded from the fit. As detailed in Romaniello et al (2002), however, it is not possible to reliably derive both and without the U band. For the stars with possible U band excess, then, we have used the reddening value from their 4 nearest neighbors with a direct determination of and derived the stellar parameters accordingly.
The presence in Figure 1 of stars with too blue a color given the observed color is apparent at . To quantify the U-band excess we consider the distribution of the color as shown in Figure 2. There, the solid line shows the color distribution of the stars within the color interval . The FWHM expected from the measured photometric and dereddening errors is shown by the horizontal errorbar. It nicely reproduces the width of the right-hand side of the observed histogram, while it severely underestimates the one on the left (the dashed line is the histogram produced by the reflection of the red part of the distribution relative to its peak value). Hence, we take the resulting symmetric distribution, which has a half-power width of about 0.25 magnitudes, as an indication of the broadening caused by photometric and dereddening errors. This is justified by noticing that the peak of the observed distribution occurs where the models atmospheres predict it to occur (, thin vertical line in Figure 1), which provides an independent check on the dereddening procedure we have used, ruling out any significant systematic errors on the inferred dereddened colors. An excess of stars with F336W emission as compared to a normal photosphere, i.e. blue colors, is evident (hatched area).
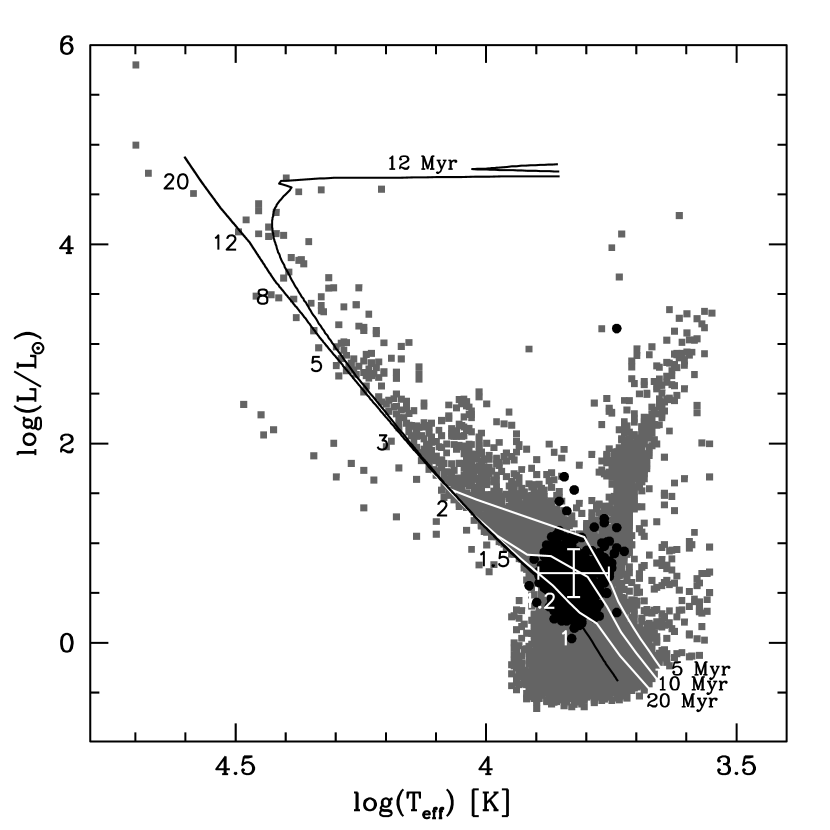
The location in the HR diagram of the stars with and without U excess is shown in Figure 3. Also indicated are the theoretical Zero Age Main Sequence and 12 Myr post-Main Sequence isochrone from Brocato and Castellani (1993) and the pre-Main Sequence isochrones by Siess et al (1997) for , the metallicity appropriate for the young population of the Large Magellanic Cloud (Hill et al, 1995; Geha et al, 1998). The typical uncertainties on the luminosity and temperature for the stars with U excess, computed as the mean of the uncertainties on the individual stars, is shown as a cross. If interpreted as pre-Main Sequence stars, then, the position of the stars with U excess in the HR diagram of Figure 3 is consistent at a with an single age of 12 Myr, the age inferred from the upper Main Sequence (see also Panagia et al, 2000). We will return on the age dating of these stars in section 4.
We can now take a step forward and compute the excess luminosity in the F336W filter, which, as we will see in section 3.3, is directly related to the mass accretion rate onto the pre-Main Sequence star. This is accomplished by computing the difference between the measured dereddened flux in the band and the one predicted by the stellar atmosphere models (Bessell et al, 1998) for a photosphere with the effective temperature of the star. We have derived this latter quantity by fitting the observed BVRI magnitudes to the same model atmospheres of Bessell et al (1998):
| (2) |
where Å is the width of the F336W filter (Biretta et al, 2001), kpc is the distance to this LMC field (Romaniello at al, 2000), the stellar radius and and are the observed and model flux densities, respectively. The stellar radius, like the effective temperature, is obtained by fitting the observed BVRI magnitudes to the same model atmospheres of Bessell et al (1998). The U magnitude was excluded from the fit because it can be significantly contaminated by the excess, hence yielding incorrect results for the stellar parameters.
The distribution of the resulting excesses in solar units is shown in Figure 4. The solid line represents the observed distribution, which is clearly skewed toward positive values. If neither excess emission nor observational errors were present, the distribution would be a function centered on 0. Therefore, we consider the broadening toward negative values as a measure of the combined photometric plus dereddening errors. By mirroring the histogram for about 0 (dashed histogram in Figure 4) one can identify the stars with excess emission as those populating the bins where the observed distribution exceeds the mirrored one (hatched region). An inspection to Figure 4 shows that for the contamination due to excesses induced by random errors becomes negligible.
These are, of course, the same stars with too blue a color for the one highlighted in Figure 1. As shown in Figure 5, the Balmer continuum excess displays a well defined correlation with the color, albeit with a quite large scatter . As expected, the correlation is in the sense that the more negative the color, the higher the inferred F336W excess.
The excess emission was computed assuming for all of the stars a metallicity appropriate for the young LMC population (, e.g. Hill et al, 1995; Geha et al, 1998), in the sense that the observed F336W fluxes were compared to models of that metallicity. This simplification does not have any impact on our results, as we expect the contamination from metal-poor (, i.e. intrinsically brighter in the F336W), field subgiants to be of the order of only a few percent (Cole et al, 2000). In addition, the stellar atmosphere models of Bessell et al (1998) indicate that the difference in the F336W luminosity between and is of the order of in the relevant range of effective temperature (, see Figure 3) and for , the typical radius of these stars. This value is much smaller than the detection threshold we have set at . The models of Bessell et al (1998) also indicate that the effect of surface gravity on photospheric emission in the F336W band is even smaller than the one due to metallicity.
In conclusion, the 765 stars with an excess lager than about are bona fide objects with F336W excess when compared to a stellar photosphere.
3.2 A sanity check: the correlation between U and emission
In addition to the U-band excess, Galactic Classical T Tauri stars are also observed to have emission, which is also thought to be linked to the accretion process from the circumstellar disk (e.g. Calvet et al, 2002). As such, a correlation is to be expected between these two quantities.
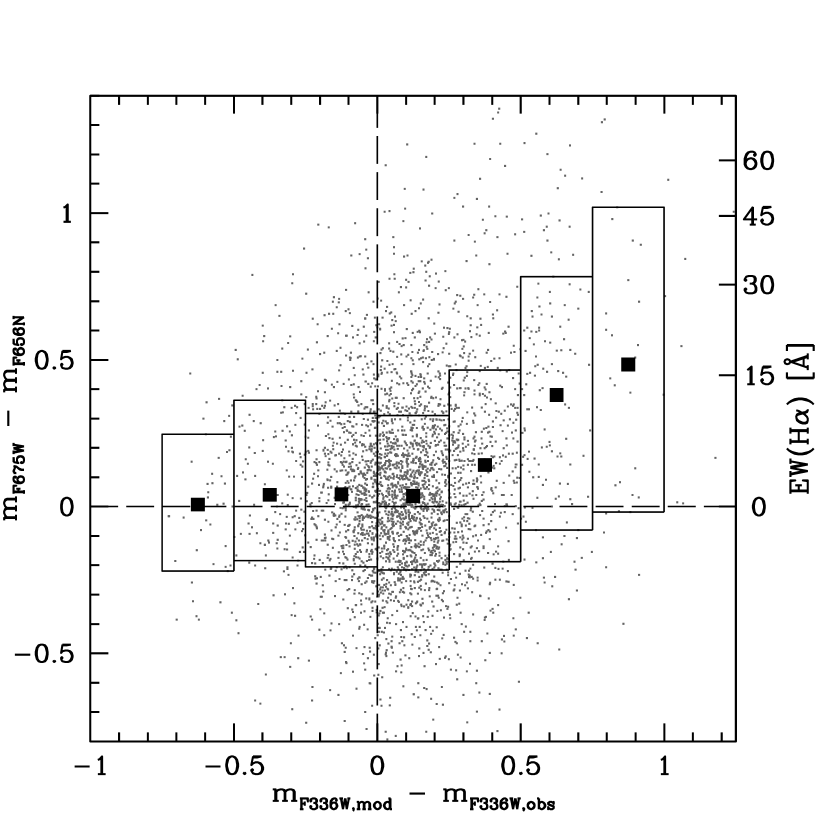
In Figure 6 we plot the excess emission in the F336W filter versus the one in : is the observed magnitude, is the photospheric one from the models of Bessell et al (1998) and the color measures the equivalent width (e.g. Romaniello et al, 2003). The correlation between U and activity is apparent.
A high statistical correlation between the two quantities is confirmed by Spearman’s coefficient (see, e.g., Conover, 1980). This is a non-parametric test sensitive to correlations between two random variables. The correlation coefficient is 7.9, which implies a probability of less than that the two variables are uncorrelated. Whereas the quality of the data does not allow to derive the detailed shape of the correlation, the existence of the correlation itself is proven with a very high statistical significance. This provides a very important sanity check as to the pre-Main Sequence nature of these stars.
A potential source of concern here is chromospheric activity that would produce excess emission both in the Balmer continuum and in , without being linked to the presence of a circumstellar accretion disk. As we will show in section 4, the stars we deal with in this paper have about (see Figure 8). The total chromospheric emission of a solar-type star on the Subgiant Branch corresponds to a luminosity of the order of (Ulmschneider, 1979; Pasquini et al, 2000). Even if the flux were all concentrated in the spectral region covered by the F336W filter, its contribution would still be negligible compared to the threshold we have set of . Moreover, it is clear from Figure 6 that all the objects with significant F336W excess also have , i.e. , which is an upper limit to what can be expected due to chromospheric activity (Frasca and Catalano, 1994).
In conclusion, then, the case under study the chromospheric emission does not contribute in any significant way to the observed Balmer continuum excess.
3.3 From U-band excess to mass accretion
Now that we have detected and characterized the stars with a statistically significant excess in the U band we can compute the corresponding accretion rate. The following equation:
| (3) |
relates the bolometric accretion luminosity to the stellar and disk parameters. is the inner radius of the accretion disk. Its value is rather uncertain and depends upon the details of the coupling of the accretion flow to the magnetic field. Following Gullbring et al (1998) we adopt for all of the stars.
Gullbring et al (1998) also provide an empirical relation between the accretion luminosity and the excess luminosity in the Johnson U passband compared to a stellar photosphere:
| (4) |
This, in turn, has been transformed to the WFPC2 F336W filter by Robberto et al (2004) using theoretical models for the disk emission that reproduce Gullbring et al (1998)’s relation:
| (5) |
Combining equations (3) and (5) leads to a relation that links , the accretion rate in , to the excess luminosity in the F336W filter :
| (6) |
3.4 The mass accretion rate
According to equation (6) in order to derive the accretion rate we need the following three quantities:
- •
-
•
the stellar radius , which is calculated from the luminosity and temperature determined for every star using the method developed by Romaniello et al (2002), i.e. by fitting the observed colors to the ones predicted by stellar model atmospheres, and adopting a distance modulus to the LMC of 18.57 (Romaniello at al, 2000);
-
•
the stellar mass that we estimate by comparing a star’s location in the HR diagram with evolutionary tracks computed for (Siess et al, 1997).
The distribution of the derived accretion rates is shown in Figure 7 for the stars with , i.e. those for which the excess can be measured with high reliability. As it can be seen, the pre-Main Sequence stars detected in the field of SN 1987A through their U-band excess have accretion rates larger than .
The apparent low cutoff at low values of is not real, but, rather, is a consequence of the threshold we have used to identify stars with a significant Balmer continuum excess. In other words, there might be stars in the field with smaller accretion rates, but they would be lost in the measurement errors. Moreover, Galactic T Tauri stars are known to show variability at many wavelengths with timescales as short as a few days (see, for example, the review by Bertout, 1989). It is clear, then, that, since we only detect those stars with the strongest excesses, our method tends to pick up stars when they are the most active.
4 Ages and masses of the pre-Main Sequence stars
In section 3.1 we noticed that a visual inspection to the HR diagram indicates that, if interpreted as pre-Main Sequence objects, the stars with U excess are consistent with an age of roughly 12 Myrs. We can now refine that estimate by comparing each star’s luminosity and temperature to those predicted as a function of mass and age by the pre-Main Sequence evolutionary models of Siess et al (1997) for .
The resulting age distribution of the stars with is shown in the left panel of Figure 8. The peak of the distribution ( Myr) is in very good agreement with the age of the massive stars () in this same field ( Myrs, Panagia et al, 2000). The spread in the histogram is consistent with being produced by photometric and dereddening errors only, which, for these stars, are of the order of 20% in the effective temperature (see also Figure 3). At this stage, then, we cannot assess if the stars with significant U band excess show an intrinsic spread in age or not. It is worth noticing that, if we take the comparison with the Siess et al (1997) isochrones at face value, almost no stars have ages lower that about 5 Myrs.
The mass distribution of the same stars with significant Balmer continuum excess is shown in the right panel of Figure 8. The mean mass of the accreting stars is , with an rms dispersion of .
The mean value of the accretion rate for the stars with significant Balmer continuum excess is (see Figure 7). If we assume that this is a steady-state mean value, then these stars still have to accrete a significant fraction of their mass (10-20%) before settling to their final Main Sequence value. Of course, this is surely an overestimate for two main reasons. As we have already noticed, we tend to pick up the stars when their activity is maximum. In addition, accretion activity is observed to slow down with time in Galactic pre-Main Sequence stars (e.g. Calvet et al, 2002), breaking the simplistic steady-state hypothesis.
5 Summary and conclusions
We have identified about 800 stars with statistically significant Balmer continuum excess in the field of SN 1987A in the Large Magellanic Cloud. This excess positively correlates with emission, as derived from the comparison of broad and narrow-band photometry. Whereas the quality of the data does not allow to derive the detailed shape of the correlation, the existence of the correlation itself is proven with a very high statistical significance (Spearman’s test returns a probability of less than that the two variables are uncorrelated). Both the Balmer continuum and the excesses are well above the levels expected from chromospheric activity. These facts lead us to interpret these objects as pre-Main Sequence stars.
In this framework, given their location in the HR diagram and the emission in the Balmer continuum and line, the objects in our sample are the equivalent of Galactic Classical T Tauri stars. This is the first time that such a fundamental parameter as the accretion rate is measured for this class of objects in a galaxy other than our own Milky Way. Doing so in the Large Magellanic Cloud provides a unique opportunity to sample astrophysical conditions not represented in local star-forming regions, but that were common in the early Universe.
When interpreted as pre-Main Sequence stars, the comparison of the objects’ location in the HR diagram with theoretical evolutionary tracks allows one to derive their masses () and ages ( Myrs). At such an age and with an accretion rate in excess of , these candidate pre-Main Sequence stars in the field of SN 1987A are both older and more active than their Galactic counterparts known to date. In fact, the overwhelming majority of T Tauri stars in Galactic associations seem to dissipate their accretion disks before reaching an age of about 6 Myrs (Haisch et al, 2001; Armitage et al, 2003). Moreover, the oldest Classical T Tauri star know in the Galaxy, TW Hydræ (catalog ) at an age of 10 Myrs, i.e. comparable to that of our sample stars, has a measured accretion rate some 30 times lower than the stars in the neighborhood of SN 1987A (Muzerolle et al, 2000).
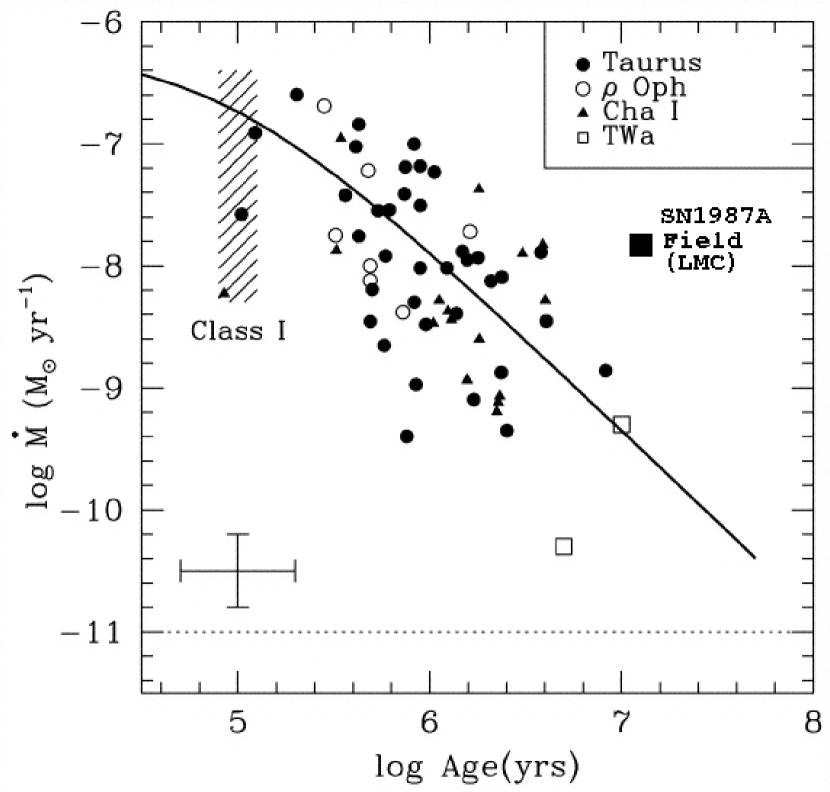
The situation is summarized in Figure 9, adapted from Muzerolle et al (2000), where we compare the position in the age- plane of the stars described in this paper with that of members of Galactic star-forming regions. An obvious selection bias that affects our census is that we only detect those stars with the largest Balmer continuum excesses, i.e. highest accretion rates. There might be stars in the field with smaller accretion rates, either intrinsically or because they were observed when the accretion activity was at a minimum, which fall below our detection threshold. This selection effect is rather hard to quantify, but it is clear that the locus of the accreting stars that we do detect in the neighborhood of SN 1987A is significantly displaced from the one defined by local pre-Main Sequence stars.
There are essentially two ways to reconcile the position of the LMC point in Figure 9 with the mean locus observed in the Galaxy: significantly reduce the age of the stars in the SN 1987A region and/or significantly decrease their inferred accretion rate. Neither option, however, seems viable. In fact, while the uncertainties on either quantity can be quite large for any given star, the LMC point reflects the mean values of several hundred stars, thus making the random errors, for all practical purpose, negligible. Let us now consider the systematic errors.
If we move the LMC point horizontally in Figure 9, in order to occupy the same area as Galactic stars, the LMC stars would have to be younger than about 4 Myrs or less, the age of the oldest Galactic star with a measured accretion rate of . This would require our estimate of the ages of the LMC stars to be systematically wrong by a factor of three or more. Such a large shift is rather implausible on accounts of two main considerations. First, Romaniello et al (2002) have shown that the dereddening technique we have adopted here does not introduce any significant systematic errors on the stellar parameter, hence, given a set of pre-Main Sequence evolutionary tracks, on the derived age. Second, the age of 14 Myrs inferred from the peak of the histogram in Figure 8 agrees very well both with that of the most massive stars in the field ( Myrs, Panagia et al, 2000) and that of the progenitor of SN 1987A (10-12 Myrs see, for example, Scuderi et al, 1996, and references therein). These age estimates are, of course, completely independent from that of the low-mass stars we are discussing here, lending support to it.
The other possibility is that, given the age of about 12-16 Myrs, we have overestimated the accretion rate onto the candidate pre-Main Sequence stars in the surroundings of SN 1987A. A factor of about 30 reduction is required in order to make our value for the LMC to agree with TW Hydræ, the oldest accreting T Tauri known in our Galaxy (see Figure 8). According to equation (6) this corresponds to reducing the Balmer continuum excess by a factor of almost 20 (for comparison, this would be so small as to be even smaller than the bin size of the histogram in Figure 4). Such a reduction, however, is clearly incompatible with the observed distribution of the excesses, in particular with its asymmetry, which marks the stars with a Balmer continuum excess beyond statistical errors (see also Figure 2).
A potential source of concern is the effect on the derived accretion rate of the presence of circumstellar dust in the immediate surroundings of the candidate pre-Main Sequence stars (flared disks, remnants of the cocoon they were formed out of, etc.). This extra source of reddening is not accounted for by our method and the candidate pre-Main Sequence stars could be affected by a higher value of than mean one from the 4 closest neighbors with a direct determination, i.e. have bluer intrinsic colors. According to the data in Figure 5, however, this would correspond to increasing the inferred Balmer continuum excess and, consequently, the accretion rate, further confirming the difference with what is observed in the Galaxy.
Finally, let us notice that the accretion rate for several of the Galactic stars in Figure 8 was derived with the same technique we have used in this paper, i.e. the relation between Balmer continuum excess and accretion rate by Gullbring et al (1998). As such, they are affected by the same issues on the calibration of this relation as the LMC stars presented here (if any). The discrepancy between Galactic stars and those in the neighborhood of SN 1987A in the LMC, then, appears to be real. Of course, spectroscopic data on these stars would be highly desirable to better characterize their properties.
A higher accretion rate in the LMC than in the Galaxy was also suggested for A and B spectral type pre-Main Sequence stars by Lamers et al (1999) and de Wit et al (2002). The combination of this result with ours points towards a significantly higher accretion activity over a factor of about 6 in mass for pre-Main Sequence stars at lower metallicity.
References
- Allen (1973) Allen, C.W., 1973, Astrophysical Quantities (3rd ed.: London: Athlone)
- Armitage et al (2003) Armitage, P.J., Clarke, C.J., and Palla, F. 2003, MNRAS, 342, 1139
- Bertout (1989) Bertout, C. 1989, ARA&A, 27, 351
- Bessell (1991) Bessell, M.S. 1991, A&A, 242, L17
- Bessell et al (1998) Bessell, M.S., Castelli, F., and Plez, B. 1998, A&A, 333, 231 (erratum 337, 321)
- Biretta et al (2001) Biretta, J., et al 2001, WFPC2 Instrument Handbook, Version 6.0 (Baltimore:STScI)
- Bonnell et al (2001) Bonnell, I.A., Clarke, C.J., Bate, M.R., and Pringle, J. E. 2001, MNRAS, 324, 573
- Brocato and Castellani (1993) Brocato, E., and Castellani, V. 1993, ApJ, 410, 99.
- Calvet et al (2002) Calvet, N., Hartmann, L., and Strom, S.E. 2002, in “Protostars and Planets IV”, eds. V. Mannings, A.P. Boss, and S.S. Russell (Tucson: University of Arizona Press), 377
- Cole et al (2000) Cole, A.A., Smecker-Hane, T., and Gallagher, J.S., III 2000,ApJ, 120, 1808
- Cool and King (1995) Cool, A.M, and King, I.R. 1995, in “Calibrating HST: Post Servicing Mission”, eds. A. Koratkar and C. Leitherer (Baltimore: STScI), 290
- Conover (1980) Conover, W.J. 1980, “Practical Nonparametric Statistics”, edition, (New York: Wiley)
- de Wit et al (2002) de Wit, W. J., Beaulieu, J. P., and Lamers, H.J.G.L.M. 2002, A&A, 395, 829
- Eisenhauer (2001) Eisenhauer, F. 2001, in “Starbursts: Near and Far”, eds. L.J. Tacconi and G. Lutz, Heidelberg: Springer-Verlag, p.24
- Frasca and Catalano (1994) Frasca, A., and Catalano, S. 1994, A&A, 284,883
- Geha et al (1998) Geha, M.C., Holtzman, J.A., Mould, J.R., et al 1998, AJ, 115, 1045
- Gilliland (1994) Gilliland, R.L. 1994, ApJ, 435, L63.
- Gilmore (2001) Gilmore, G. 2001, in “Starbursts: Near and Far”, eds. L.J. Tacconi and G. Lutz, Heidelberg: Springer-Verlag, p.34
- Gilmozzi (1990) Gilmozzi, R. 1990, Core Aperture Photometry with the WFPC, STScI Instrum. Rep. WFPC-90-96 (Baltimore: STScI)
- Gullbring et al (1998) Gullbring, E., Hartmann, L., Briceño, C., and Calvet, N. 1998, ApJ, 492, 323
- Haisch et al (2001) Haisch, K.E., Jr., Lada, E.A, and Lada, C.J. 2001, ApJ, 553, L153
- Hartman et al (1998) Hartmann, L., Calvet, N., Gullbring, E., and D’Alessio, P. 1998, ApJ, 494, 385
- Hill et al (1995) Hill, V., Andrievsky, S., and Spite, M. 1995, A&A, 293, 347
- Hodge (1988) Hodge, P.W. 1988, PASP, 100, 1051
- Lamers et al (1999) Lamers, H.J.G.L.M., Beaulieu, J. P., and de Wit, W. J. 1999, A&A, 341, 827
- Lynden-Bell and Pringle (1974) Lynden-Bell, D., and Pringle, J.E. 1974, MNRAS, 168, 603
- Madau et al (1996) Madau, P., Ferguson, H.C., Dickinson, M.E., et al 1996, MNRAS, 283, 1388
- Muzerolle et al (2000) Muzerolle, J., Calvet, N., Briceño, C., Hartmann, L., and Hillenbrand, L. 2000, ApJ, 535, L47
- Padget (1996) Padgett, D.L. 1996, AJ, 471, 874.
- Palla and Stahler (1991) Palla, F., and Stahler, S. 1991, ApJ, 360, 47
- Panagia et al (2000) Panagia, N., Romaniello, M., Scuderi, S., and Kirschner, R.P. 2000, ApJ, 539, 197
- Pasquini et al (2000) Pasquini, L., de Medeiros, J.R., and Girardi, L. 2000, A&A, 361, 1011
- Pei et al (1999) Pei, Y.C., Fall, S.M., and Hauser, M.G. 1999, ApJ, 522, 604
- Robberto et al (2004) Robberto, M., Song, J., Mora Carillo, G. Beckwith, S.V.W., Makidon, R.B., and Panagia, N. 2004, ApJ, in press
- Romaniello (1998) Romaniello, M. 1998, Ph.D. Thesis, Scuola Normale Superiore, Pisa
- Romaniello at al (2000) Romaniello, M., Salaris, M., Cassisi, S., and Panagia, N. 2000, ApJ, 530, 738
- Romaniello et al (2002) Romaniello, M., Panagia, N., Scuderi, S., and Kirshner, R.P. 2002, AJ, 123, 91
- Romaniello et al (2003) Romaniello, M., Scuderi, S. Panagia, N., Salerno, R.M., and Blanco, C. 2003, A&A, in press
- Scalo (1998) Scalo, J. 1998, in “The Stellar Initial Mass Function”, eds. G. Gilmore and D. Howell, ASP Conference Series, 142, 201
- Schwering (1991) Schwering, P.B.W., and Israel, F.P. 1991, A&A, 246, 231
- Scuderi et al (1996) Scuderi, S., Panagia, N., Gilmozzi, R., Challis, P.M., and Kirshner, R.P., 1996, ApJ, 465, 956
- Siess et al (1997) Siess, L., Forestini, M., and Dougados, C. 1997, A&A, 324, 556
- Tolstoy (2000) Tolstoy, E. 2000, in “A Decade of HST Science”, eds. M. Livio, K. Noll and M. Stiavelli
- Ulmschneider (1979) Ulmschneider, P. 1979, Space Sci. Rev., 24, 71
- van der Marel and Cioni (2001) van der Marel, R.P., and Cioni, M.-R.L. 2001, AJ, 122, 1807
- Whitmore (1995) Whitmore, B. 1995, in “Calibrating HST: Post Servicing Mission”, eds. A. Koratkar and C. Leitherer (Baltimore: STScI), 269
- Wyse (1998) Wyse, R. 1998, PASP, 142, 89


| Filter Name | Exposure Time (seconds) | Comments | ||
|---|---|---|---|---|
| September 1994aaSeptember 24, 1994, proposal number 5753 (SINS collaboration, PI R.P. Kirshner). | February 1996bbFebruary 6, 1996, proposal number 6020 (SINS collaboration, PI R.P. Kirshner). | July 1997ccJuly 10, 1997, except for F502N taken on July 12, 1997, proposal number 6437 (SINS collaboration, PI R.P. Kirshner). | ||
| F255W | 2x900 | 1100+1400 | 2x1300 | UV Filter |
| F336W | 2x600 | 2x600 | 2x800 | U Filter |
| F439W | 2x400 | 350+600 | 2x400 | B Filter |
| F555W | 2x300 | 2x300 | 2x300 | V Filter |
| F675W | 2x300 | 2x300 | 2x300 | R Filter |
| F814W | 2x300 | 2x300 | 2x400 | I Filter |
| F656N | — | 1100+1300ddFebruary 3, 1994 proposal number 5203 (PI J. Trauger). | 4x1400 | |