A brief review of long-term X-ray and optical variability in radio-quiet AGN
Abstract
Long-time-scale X-ray and optical variability is a key characteristic of AGN. Here, we summarise our current understanding of the X-ray and optical continuum variability of radio-quiet AGN and the relation between the two bands. We demonstrate the strong connection between the X-ray variability properties of AGN and the variability of stellar-mass black hole candidates on much shorter time-scales, and discuss the implications of this result for the origins of the variability. The relationship between optical and X-ray variability is complex, with some AGN showing strong X-ray/optical correlations while others show no obvious correlation. We suggest a possible explanation for this variety of behaviour.
1 Introduction
Time-variable emission over the entire observable spectrum is one of the
defining characteristics of AGN. Variability on time-scales of months to
years provided the first key evidence that the emitting regions were
extremely compact, leading to the suggestion that AGN are powered by
massive black holes. However, although the black hole paradigm has
grown stronger due to a variety of subsequent observations, the origin
of the variability largely remains a mystery. In radio-loud AGN,
some progress has been made in understanding the broadband variability in
terms of jet models of emission[1], but the situation is less clear in
radio quiet AGN, which form the bulk of the AGN population.
Because, in the optical
waveband, the variability is fairly slow, it can only be studied in detail
with long, well-sampled monitoring campaigns which are difficult
to organise. In the X-ray band, where the variability is much more rapid,
short-term variability was originally
studied using ‘long-looks’ of a day or more duration, by X-ray
satellites such as EXOSAT and ASCA, but longer time-scales
were inaccessible due to the constraints of scheduling and pointing these
satellites. In 1995, the launch of the Rossi X-ray Timing Explorer
(RXTE)
revolutionised the study of AGN variability, because the rapid slewing
capability and flexible scheduling of RXTE allowed well-sampled
long-term monitoring of AGN X-ray variability for the very first time.
With RXTE, it has been possible to study X-ray variability of
radio-quiet AGN over a very
broad range of time-scales for comparison with the (as it turns out)
remarkably similar variability properties of stellar mass black holes in
X-ray binary systems (BHXRBs). Also, it has been possible
to compare the long-term
X-ray variability with the optical variability sampled by a few optical
monitoring programs, to examine the relationship between the two bands,
which we might expect to be dominated by different emission mechanisms
(optically thin versus optically thick). In this paper we will review
our current understanding of the long-term X-ray variability of radio-quiet
AGN, and how it relates to the X-ray variability on shorter time-scales. We
will also consider the relationship between the X-ray and optical bands, and
discuss models which might explain the variability in both bands.
2 X-ray variability and the AGN-BHXRB connection
2.1 Before RXTE
In the 1980s, studies with EXOSAT showed that on short time-scales,
AGN variability appeared to be red-noise.[2, 3] In other words the variability
showed no obvious periodic or quasi-periodic behaviour (and hence is
called noise),
but showed variability over the entire range of sampled time-scales
(and hence is
‘red’ with the variability power density
increasing towards lower temporal frequencies).
222We note here that to date, no statistically significant
examples of (quasi)-periodicities have been found in AGN X-ray light
curves[4] with the possible (and intriguing) exception of long EUVE observations of two Narrow Line Seyfert 1s.[5] This
situation is probably to be expected, because
assuming such signals exist in AGN
at equivalent frequencies (i.e. scaled by black hole mass)
and powers to those seen in BHXRBs, only very long
(weeks) and continuous observations would be likely to detect them. The
corresponding power spectral density functions (PSDs) were
described by power-laws (of index -1 to -2),
which were unbroken down to the lowest sampled frequencies of Hz. However, it was
noted[6] that this power-law shaped PSD is reminiscent of the high
frequency PSDs (above Hz) of black hole X-ray binary systems,
and that if the similarity holds to lower frequencies we should expect to
see a break to a flatter PSD slope, below frequencies corresponding
to time-scales of days-weeks (provided we make the
physically plausible assumption that the break time-scale
scales linearly with black hole mass).
Attempts to detect this break frequency,
using sparsely sampled archival data from different missions to cover
long time-scales, were hampered by the distorting effects of sampling and
the limited data, but they were at least suggestive that there was a
flattening of the PSD at the expected frequencies.[6, 7]
Around the same time as the early AGN PSD studies,
an inverse correlation was noted between the amplitude of variability in
day-long AGN X-ray light curves and the X-ray luminosity of the
AGN.[8, 9, 10] Of a number of possible models to explain this
result, the most promising was that the effect represented the expected
correlation
between the black hole mass (which is tracked by luminosity assuming a common
fractional accretion rate) and the variability time-scale, with more massive
(and luminous) AGN showing slower variability due to their larger size.
The situation was complicated by the discovery that Narrow Line Seyfert 1s
(NLS1) do not follow this correlation (they show large
variability amplitudes even at high luminosities).[11, 12]
2.2 The RXTE era
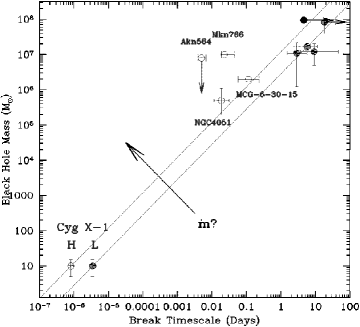
The prospect of a direct analogy between AGN and BHXRB X-ray variability led a number of researchers[6, 13, 14] to show how the X-ray PSD might be used to estimate the black hole mass of the AGN, by simply scaling from the PSDs of BHXRBs (for example the well-studied Cyg X-1) and assuming a BHXRB black hole mass of M⊙. However, without actual confirmation of the PSD break time-scales in AGN, it was impossible to tell if the variability time-scales really did scale with black hole mass, or indeed if AGN variability really is similar to that of BHXRBs333It is worth noting here than BHXRBs show a wide variety of variability properties, with different PSD shapes (and energy spectra) depending on the ‘state’ of the BHXRB.[15] For example, the low/hard state PSD is characterised by two breaks, a high frequency break (where PSD index changes from to -1) around 1-6 Hz, and a low frequency break around Hz (where PSD index changes from -1 to 0). The high/soft state PSD on the other hand shows only a single break (from index to -1) at around 10 Hz. Therefore, when estimating black hole mass using PSDs it is important to know which BHXRB state (if any) we are comparing with..

The situation changed with the launch of RXTE and the first
high-quality AGN X-ray monitoring campaigns (see Fig. 1),
which sampled a broad range of time-scales. One notable aspect
of the long-time-scale data is that, although the variability amplitudes
of AGN with different luminosities are very different on short time-scales,
they are similar on long time-scales
(e.g. compare NGC 4051 with the 100 times more luminous
NGC 5548 in Fig. 1), as would be
expected if there is a PSD break at a time-scale which scales with
the mass.[16] Within a few years, sufficient
long-term monitoring data was available to confirm the existence of
PSD breaks. [17, 18, 19, 20, 21] Detailed analyses, using Monte Carlo methods to robustly constrain
the PSD shape (e.g. accounting for
‘aliasing’ effects), were able to show that the PSD appeared to
break from an index to index and not 0,
implying that the breaks are more likely to be
analogous to the high-frequency breaks in
the PSD of Cyg X-1 (in either the low or high state), and that the
break time-scales were consistent with a linear scaling of characteristic
time-scales with black hole mass.[19, 20]
Several AGN show PSD breaks at high enough frequencies that they
are detectable in XMM-Newton long-look
observations.[22, 23, 24] The time-scales of
these breaks are
too short for these AGN to be analogues of low-state BHXRBs, since
the inferred low masses (estimated by scaling from the low-state
PSD break in Cyg X-1)
would imply super-Eddington accretion rates,
inconsistent with the low accretion rate thought to be associated with
the low state. One possible explanation is that
these AGN show PSDs which are analogous to the PSDs of BHXRBs in the high/soft
state, which show higher break frequencies than in the low/hard state.
However,
the best way to distinguish the low and high-state PSD shapes is to look at
even lower frequencies where - in the low state -
we expect to see a second break to zero slope,
about a decade below the high-frequency break.
The best quality AGN PSD
yet obtained is that of the NLS1 NGC 4051[24], which is
reproduced here in Fig. 3, plotted for comparison with Cyg X-1
as frequencypower[13]so
that a flat top corresponds to an index of -1. Clearly there is no
low-frequency break and the PSD looks much more similar to that of
Cyg X-1 in the high/soft state.
By scaling the PSD break time-scale seen for NGC 4051 with the equivalent
break time-scale in Cyg X-1, we
estimate a low black hole mass of M⊙, consistent with
that obtained by reverberation mapping.[25] Fig. 3 also shows the PSD of the broad-line Seyfert
NGC 3516, which shows a break at longer time-scales, as one would expect given the larger black hole mass of this
AGN from reverberation mapping.
Because of the lower break frequency the
PSD frequency coverage
does not extend far enough to rule out a low/hard state PSD in this case,
however there is tantalising evidence of a low state PSD in another
broad line Seyfert, NGC 3783.[20] Interestingly, a comparison of break time-scales with
black hole masses estimated by various means (Fig. 3)
is suggestive that the
NLS1s tend to have shorter time-scales for their mass, which are consistent
with high/soft state PSDs, or more generally implies that there is
a decrease in variability
time-scale with increasing accretion rate.[24]
If we assume that
broad line Seyferts have different accretion rates as a class to NLS1s,
the difference in PSD break time-scales could help explain why NLS1s do not
conform to the variability amplitude-luminosity correlation observed in broad line Seyferts.[26]

2.3 Physical implications
The fact that the
broadband PSDs of AGN measured by RXTE can be described as singly
broken or more gently bending continua[24] suggests
that the long-term variability is a continuation of the same
red-noise process seen on shorter time-scales. More importantly, the fact that
AGN X-ray variability appears analogous to that of BHXRBs suggests that the
same physical mechanism is at work in generating the variability, regardless
of black hole size. Furthermore, the fact that PSD break time-scales
are consistent with a linear scaling with black hole mass (assuming the same
accretion state) implies a similar mass-dependent
scaling in the characteristic time-scales
of the underlying process.[19, 20, 24]
The similarities in AGN and BHXRB variability extend beyond the shape of the
PSD. Both types of source show a strong linear correlation between the
rms amplitude of variability and the X-ray
flux[27, 22, 23, 24], which implies
that the variability process is non-linear[28].
Both BHXRBs[29, 30, 31]
and AGN[32, 22, 24]
also show time-scale dependent lags between hard and soft X-ray bands
(with lags of similar magnitude and direction),
and a similar energy-dependence of PSD shape
above the break frequency, with flatter PSDs at harder energies.
[30, 33, 22, 24] These analogies further suggest that clues to the origin of X-ray variability
in AGN can be gained by studying the variability of BHXRBs, for which the
timing data is more diverse, of higher quality and the phenomenological
understanding of the variability is more advanced. For
example, the various properties
of the rms-flux relation observed in
BH and neutron star XRBs strongly suggest that the variability originates
in the accretion flow itself and is not caused by, e.g. coronal flares
(although the rate or amplitude of
such flares may be modulated by the accretion flow
variations).[34, 35] Models where the variability is
due to propagating variations in the accretion flow can also help to
explain the energy dependent timing properties of
BHXRBs[36] and AGN[22, 24].
Finally, it is amusing to note that the existence of the PSD breaks observed
in AGN provides indirect evidence for black holes in these objects. This
is because XRBs which are thought to contain neutron stars do not show
such breaks (their
PSD slopes remain as to high frequencies), but black hole
candidates do[37]. Therefore
by analogy, if we believe that the BHXRBs are aptly named,
we should also believe that black holes power AGN!
3 Optical variability and the Optical/X-ray relation
3.1 A confusing picture
For many years, most of our knowledge about the variability of radio-quiet
AGN was learned
from the optical band. These advances came
largely thanks to the dedicated efforts of
teams of observers using ground-based telescopes, primarily to
monitor the variability of various permitted optical emission lines and their
response to continuum variations, in an effort to ‘reverberation map’ the
line emitting regions of AGN and so also determine
their masses.[38, 39] A useful
byproduct of these campaigns is a wealth of data on continuum variability
stretching back many years. Not surprisingly, this variability also appears
to be red-noise, but on short time-scales the amplitude of variability
is much smaller than seen in the X-rays. The optical continuum
emission in AGN is thought to come primarily from
the thermal emission of the accretion disk,[40] with longer wavelength emission mainly
originating from larger radii where the disk is cooler.
However, the simultaneous
nature of optical and UV variations (with minimal lag) led
to suggestions that the variable optical/UV emission is driven by
X-ray reprocessing in the disk,[41] causing the shorter-time-scale X-ray variations to be ‘washed out’ in
the optical by light
travel-time effects. This mechanism for optical variability can be
simply tested by searching for correlated optical and X-ray variability.
Before RXTE, efforts to search for optical/X-ray correlations were
compromised by the difficulty of obtaining good quality X-ray monitoring to
match that in the optical, although hints of an optical/X-ray correlation
were observed.[42, 43] Interesting
progress was made with short-time-scale
variability, with optical and X-ray monitoring of NGC 4051
showing negligible optical variability during
large-amplitude X-ray variations, ruling out an origin of X-rays and optical
photons from the same electron population.[44]
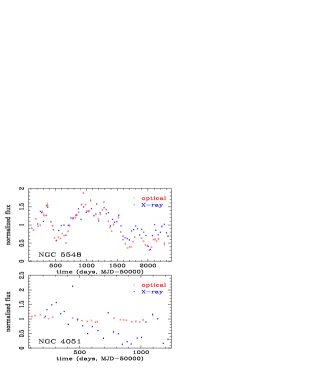
The launch of RXTE allowed much better data to be obtained, and accordingly the situation immediately became more confusing. First, month-long IUE and RXTE monitoring of NGC 7469 showed no correlation between continuum flux variations in UV and X-ray bands, although the X-ray spectral index does appear to correlate with the UV flux, suggestive of Compton cooling by the UV photons.[45, 46] However, NGC 3516 showed no such correlation, with optical and X-ray variations that appear to be unrelated on both short and long time-scales.[47, 48] Intensive optical and X-ray monitoring of NGC 4051, has finally revealed correlated X-ray and optical variability in this source on long and short time-scales, although the optical variability remains surprisingly weak compared to the X-rays (few % fractional rms versus %).[49, 25, 50] In contrast to these results, the best optical/X-ray correlation observed in an AGN so far is seen in NGC 5548, which shows strong and highly correlated variability in both bands on time-scales of months and longer.[51] The difference in optical variability amplitudes between NGC 5548 and NGC 4051 is highlighted in Fig. 4. Despite both AGN showing strong long-term X-ray variability, only NGC 5548 shows strong optical variability. In fact, on long time-scales, the optical variability amplitude of NGC 5548 is even larger than the amplitude of X-ray variability, which seems to rule out models where optical variability is due solely to reprocessing in the disk. This is because in these models the amplitude of optical variability should be smaller than the amplitude of X-ray variability, because reprocessed optical emission would be diluted by the emission from viscous dissipation in the reprocessing disk.
3.2 Explaining the complex optical/X-ray behaviour
This complicated picture of optical variability in AGN might be explained if we consider the different origin of the optical emission compared to the X-ray emission. The X-rays are presumably produced in optically thin material close to the central black hole, at similar relative radii (i.e. in Schwarzschild radii, ) in different AGN, i.e. irrespective of the black hole mass (as is implied by the similar X-ray timing behaviour of AGN and BHXRBs, despite the huge difference in mass). However, if the optical emission originates from optically thick material (mainly via viscous dissipation but probably also through reprocessing), we expect the relative radius of the optical emitting region to depend on the black hole mass, because disk temperature is thought to scale as . In AGN with lower BH mass and higher accretion rate (in terms of the Eddington rate), such as NGC 4051, most optical emission will originate relatively far from the central black hole (few hundred ), due to the relatively high disk temperature in these objects. In contrast, higher mass and lower accretion rate AGN, such as NGC 5548 will possess lower temperature disks and so their optical emission will originate from closer to the central black hole, and closer to the X-ray emitting region. If the inner disk is also less stable than the outer disk, it is perhaps not suprising that we see strongly variable optical emission in NGC 5548 which is well correlated with X-rays, but we see only weakly varying optical emission in NGC 4051. The situation is likely to be complicated by the effects of reprocessing and Compton cooling, so that a combination of these effects could produce the range of different optical/X-ray relations that are observed. For example, in NGC 4051 the XMM-Newton monitoring suggests that the optical band lags the X-rays by days[50], whereas longer term monitoring suggests that on longer time-scales the optical leads by 2 days[25]. This intriguing result may suggest that different processes produce the optical variations on different time-scales.
References
- [1] I. M. McHardy, A. Lawson, A. Newsam, A. Marscher, I. Robson and J. Stevens, \JLMon. Not. R. Astron. Soc.,310,1999,571.
- [2] I. M. McHardy and Czerny B., \JLNature,325,1987,696.
- [3] A. Lawrence, M. G. Watson, K. A. Pounds and M. Elvis, \JLNature,325,1987,694.
- [4] S. Benlloch, J. Wilms, R. Edelson, T. Yaqoob and R. Staubert, \AJ562,2001,L121.
- [5] J. P. Halpern, K. M. Leighly and H. L. Marshall, \AJ585,2003,665.
- [6] I. M. McHardy, \JLMem. Soc. Astron. Ital.,59,1988,239.
- [7] I. E. Papadakis and I. M. McHardy, \JLMon. Not. R. Astron. Soc.,273,1995,923.
- [8] P. Barr and R. F. Mushotzky, \JLNature,320,1986,421.
- [9] A. R. Green, I. M. McHardy and H. J. Lehto, \JLMon. Not. R. Astron. Soc.,265,1993,664.
- [10] K. Nandra, I. M. George, R. F. Mushotzky, T. J. Turner and Yaqoob T., \AJ476,1997,70.
- [11] T. J. Turner, I. M. George, K. Nandra and D. Turcan, \AJ524,1999,667.
- [12] K. M. Leighly, \JLAstrophys. J. Suppl.,125,1999,297.
- [13] K. Hayashida, S. Miyamoto, S. Kitamoto, H. Negoro and H. Inoue, \AJ500,1998,642.
- [14] B. Czerny, M. Nikolajuk, M. Piasecki and J. Kuraszkiewicz, \JLMon. Not. R. Astron. Soc.,325,2001,865.
- [15] J. E. McClintock and R. A. Remillard, to appear in Compact Stellar X-ray Sources, eds. W. H. G. Lewin and M. van der Klis (Cambridge University Press, Cambridge, 2004), astro-ph/0306213.
- [16] A. Markowitz and R. Edelson, \AJ547,2001,684.
- [17] I. M. McHardy, I. E. Papadakis and P. Uttley, \JLNuc. Phys. B (Proc. Suppl.),69,1998,509.
- [18] R. Edelson and K. Nandra, \AJ514,1999,682.
- [19] P. Uttley, I. M. McHardy and I. E. Papadakis, \JLMon. Not. R. Astron. Soc.,332,2002,231.
- [20] A. Markowitz, et al., \AJ593,2003,96.
- [21] I. E. Papadakis, P. Reig and K. Nandra, \JLMon. Not. R. Astron. Soc.,344,2003,993.
- [22] S. Vaughan, A. C. Fabian and K. Nandra, \JLMon. Not. R. Astron. Soc.,339,2003,1237.
- [23] S. Vaughan and A. C. Fabian, \JLMon. Not. R. Astron. Soc.,341,2003,496.
- [24] I. M. McHardy, I. E. Papadakis, P. Uttley, M. J. Page and K. O. Mason, Mon. Not. R. Astron. Soc., in press, 2004, astro-ph/0311220.
- [25] O. Shemmer, P. Uttley, H. Netzer and I. M. McHardy, \JLMon. Not. R. Astron. Soc.,343,2003,1341.
- [26] I. E. Papadakis, \JLMon. Not. R. Astron. Soc.,348,2004,207.
- [27] P. Uttley and I. M. McHardy, \JLMon. Not. R. Astron. Soc.,323,2001,L26.
- [28] P. Uttley, I. McHardy and S. Vaughan, \JLAstron. Soc. Pacific Conf. Series,290,2003,131.
- [29] S. Miyamoto and S. Kitamoto, \JLNature,342,1989,773.
- [30] M. A. Nowak, B. A. Vaughan, J. Wilms, J. B. Dove and M. C. Begelman, \AJ510,1999,874.
- [31] K. Pottschmidt, J. Wilms, M. A. Nowak, W. A. Heindl, D. M. Smith and R. Staubert, \JLAstron. and Astrophys.,357,2000,L17.
- [32] I. E. Papadakis, K. Nandra and D. Kazanas, \AJ554,2001,L133.
- [33] K. Nandra and I. E. Papadakis, \AJ554,2001,710.
- [34] P. Uttley, \JLMon. Not. R. Astron. Soc.,347,2004,L61.
- [35] T. Gleissner, J. Wilms, K. Pottschmidt, P. Uttley, M. A. Nowak and R. Staubert, \JLAstron. and Astrophys.,414,2004,1091.
- [36] O. Kotov, E. Churazov and M. Gilfanov, \JLMon. Not. R. Astron. Soc.,327,2001,799.
- [37] R. Sunyaev and M. Revnivtsev, \JLAstron. and Astrophys.,358,2000,617.
- [38] A. Robinson,\JLAstron. Soc. Pacific Conf. Series,69,1994,147.
- [39] B. M. Peterson, I. Wanders, R. Bertram, J. F. Hunley, R. W. Pogge and R. M. Wagner, \AJ501,1998,82.
- [40] A. Koratkar and O. Blaes, \JLPub. Astron. Soc. Pacific,111,1999,1.
- [41] J. H. Krolik, K. Horne, T. R. Kallman, M. A. Malkan, R. A. Edelson and G. A. Kriss, \AJ371,1991,541.
- [42] J. Clavel, et al., \AJ393,1992,113.
- [43] R. A. Edelson, et al. \AJ470,1996,364.
- [44] C. Done, M. J. Ward, A. C. Fabian, H. Kunieda, S. Tsuruta, A. Lawrence, M. G. Smith and W. Wamsteker, \JLMon. Not. R. Astron. Soc.,243,1990,713.
- [45] K. Nandra, J. Clavel, R. A. Edelson, I. M. George, M. A. Malkan, R. F. Mushotzky, B. M. Peterson and T. J. Turner, \AJ505,1998,594.
- [46] K. Nandra, T. Le, J., I. M. George, R. A. Edelson, R. F. Mushotzky, B. M. Peterson and T. J. Turner, \AJ544,2000,734.
- [47] R. A. Edelson, et al., \AJ534,2000,180.
- [48] D. Maoz, A. Markowitz, R. Edelson and K. Nandra, \JLAstron. J.,124,2002,1988.
- [49] B. M. Peterson, et al., \AJ542,2000,161.
- [50] K. O. Mason, et al., \AJ580,2002,L117.
- [51] P. Uttley, R. Edelson, I. M. McHardy, B. M. Peterson and A. Markowitz, \AJ584,2003,L53.