Using Local Group Galaxies to Investigate the Influence of Blending on Cepheid Distances and the Cosmological Distance Scale
Abstract
We investigate the influence of blending on the Cepheid distance scale using two Local Group galaxies, M31 and M33. Blending leads to systematically low distances to galaxies observed with the HST, and therefore to systematically high estimates of . High-resolution HST images are compared to our ground-based data, obtained as part of the DIRECT project, for a sample of 22 Cepheids in M31 and 102 Cepheids in M33. For a sample of 22 Cepheids in M31, the average (median) flux contribution from luminous companions not resolved on the ground-based images in the -band, , is about 19% (12%) of the flux of the Cepheid. For 102 Cepheids in M33 the average (median) values of , , are 23% (13%), 28% (20%), 28% (15%). For 64 Cepheids in M33 with periods in excess of 10 days the average (median) , , are 16% (7%), 23% (12%), 20% (10%).
Harvard-Smithsonian Center for Astrophysics, 60 Garden St, Cambridge, MA 02138, USA; bmochejs@cfa.harvard.edu
National Optical Astronomy Observatories, North Cherry Ave., Tucson, AZ 85719, USA; lmacri@noao.edu
Harvard-Smithsonian Center for Astrophysics, 60 Garden St, Cambridge, MA 02138, USA; sasselov@cfa.harvard.edu, kstanek@cfa.harvard.edu
1. Introduction
As the number of extragalactic Cepheids discovered with HST continues to increase and the value of is sought from distances based on these variables, it becomes even more important to understand various possible systematic errors which could affect the extragalactic distance scale. Currently, the most important systematic is a bias in the distance to the Large Magellanic Cloud, which provides the zero-point calibration for the Cepheid distance scale (e.g. Udalski 2000; Fitzpatrick et al. 2003). Another possible systematic, the metallicity dependence of the Cepheid Period-Luminosity (PL) relation, is also very much an open issue, with empirical determinations ranging from 0 to mag dex-1 (e.g. Sasselov et al. 1997; Udalski et al. 2001).
We define blending as the close projected association of a Cepheid with one or more intrinsically luminous stars, which cannot be detected within the observed point-spread function (PSF) by photometric analysis. Blending is thus a phenomenon different from crowding or confusion noise; the latter occurs in stellar fields with a crowded and complex background due to the random superposition of stars with different luminosities.
We investigate the effects of stellar blending on the Cepheid distance scale by studying two Local Group spiral galaxies, M31 and M33. We identify some of the Cepheids, discovered by the DIRECT project (Stanek et al. 1999, Mochejska et al. 1999) on archival HST-WFPC2 images and compare them to our ground-based data to estimate the impact of blending on our photometry, taking advantage of their superior resolution.
2. The Blending Catalogs
We have adopted three criteria that a companion to a Cepheid has to fulfill to be included into our catalog as a blend. The star has to: (1) be located at a distance less than from the Cepheid (half the typical full width at half maximum on ground-based images), (2) be undetected by DAOPHOT in our ground-based images, (3) contribute at least 4% (for M31) or 6% (for M33) of the flux of the Cepheid in the same filter.
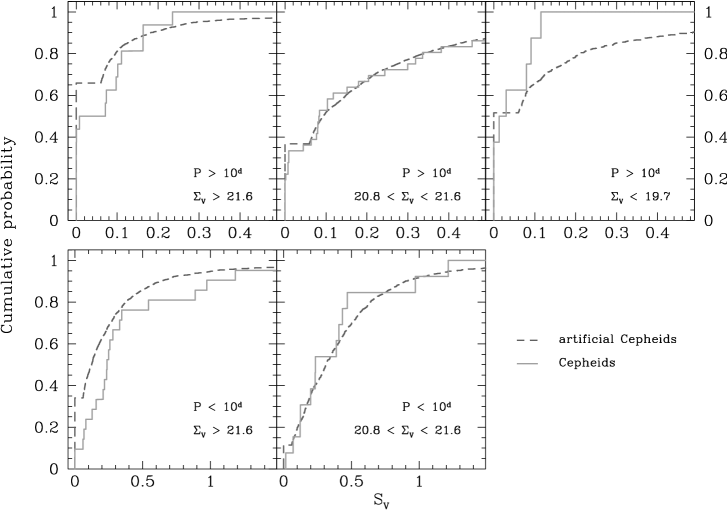
To quantify blending we have used the parameter , defined in Mochejska et al. (2000) as the sum of all flux contributions from blends in filter normalized to the flux of the Cepheid: where is the flux of the i-th blend, the flux of the Cepheid on the HST image and the total number of blends. Table 1 shows the blending statistics for M31 and M33. The detailed blending catalogs can be found in Mochejska et al. (2000, 2001). The cumulative probability distribution of blending in M33 in the V filter is plotted in Figure 1 (continuous line).
| Period | |||||||||||||
|---|---|---|---|---|---|---|---|---|---|---|---|---|---|
| range | avg | med | N | avg | med | N | avg | med | N | ||||
| M31 | all Periods | 0.19 | 0.12 | 22 | |||||||||
| M33 | all Periods | 0.24 | 0.14 | 95 | 0.30 | 0.21 | 62 | 0.29 | 0.15 | 57 | |||
| M33 | P 10 days | 0.37 | 0.25 | 35 | 0.43 | 0.29 | 20 | 0.47 | 0.26 | 18 | |||
| M33 | P 10 days | 0.16 | 0.07 | 60 | 0.23 | 0.14 | 42 | 0.20 | 0.10 | 39 |

3. Crowding vs. Blending - Artificial Star Tests
If we assume that a Cepheid is associated with other luminous stars located in its proximity, then moving it to a randomly chosen position on the image will break that association. In the former case, the Cepheid will be subject to blending; in the latter, to crowding.
To estimate the influence of crowding we have generated an artificial catalog: for each Cepheid observed on a WFPC2 image we generated a list of 100 random positions and determined the contribution from companions at that location.
Figure 1 shows the cumulative probability distributions for drawn from the artificial crowding catalog (dashed line) and the Cepheid blending catalog (solid line). We have divided the sample of M33 Cepheids into two bins in period at and three bins in surface brightness, corresponding to regions near the nucleus, inside the spiral arms and in between them.
For Cepheids located in regions of lowest surface brightness blending is stronger than crowding. The two effects appear comparable in magnitude for Cepheids located in intermediate surface brightness regions. For Cepheids located in the highest surface brightness regions blending is weaker than crowding, most likely due to selection effects.
This comparison indicates that the importance of blending relative to crowding very likely increases with decreasing surface brightness. This is not unexpected, as young stars are known to cluster (Harris & Zaritsky 1999). Increasing the level of crowding will tend to obscure this effect.
4. Indications for Remote Galaxies
Using the HST M33 data as the template we have obtained an estimate of the effect that blending would have on this galaxy if it were observed at further distances. By increasing the radius around the Cepheid for summing the contributions from the blends we can simulate the deterioration of resolution due to the increasing distance to the galaxy. We have restricted ourselves to the long period Cepheids (), as they are preferred for determining distances. We have also rejected all Cepheids with , assuming that they will be recognized as blended based on the shape of the light curve and rejected from the sample. The bias in distance due to blending is illustrated in Fig. 2 as a function of distance. The distance underestimate increases from to 8% at 10-15 Mpc and levels off at 9%-10% at 25-30 Mpc. This indicates that blending could potentially be a substantial source of error in the Cepheid distance scale.
References
Fitzpatrick, E. L., et al. 2003, ApJ, 587, 685
Harris, J., & Zaritsky, D. 1999, AJ, 117, 2831
Mochejska, B. J., et al. 1999, AJ, 118, 2211
Mochejska, B. J., Macri, L. M., Sasselov, D. D., & Stanek, K. Z. 2000, AJ, 120, 810
Mochejska, B. J., Macri, L. M., Sasselov, D. D., & Stanek, K. Z. 2001, astro-ph/0103440
Sasselov, D. D., et al. 1997, A&A, 324, 471
Stanek, K. Z., et al. 1999, AJ, 117, 2810
Udalski, A., et al. 2000, Acta Astronomica, 50, 307
Udalski, A., et al. 2001, Acta Astronomica, 51, 221