Spectroscopic Studies of Extremly Metal-Poor Stars with Subaru/HDS: II. The r-process Elements, Including Thorium.11affiliation: Based on data collected at the Subaru Telescope, which is operated by the National Astronomical Observatory of Japan.
Abstract
We have obtained high-resolution, high S/N near-UV-blue spectra of 22 very metal-poor stars ([Fe/H] ) with Subaru/HDS, and measured the abundances of elements from C to Th. The metallicity range of the observed stars is [Fe/H] . As found by previous studies, the star-to-star scatter in the measured abundances of neutron-capture elements in these stars is very large, much greater than could be assigned to observational errors, and in comparison with the relatively small scatter in the - and iron-peak elements. In spite of the large scatter in the ratios of the neutron-capture elements relative to iron, the abundance patterns of heavy neutron-capture elements () are quite similar within our sample stars. The Ba/Eu ratios in the 11 very metal-poor stars in our sample in which both elements have been detected are nearly equal to that of the solar system r-process component. Moreover, the abundance patterns of the heavy neutron-capture elements (56 70) in seven objects with clear enhancements of the neutron-capture elements are similar to that of the solar system r-process component. These results prove that heavy neutron-capture elements in these objects are primarily synthesized by the r-process.
In contrast, the abundance ratios of the light neutron-capture elements (38 Z 46) relative to the heavier ones (56 Z 70) exhibit a large dispersion. Our inspection of the correlation between Sr and Ba abundances in very metal-poor stars reveals that the dispersion of the Sr abundances clearly decreases with increasing Ba abundance. This trend is naturally explained by hypothesizing the existence of two processes, one that produces Sr without Ba, and another that produces Sr and Ba in similar proportions. This result should provide a strong constraint on the origin of the light neutron-capture elements at low metallicity.
We have identified a new highly r-process element-enhanced, metal-poor star, CS 22183–031, a giant with [Fe/H] = and [Eu/Fe] = +1.2. We also identified a new, moderately r-process-enhanced, metal-poor star, CS 30306–132, a giant with [Fe/H] = and [Eu/Fe] = +0.85.
The abundance ratio of the radioactive element Th (Z = 90) relative to the stable rare-earth elements (e.g., Eu) in very metal-poor stars has been used as a cosmochronometer by a number of previous authors. Thorium is detected in seven stars in our sample, including four objects for which the detection of Th has already been reported. New detections of thorium have been made for the stars HD 6268, HD 110184, and CS 30306–132. The Th/Eu abundance ratios (log(Th/Eu)), are distributed over the range to , with typical errors of 0.10 to 0.15 dex. In particular, the ratios in two stars, CS 31082–001 and CS 30306–132, are significantly higher than the ratio in the well-studied object CS 22892–052 and those of other moderately r-process-enhanced metal-poor stars previously reported. Since these very metal-poor stars are believed to be formed in the early Galaxy, this result suggests that the abundance ratios between Th and stable rare-earth elements such as Eu, both of which are presumably produced by r-process nucleosynthesis, may exhibit real star-to-star scatter, with implications for (a) the astrophysical sites of the r-process, and (b) the use of Th/Eu as a cosmochronometer.
1 Introduction
The very metal-poor stars, presently found in the halo of the Galaxy, are believed to have formed at the earliest times, shortly after it became possible for the Universe to make stars with sufficiently long main-sequence lifetimes (i.e., masses ) to survive for Gyr. The chemical compositions of these stars are thus expected to reflect a quite small number of nucleosynthesis processes, possibly as small as one, while the compositions of more metal-rich stars like the Sun reflect the cumulative (hence quite complex) results of the various processes that have been in operation during the entire history of Galactic chemical evolution. Recent abundance analyses for extremely metal-poor stars have provided quite valuable information on the individual nucleosynthesis processes involved (e.g., McWilliam et al., 1995; Ryan, Norris, & Beers, 1996; Burris et al., 2000; Cayrel et al., 2004). In particular, detailed abundance studies of heavy metals in such stars have led to important progress in the understanding of the origin of neutron-capture elements in the early Galaxy.
Sneden et al. (1996, 2000, 2003) have studied the abundances of the extremely metal-poor star CS 22892–052, the first example of a growing class of metal-poor stars that exhibit very large excesses of r-process elements relative to iron ([r-process/Fe] ). Even from the first analysis, it was apparent that the relative abundance pattern of the heavy neutron-capture elements (56 Z 76) in this star was identical (within observational errors) to that of the (inferred) solar system r-process component, which has been strengthened as more and better data have been acquired. This striking similarity may be surprising, considering that the abundance pattern of the Solar System has certainly been influenced by the integrated yields from a variety of nucleosynthesis sites. It should be pointed out that, in contrast, the abundance pattern of the lighter neutron-capture elements () in CS 22892–052 exhibit clear deviations from that of the solar-system r-process component (Sneden et al., 2000, 2003).
Recent analyses of a small number of additional very metal-poor stars with moderate excesses of r-process elements ( [r-process/Fe] ) (e.g., Westin et al., 2000; Johnson & Bolte, 2001; Cowan et al., 2002) have obtained similar results, that is, the abundance pattern of heavy neutron-capture elements () for each star is quite similar to that of the r-process component in solar-system material. These results imply that the neutron-capture elements in these very metal-poor stars were produced by the r-process, which produces quite similar abundance patterns at least for the range of (Schatz et al. 2002; Wanajo et al. 2002; Otsuki, Mathews, & Kajino 2003). By way of contrast, the abundance patterns of the lighter neutron-capture elements () are significantly different from that of the r-process component in the Solar System. This observational fact is interpreted as a result of the existence of (at least) two distinct classes of r-process events (e.g., Truran et al., 2002, and references therein).
The search for, and subsequent detailed abundance studies of, r-process-enhanced, very metal-poor stars enable one to make estimates of the ages of these objects111More appropriately, the time interval that has passed since the production of the r-process elements by the progenitor object(s) of these stars. For convenience, we will use the term “age” to refer to this time interval. by use of the radioactive species that can be identified in them. The long-lived radioactive r-process elements, in particular Th and U, whose half lives (14 Gyr for 232Th; 4.5 Gyr for 238U) are comparable to or shorter than the cosmic age ( 15 Gyr), provide a powerful tool for determination of a lower limit on the age of the Galaxy, and hence of the universe. If Th and/or U is detected in a very metal-poor star, we can estimate the lapse of time from the era of the nucleosynthesis process that created these elements to the present. This is accomplished by measuring the present abundance ratios, either of U/Th, when they are both detected (which only applies to two stars thus far), or by measurement of the U or Th abundance ratio as compared to stable r-process elements, such as Eu, and comparing them to predictions of the initial production ratios from models (both site-independent, e.g., Schatz et al. 2002, and site-dependent, e.g., Wanajo et al. 2002, 2003; Otsuki, Mathews, & Kajino 2003).
The cosmochronometry technique (in stars) was pioneered by Butcher (1987), who unfortunately only had roughly solar-abundance stars to work with, hence he had to contend with the difficulties arising from complex continua and line-blending problems, which are not so severe for very metal-poor stars. One clear advantage of the cosmochronometric method is that the resulting age estimate is free from a host of uncertainties encountered by other estimates of the cosmic age, such as calibration of distance scales, detailed understanding of stellar evolution, etc. Furthermore, since it is thought that the large overabundances of r-process elements are likely to have been associated with a single production event, quite likely a Type II supernova explosion in the early Galaxy, one is not forced to model the entire complex history of Galactic chemical evolution in order to estimate the age. The difficulties in this method, aside from the rarity of the very metal-poor stars with detectable Th and U (presently estimated to be no more than % of giants with [Fe/H] 222We use the usual notation [A/B] and log, for elements A and B. Also, the term “metallicity” will be assumed here to be equivalent to the stellar [Fe/H] value.; Beers, private communication), arise from the need to accurately predict the initial production ratios, which in turn depend on having a detailed understanding of the nucleosynthesis pathways, nuclear mass models, and cross-sections for species that have not been measured adequately at present (see Schatz et al. 2002 for details).
In the seminal study by François, Spite, & Spite (1993), Th abundances were reported for the first time for stars with metallicities as low as [Fe/H] –2.6. Sneden et al. (1996) first succeeded in obtaining a clear detection of Th, along with other r-process elements, in CS 22892–052 (see above), a relatively bright, extremely metal-poor giant ([Fe/H] = –3.1) discovered during the HK survey of Beers and collaborators (see Beers et al. 1992). From these authors’ measurement of the Th/Eu ratio, the age of this star was estimated to be 15.2 3.7 Gyr. In their analysis, they assumed the initial abundance ratio between Th and stable elements to be the same as that of the calculated initial solar-system abundance ratio. Subsequently, Westin et al. (2000) estimated the age of another r-process-enhanced metal-poor star, HD 115444, to be 14.2 4 Gyr from the Th/Eu ratio. Johnson & Bolte (2001) also measured Th abundances for five very metal-poor stars. Most recently, Cowan et al. (2002) studied the moderately r-process-enhanced, very metal-poor star, BD+173248. This star, with [Fe/H] = –2.1, and [Eu/Fe] = +0.9, has the distinction of being among the most metal-rich stars in which the r-process-enhancement phenomenon has been observed. These authors, based on an average of a number of chronometer pairs involving U and Th, obtained an age estimate of Gyr. Sneden et al. (2003) have assembled a definitive high-S/N set of spectra for CS 22892–052, drawing on space-based and ground-based observations. Their analysis has led to a revision of the Th/Eu age estimate for this star, to Gyr. These results are consistent with the very recent estimate of the age of the Universe by WMAP (Bennett et al. 2003) to within the reported errors.
Recently, Cayrel et al. (2001) and Hill et al. (2002) reported the detection of U, as well as Th, in a high-quality VLT/UVES spectrum of the extremely metal-poor star CS 31082–001, a bright [Fe/H] = –2.9 giant discovered in the HK survey. They also found that the abundance pattern of neutron-capture elements with closely mimics that of the r-process component in the Solar System. However, it is of interest that the situation seems to be different for nuclei near the heaviest elements. Th () and U () show larger deviations from their expected levels, if we adopt Gyr as the age of this object, as was estimated from the U/Th ratio by Hill et al. (2002). This result suggests that either CS 31082–001 is peculiar in some way that has affected the surface abundances of the actinides, or that the production ratios of Th and U, as compared to the stable elements (e.g., Eu) exhibit some real dispersion amongst very metal-poor stars. Further observational work is clearly required to answer this important question.
The primary purpose of this study is to obtain measurements of the abundance patterns of neutron-capture elements for very metal-poor stars, and to examine the age estimation of stars using the Th/Eu chronometer. In Honda et al. (2003; hereafter Paper I), we reported equivalent width measurements of absorption lines in high-quality spectra of 22 very metal-poor stars obtained with the Subaru Telescope High Dispersion Spectrograph (HDS, Noguchi et al., 2002). This sample is as large as those in previous studies by McWilliam et al. (1995), Ryan, Norris, & Beers (1996), and Johnson & Bolte (2001), and the quality of the spectra is quite high ( per resolution element) in the blue region. In particular, the sample was selected to include as many objects with excesses of neutron-capture elements as possible, excluding the objects affected by the s-process, to investigate the nature of r-process nucleosynthesis in the early Galaxy. In this paper, we present the abundance analyses for the neutron-capture elements, and discuss the observed abundance distributions in very metal-poor stars with excesses of r-process elements. In §2 we describe the determination of atmospheric parameters for our program stars. The abundance analysis is described in §3, where error estimates in our derived abundances, and comparisons with previous studies, are also discussed. In §4 we discuss the patterns in the abundance ratios of neutron-capture elements produced by r-process nucleosynthesis, based on the results of our analysis. In this same section, the abundance patterns of other elements, including the actinide Th, are considered, as is the suitability of Th-based chronometers for age estimates.
2 Atmospheric Parameters
In order to perform an abundance analysis using model stellar atmospheres, we first need to determine the atmospheric parameters, i.e., the effective temperatures, , the surface gravities, , the microturbulent velocities, , and the metallicities, [Fe/H], for each program star, based on the available photometric data and our high-resolution spectra. These are considered in turn in the following subsections.
2.1 Effective Temperatures
We estimate from the available photometric data, employing the empirical scale obtained by Alonso, Arribas, & Martinez-Roger (1999, 1996) for the color indices, and that by McWilliam et al. (1995) for the index.
The broadband color has been frequently used for the determination of , because this color has been measured for the majority of the metal-poor stars discovered to date. However, the color of a giant star depends not only on , but also on metallicity and the presence, or not, of molecular absorption features, in particular those arising from carbon. Hence, we give preference to the use of . The photometry data used for the determination are provided in Table 1. The data are taken from the Two Micron All Sky Survey Point Source Catalog (2MASS, Skrutskie et al. 1997). The data are taken from the SIMBAD database for bright stars, and from the list of Beers et al. (2003, in preparation) for the fainter stars. Since Alonso, Arribas, & Martinez-Roger (1999) provides a scale for photometric data measured on the TCS system (Alonso, Arribas, & Martinez-Roger, 1998), the 2MASS infrared photometry data are first transformed to those of the TCS system (Alonso, Arribas, & Martinez-Roger, 1994). We found that the difference between the two photometric systems is negligible for our purposes.
Before applying the photometric data to the scale, we first need to correct for the effects of reddening on the measured colors. Schlegel, Finkbeiner, & Davis (1998) constructed a full-sky map of the distribution of Galactic dust based on far-infrared data observed with the Infrared Astronomical Satellite (IRAS) and the Diffuse Infrared Background Experiment (DIRBE) instrument onboard the Cosmic Background Explorer (COBE) satellite. We make use of the reddening estimates they obtained from this map. An exception is the star HD 140283, for which a rather high value of was derived from the Schlegel, Finkbeiner, & Davis (1998) map. It should be kept in mind, however, that this applies to the entire line of sight, which may not be appropriate for bright, nearby stars. For this star, which is only some 50 pc away, we instead adopted a reddening of , as estimated by Ryan et al. (1996). We note that Arce and Goodman (1999) cautioned that the map of Schlegel, Finkbeiner, & Davis (1998) may overestimate the reddening values when the color excess exceeds about 0.15 mag, but the color excesses of our stars are lower than this threshold. The extinction at is evaluated based on the relation . We assume that the extinction at is negligible.
The estimated from and are listed in Table 2. These were derived based on the latest photometric data we could obtain, including the recent 2MASS release. Our abundance analyses were completed before some of these photometric data became available, and we have not made a re-analysis if the difference of the estimated from the updated photometry and that adopted by the analysis is less than 100 K. As a result, the adopted in the present analysis, also given in Table 3, is sometimes slightly different (by 80 K maximum) from that derived based on .
The estimated from for CS 30306–132 is different by more than 400 K from that obtained from . This object turned out to be moderately carbon-rich in our analysis, and this discrepancy should be, at least partially, due to the effect of CH molecular absorption in the B band. Except for this object, the agreement between the two estimates of is fairly good: the average of the difference () for the 21 objects other than CS 30306–132 is 90 K, with a standard deviation of 64 K.
2.2 Metallicities, Microturbulent Velocities, and Surface Gravities
Other parameters (, , [Fe/H]) are determined by the analysis of Fe lines. Only lines with equivalent widths less than 100 mÅ are used in this analysis. We exclude stronger lines because they are severely affected by pressure broadening, which may not be well-estimated by our calculations. The abundance of Fe is evaluated for each Fe I line using Kurucz model atmospheres (Kurucz 1993).
In order to determine the of our program stars, we use a subset of the Fe I lines listed in Table 2 of Paper I. The is set by the value for which iron lines with a variety of strengths yield a consistent iron abundance, changing the values of this parameter with steps of 0.1 km s-1. The estimated for our objects fall within the range 1 to 2.5 km s-1.
We determined the surface gravity, , for each star by demanding that the iron abundance determined from Fe II lines is equal to that derived from Fe I lines. In the first step, abundances are estimated from Fe I and Fe II lines by assuming a value. We repeat the calculation by changing the value until the iron abundances derived from both ionization stages are in agreement. The is then re-determined using the derived value of . The value is then determined again on the basis of the newly obtained , and the process is iterated until convergence.
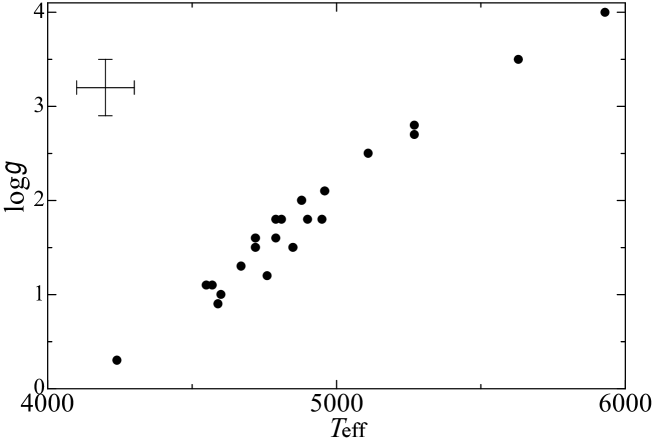
Figure 1 shows the correlation between the estimated and obtained for our program stars. The scatter is small, indicating that no extraordinary star is included in our sample, and that the derived is typical of red giants. Exceptions are the star HD 140283, which we regard as a main-sequence turnoff star, and BS 17583–100, which is regarded as a subgiant.
Our final set of derived atmospheric parameters are summarized in Table 2. We take the Fe I abundance as the indicator of metallicity of each star.
2.3 Comparisons with Previous Studies
The atmospheric parameters adopted in the present work are generally in good agreement with those derived by other recent abundance studies. For example, our model parameters ( = 4570 K, = 1.1, and [Fe/H] ) for the bright, well-studied giant HD 122563 are in good agreement with those reported by Westin et al. (2000) ( = 4500 K, = 1.3, and [Fe/H] ) on the basis of a high S/N spectrum of this star. The parameters of another metal-poor star, HD 115444, derived by the present work ( = 4720 K, = 1.5, and [Fe/H] ) also show good agreement with those obtained for this star by Westin et al. (2000) ( = 4650 K, = 1.5, and [Fe/H] ) . Sneden et al. (2000) derived model parameters for CS 22892–052 ( = 4710 K, = 1.5, and [Fe/H] = –3.1); these are in good agreement with our values ( = 4790 K, = 1.8, and [Fe/H] ). The small discrepancy in the derived [Fe/H] values is primarily due to the higher and adopted by this work (see subsection 3.6). Hill et al. (2002) derived model parameters for CS 31082–001 ( = 4825 K, = 1.5, and [Fe/H]). Our estimates for this object ( = 4790 K, = 1.8, and [Fe/H]) agree quite well with theirs. Giridhar et al. (2001) derived model parameters for CS 22169–035 ( = 4500 K, = 1.0, and [Fe/H]) and BS 16085–050 ( = 4750 K, = 1.0, and [Fe/H]). Our estimates for these objects are = 4670 K, = 1.3, and [Fe/H] for CS 22169–035, and = 4950 K, = 1.8, and [Fe/H] for BS 16085–050. Giridhar et al. (2001) determined the based on the requirement that the Fe abundance derived from Fe I lines be independent of excitation potential and equivalent width. These differences may arise because of the alternate methods used to obtain . Differences in and [Fe/H] propagate from that in .
3 Abundance Analyses and Results
For our quantitative abundance measurements we make use of the analysis program SPTOOL developed by Y. Takeda (private communication), based on Kurucz’s WIDTH6. SPTOOL calculates synthetic spectra and equivalent widths of lines on the basis of the given atmospheric parameters, line data, and chemical composition, under the assumption of LTE. The abundance analyses were made for 33 elements from C to Th, where we have used the solar-system abundances obtained by Grevesse, Noels, & Sauval (1996). The derived abundances for our program stars are listed in Table 3–8.
3.1 The Carbon Isotopes ()
Carbon abundances provide an important tool for understanding not only the evolutionary stage of a given star, but also the nucleosynthesis history of the early Galaxy. However, since the primary purpose of this work is to investigate the abundance patterns of the heavy elements, we have selected stars with rather weak CH G-bands, indicative of low carbon abundances, in order to avoid the difficulties of line contamination due to CH and CN molecular lines. Even in our present sample, however, possible contamination from these molecular lines must be considered. For instance, it is known that contamination from 13CH lines can affect the region surrounding the Th II 4019 Å line (Norris, Ryan, & Beers 1997). To ascertain the possible effects of the molecular lines on our analysis, in this section we obtain estimates of the abundances of the carbon isotopes (12C and 13C).
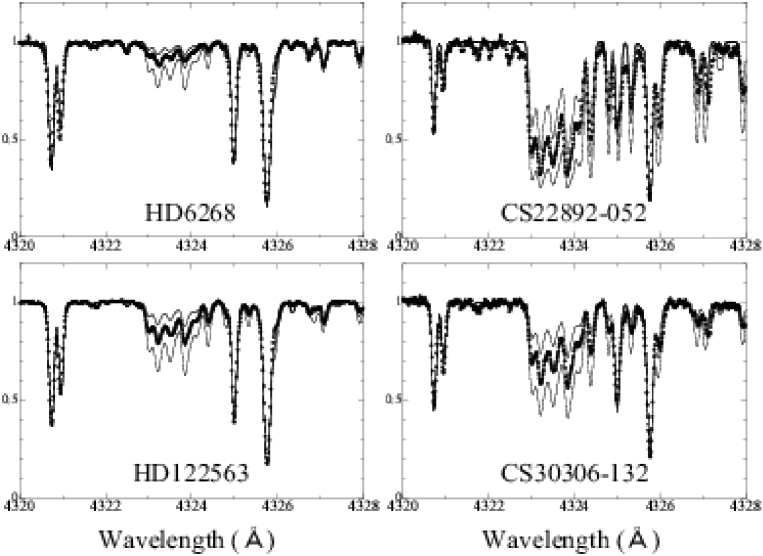
The carbon (12C) abundance is measured using the spectrum synthesis technique for the CH 4323 Å band, adopting the CH line data from Aoki et al. (2002b). We have confirmed that the CH band of the solar spectrum is well-reproduced by spectrum synthesis using this line list, and the Kurucz model atmosphere of the Sun (Kurucz, 1993). Examples of the observed spectra of the CH band for four of our objects are shown in Figure 2. In this figure we also show synthetic spectra for three carbon abundances with differences of 0.3 dex. It is seen that one can certainly specify the best-fit features to better than 0.3 dex. The CH band is too weak in BS 16085–050 and BS 16920–017 to measure their carbon abundances, hence for these two objects we have only estimated upper limits. The derived carbon abundances for our program stars are listed in Tables 3–8.
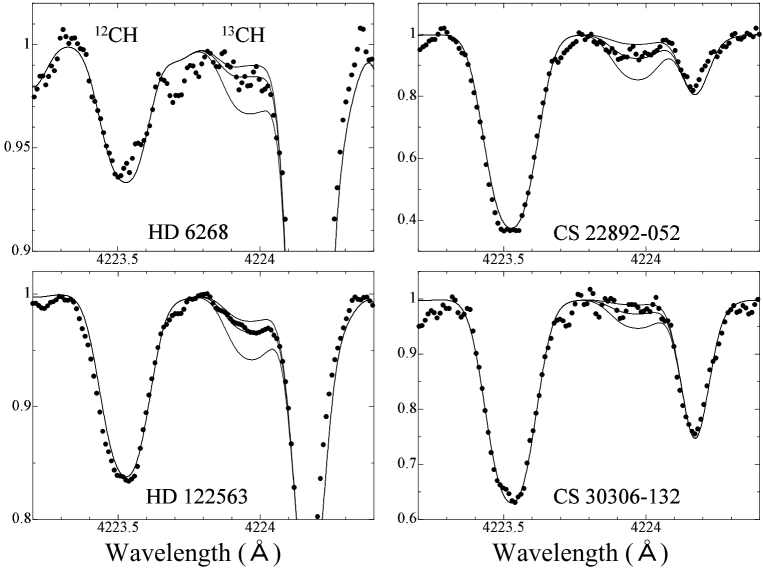
We estimate the carbon isotope ratios (12C/13C) from the CH lines around 4200 Å (Aoki et al., 2001). Examples of the observed spectra for the same four stars discussed above, along with synthetic spectra for three different isotope ratios, are shown in Figure 3. The 13CH line appears redward of the 12CH line in each panel. Note that, in general, the 13CH lines are very weak in our objects. As a result, we are able to estimate the isotope ratios for six of our program stars, but can only obtain upper limits for 13 objects. Since no 12CH line appears in this wavelength region for the other three stars in our sample (CS 22952–015, BS 16085–050, and BS 16920–017), the isotope ratio is not derived for these objects. The results of this exercise are also provided in Tables 3–8. The 12C/13C ratios derived by this analysis fall in the range , which are typical values for red giants.
3.2 The - and Iron-Peak Elements ()
The abundances for elements with are derived with a standard analysis using the equivalent widths reported in Paper I. The transition probabilities of atomic lines employed in this analysis are adopted from Westin et al. (2000), as mentioned in Paper I. The results show the behavior of typical halo stars for most of our objects (e.g., Cayrel et al., 2004), with a few particularly interesting exceptions. Giridhar et al. (2001) found that BS 16085–050 is -enhanced, and that CS 22169–035 is -poor, results which our new data also confirm. We plan to discuss these results in more detail in a future paper (Honda et al., in preparation). The Cr abundances for our sample stars also show higher values, as compared with previous studies (e.g., Cayrel et al., 2004). This is because we use Cr II lines with high excitation potentials. The Zn abundances derived from the two Zn I lines at 4722 and 4810 Å (see Paper I) will be discussed separately, along with the abundances of other iron-peak elements, in forthcoming paper.
3.3 The Neutron-Capture Elements ()
We apply a standard analysis to most lines of the neutron-capture elements using the equivalent widths reported in Paper I. For some strong lines, as well as lines contaminated by other absorption features, a spectral synthesis technique is required. For most lines, the transition probabilities compiled by Sneden et al. (1996) and Westin et al. (2000) are adopted. Line data compiled by McWilliam (1998) are used for the analysis of Ba II. For La II, Eu II and Tb II, we adopt the recent measurements of transition probabilities by Lawler et al. (2001a, b, c), respectively. Studies of atomic data have progressed substantially lately, therefore we can also make use of the newest data for Nd II and Yb II, reported by Den Hartog et al. (2003) and C. Sneden (private communication), respectively.
The effects of hyperfine splitting and isotope shifts are included in the analysis of the Ba II, La II, and Eu II lines. We assume the isotope ratios of the r-process fraction in the Solar System in the analysis of our very metal-poor stars, a convention that has been adopted by others (e.g., Sneden et al., 1996). This assumption is justified by the result of our analysis that the abundance patterns of stars in our sample for which both Ba and Eu are detected are in good agreement with that of the r-process component in the Solar System.
The effect of hyperfine splitting in some La lines is quite significant. In a previous stage of our analysis, older line data were used, and the effect of hyperfine splitting was not included. We find, however, that our re-analysis, which includes this effect and the line data by Lawler et al. (2001a), dramatically reduces the scatter of the derived abundances obtained from individual La lines. We also find that the scatter of Nd abundances derived from individual lines significantly decrease by using the line list recently provided by Den Hartog et al. (2003), as compared with previous line data. Our analysis underscores the importance of obtaining accurate line data, including hyperfine splitting, for use in abundance studies of these heavy elements.
We detect the Yb II 3694.2 Å line in seven objects, and obtain Yb abundances by adopting the line data used by Sneden et al. (1996) without including hyperfine splitting. However, the Yb II 3694.2 Å line may indeed be affected by hyperfine splitting, as pointed out by Aoki et al. (2002a) and Hill et al. (2002), because two of the seven isotopes of this element have odd mass numbers (171Yb and 173Yb). This indicates that the Yb abundances may be over-estimated by a single line approximation. However, from a re-analysis based on new line data (Sneden, private communication), the Yb abundances appear to be better determined.
We detect the elements Sr and Ba, both of which have strong resonance lines in the blue region, for all objects in our sample. Y and Zr are also detected in most objects. In addition to these four elements, we detect Eu in 11 objects. Several elements heavier than Eu, including Th (see next subsection), are detected in seven objects, all of which exhibit overabundances of neutron-capture elements. We discuss the abundance patterns of these stars in more detail in §4.
3.4 Thorium ()
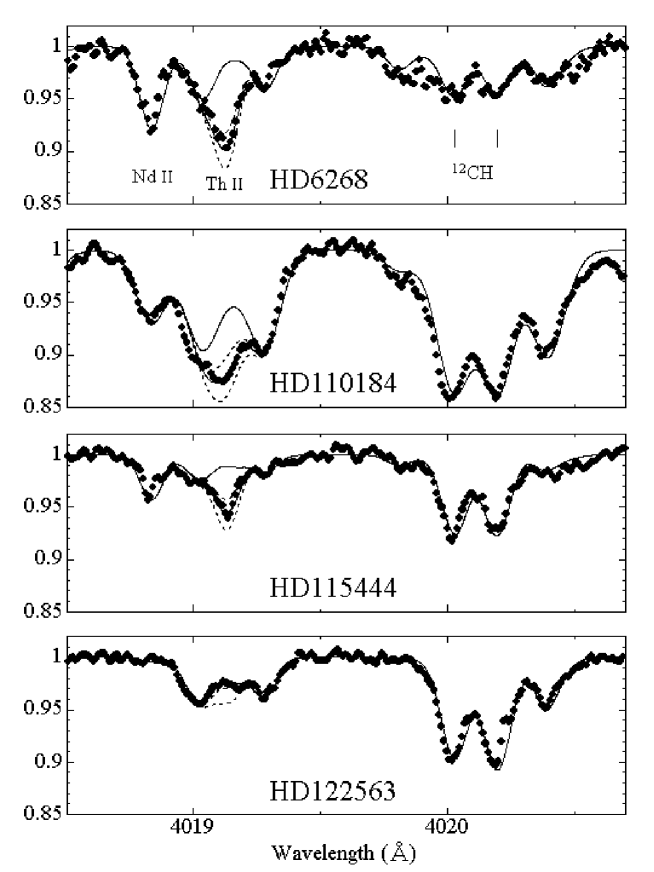
We detect the Th II line (4019.1 Å) in seven program stars, including four stars for which Th abundances have already been reported in the literature. Figures 4 and 5 show the observed spectra of this region in these seven stars, as well as the spectrum of HD 122563, a star with no neutron-capture enhancements, for comparison.
The Th II 4019 Å line is known to potentially suffer from blends with lines of other elements; the impact of the blending of course depends on the relative abundances of the competing species. The Ce II line, for example, is important in stars with super-solar [Ce/Fe] ratios. Sneden et al. (1996) demonstrated the importance of this line for improving their spectral syntheses of the Th II 4019 Å line of CS 22892–052. Norris et al. (1997) pointed out the significant contribution of 13CH lines at this wavelength in 13C-rich objects. Johnson & Bolte (2001) compiled a line list for the analysis of the Th II 4019 Å line, including the above contaminating species, which we employ in the present analysis. Before carrying out our spectral analysis of the Th line, the abundances of Fe, Ni, Nd, Co, and Ce are obtained first, and fixed, so that only the abundance of the Th is altered in the final synthesis step. Note that we adopt the partition function of Th from Morell, Kallander, & Butcher (1992).
In the calculation of the spectra, the contamination of 13CH lines at 4019.00 Å and 4019.17 Å (Johnson & Bolte, 2001) is also included, adopting the carbon isotope ratios derived in subsection 3.1. For CS 31082–001 and CS 30306–132, for which only an upper-limit of the 13C abundance was derived, we use the upper limit as a substitute for the 13C abundance in the calculation. We find that the effect of 13CH is negligible in the spectra of these two stars.
The detection of the Th II 4019 Å line has already been reported by previous authors for CS 22892–052, HD 115444, HD 186478, and CS 30182–001 (Sneden et al., 1996; Westin et al., 2000; Johnson & Bolte, 2001; Cayrel et al., 2001). We have confirmed this detection in the spectra obtained with HDS for these four objects. In addition to these four objects, the Th line is newly detected in three additional stars, HD 6268, HD 110184, and CS 30306–132.
3.5 Upper Limits on U abundances
The radioactive species uranium is a key element for precision estimation of stellar ages from abundance studies such as ours, owing primarily to its relatively “short” half-life of 4.5 Gyrs. Errors in its measurement for a given spectrum lead to smaller errors in the estimated decay age than, for example, measurements of thorium, with its much longer half-life. However, detection of U in stars is quite difficult, because of the weakness of its spectral lines (e.g., U II 3859 Å), and its low present abundance in 12–15 Gyr old stars (note that these ages are sufficiently long that only 10%–15% of the originally produced U will survive). Since we found no evidence of absorption by this element in our spectra, we can only estimate upper limits on its abundance for the seven stars in which Th is detected (Tables 3–8). Though Cayrel et al. (2001) reported the detection of U in their very high S/N () spectrum of CS 31082–001, we could not find U in this object, probably because of the lower quality of our spectrum. The upper limits we are able to derive from our present spectra are rather high, hence no meaningful information is provided for the age estimates of these stars. Higher quality spectra for these very metal-poor stars are obviously required, at least if one hopes to detect U. Even without a detection, improved upper limits to the abundance of U can be used to provide interesting limits on the ages of these stars (see the discussion in Truran et al. 2002).
3.6 Error Estimates
We now estimate the uncertainties in our abundance analysis arising from two sources. The first source is random error, which might be caused, for example, by uncertainties in the adopted gf values and errors in the equivalent width measurements. The second is the systematic error arising from uncertainties in our adopted atmospheric parameters.
The size of the random errors are estimated from the standard deviation (1-) of the abundances derived from individual lines for elements that had three or more lines available to include in the analysis. For elements based only on one or two lines, we employ the mean of the random errors estimated from those elements with multiple lines available. The derived standard deviations are shown in Table 3–8.
Thorium is a particular case, since the Th abundance is determined from the one detected absorption line at 4019 Å using the spectrum synthesis technique. The random error associated with this measurement might be estimated from errors of the fits themselves (e.g., a analysis), but we find that this approach is not useful for our limited quality spectra. In the present analysis, we have chosen to simply estimate the maximum fitting errors “by eye”. In Figures 4 and 5, synthetic spectra for the adopted Th abundance and two other possible Th abundances with 0.1 dex or 0.15 dex differences with respect to our adopted fit are shown (see the figure captions). We estimate the fitting error in the best cases (for HD 6268 and CS 31082–001) to be about 0.10 dex, and for those in other cases to be 0.15 dex. We adopt these fitting errors as estimates of the random error associated with our derived Th abundance. Note that we neglect the error due to the uncertainty of the transition probability, which is very difficult to estimate. In any case, the following discussion pertains primarily to the relative abundances among our sample stars.
Any ambiguity in the estimated atmospheric parameters for a given star can result in an inappropriate choice of model atmospheres for use in the abundance analysis. In order to estimate the typical errors due to this ambiguity, we evaluate the effects of changes in adopted atmospheric parameters for the case of HD 115444. The error in is assumed to be 100 K. This should be a reasonable assumption, because the errors in the photometry data and the reddening correction is 0.03–0.05 mags, which corresponds to an uncertainty of about 50 K (for estimated from ). The difference between the obtained from and that from is also about 100 K on average (see subsection 2.1). Errors in , metallicity, and are assumed to be 0.3 dex, 0.5 dex, and 0.5 km s-1, respectively. Errors in the resulting abundance estimates due to these uncertainties are evaluated by varying the individual parameters.
Changes in the final abundances () caused by the above-noted parameter changes are listed for HD 115444 in Table 9. As found in previous studies, a higher results in higher derived abundances, in general. The effect of the difference in metallicity assumed in the model atmosphere is relatively small. The assumption of a larger results in lower derived abundances. This effect is important in the abundance analysis for Al I, Cr I, Ni I, Sr II, and Ba II, which are based on rather strong lines.
Total systematic errors are derived by the root-sum-square (rss) of the uncertainties contributed by the four parameters ( K, , [Fe/H] = +0.5, and km s-1). The typical error due to the uncertainties of the stellar atmospheric parameters is about 0.14 dex for the neutron-capture elements, with the exception of Sr and Ba, which are influenced primarily by the adopted .
It should be noted that the systematic errors in the abundance analysis for neutron-capture elements are small ( dex), and the abundances are affected by the atmospheric parameters in a similar way. Therefore, the errors in the relative abundances among these elements are smaller than the random errors estimated above.
3.7 Comparisons with Previous Studies
The elemental abundances for several of the stars in our sample have already been studied by previous authors. In this subsection, we compare our results with those of the previous studies. We focus here on the neutron-capture elements of the four stars in which Th was previously detected.
The abundances of many neutron-capture elements in CS 22892–052 have been investigated by Sneden et al. (1996, 2000, 2003). We compare our results with those of the comprehensive study for this object carried out to date (Sneden et al., 2003). Our derived abundances for most elements agree well with their results; Figure 6 shows the difference between our results and theirs. The Th abundance of CS 22892–052 obtained by our present analysis is log(Th) , which is 0.15 dex higher than the Th abundance derived by their latest analyses (). This small difference is probably due to the differences in adopted and (see subsection 2.3 and Table 7). We note that the log(Th/Eu) of this object by our analysis is , which is in good agreement with their result (log(Th/Eu) = ).
The extremely r-process-enhanced, very metal-poor star CS 31082–001 has been studied in detail by Cayrel et al. (2001) and Hill et al. (2002). Our results for the abundances of the neutron-capture elements show good agreement with these previous studies within the stated errors (Figure 6). Although the species Sm and Eu show small differences, this may be due primarily to measurement errors, since our HDS spectrum is not of the same quality as the extremely high S/N spectrum obtained by Hill et al. (2002). CS 31082–001 is known to exhibit unusually strong absorption lines of Th II. The Th abundance derived by our analysis is log(Th) (log(Th/Eu) ). These values agrees very well with those (log(Th) 0.05; log(Th/Eu) ) reported by Hill et al. (2002).
Westin et al. (2000) derived the abundances of a number of neutron-capture elements in HD 115444 from a high-quality spectrum of this star. The abundances of most neutron-capture elements derived by our analysis agree with theirs within the errors. An exception is the case of Tm (Figure 6). Although we investigated a number of possible sources of difficulty, we could not resolve the likely reason for the difference. We note, however, that our present result is based on two lines, which agree well with one another, while the Westin et al. (2000) analysis is based on only a single line.
Our estimate of the Th abundance in HD 115444, log(Th) , appears to be somewhat higher than the value obtained by Westin et al. (2000), log(Th) . The difference between the two measurements is at a similar level as the uncertainties in the analysis, so perhaps this should not be of concern. However, inspection of the synthetic spectra used in this analysis indicates that this discrepancy could arise from differences in the line lists that were adopted. In our synthetic spectrum without the Th II line (Figures 4) the absorption feature at 4019.1 Å, where Th II exists, is considerably weaker than that shown in the synthetic spectrum of Westin et al. (2000) (their Figure 7). In order to identify the reason for this difference, we also compare the synthetic spectra for HD 122563, which was studied by both teams. This star is a very metal-poor giant with similar atmospheric parameters as HD 115444, but exhibits no Th feature. We find that our synthetic spectrum of HD 122563, calculated with the same line list as used for HD 115444, reproduces very well the observed spectrum at 4019.1 Å. On the other hand, the absorption feature at 4019.1 Å in the synthetic spectrum of Westin et al. (2000) for this star is deeper than that in the observed spectrum. Although the discrepancy between the observed and synthetic spectra seems to be similar to the noise level of their observed spectra, the spectral feature at 4019.1 Å was also observed in our very high-quality spectrum of this star. For this reason, we suggest that the discrepancy between the observed and synthetic spectra found in Figure 7 (lower panel) of Westin et al. (2000) is not due to random errors in the observed spectrum, but rather arises from an overestimate of the absorption at 4019.1 Å in their calculation. If the absorption at this wavelength is also overestimated for HD 115444, the contribution of the Th II is underestimated. This may explain the difference of 0.2 dex in the Th abundances between the results of Westin et al. (2000) and our present analysis.
Johnson & Bolte (2001) derived the elemental abundances of HD 115444 and HD 186478. The Fe abundances derived by these authors are lower by 0.3 dex and 0.1 dex than ours for HD 115444 and HD 186478, respectively (Figure 6). These differences are likely due to differences in the atmospheric parameters adopted in the two analyses. Their and for these objects are lower than ours by about 200 K and 0.8 dex, respectively. The Th abundances derived by Johnson & Bolte (2001) for HD 115444 and HD 186478 are log(Th) and log(Th) , respectively. These values are lower by 0.39 dex and 0.41 dex than our results, respectively. These differences are well explained by the differences in the adopted and . Note that differences of this size do not affect the relative abundances of neutron-capture elements very significantly. For example, the differences in the value of log(Th/Eu) become smaller, 0.21 and 0.19 for HD 115444 and HD 186478, respectively, roughly the same size as the value of the estimated random errors.
4 Discussion
The present analysis has shown that our objects indeed possess very low metallicities ( [Fe/H] ). The iron abundances derived by the present analysis are similar to the values which were estimated by the previous studies from lower dispersion spectroscopy (Beers et al. 1992; Bonifacio et al. 2000; Allende-Prieto et al. 2000). One exception is the star CS 22952–015, whose metallicity was estimated to be [Fe/H] by Beers et al. (1992), while our estimate is rather higher, [Fe/H] . Another is CS 30306–132, whose metallicity was estimated to be [Fe/H] from lower-dispersion spectroscopy by Beers et al. (2003, in preparation), while our result is [Fe/H]. This discrepancy may be due to the fact that this star has strong CH molecular bands.
The metallicity range of the stars in our sample should be kept in mind, as it is known that a large scatter in the abundance ratios in many neutron-capture elements appears when the metallicity drops to [Fe/H] = –2.5 or below (e.g., McWilliam et al., 1995). In this section, we discuss the relative abundances of the neutron-capture elements, the dispersion of the observed abundance ratios, and the origin of these elements (subsection 4.1). We discuss in detail the abundance pattern of neutron-capture elements for the seven stars in our sample for which Th is detected, and the impact of our new results on the cosmochronology technique based on Th (subsection 4.2). The abundances of the - and iron-peak elements are discussed only for comparison purposes. Details on the behavior of these elements will be presented separately in a future paper in this series (Honda et al., in preparation).
4.1 Relative Abundances of the Neutron-Capture Elements
4.1.1 The Heavy Neutron-Capture Elements ()
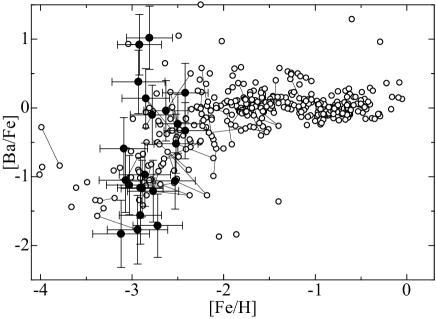
Figure 7 shows the values of [Ba/Fe] as a function of [Fe/H] for all of the stars in our sample (filled circles with error bars), as well as the results reported by previous authors for comparison (open circles). Ba abundances have been reported for stars with lower metallicity than the abundances of other neutron-capture elements such as Eu. This is because Ba has strong Ba II resonance lines (4554 and 4934 Å), which remain detectable even as the overall level of metallicity decreases. Previous studies have shown that [Ba/Fe] drops below the solar ratio, on average (e.g., Ryan et al. 1996; McWilliam 1998), at the lowest metallicities. This trend is thought to arise because of a change in the primary nucleosynthesis sources for Ba between stars with [Fe/H] and those with [Fe/H] . Ba in the more metal-rich stars is believed to originate primarily from the (main) s-process in low-mass or intermediate-mass stars (1-8 ) with a comparatively small contribution by the r-process. The production of Ba at the lowest metallicities, however, is most likely due to the r-process alone, occurring in Type II supernova explosions of massive and hence rapidly-evolving stars. The contribution of the s-process to Ba in the early Galaxy is small, because the time-scale for the evolution of lower mass stars is long, and the ejecta from these stars contribute only to stars which formed somewhat later, with [Fe/H] (e.g., Truran et al., 2002, and references therein).
Our results, shown in Figure 7, confirm the existence of an extremely large scatter (a factor of 1000 over the entire range) in the Ba abundances of the most metal-poor stars, even larger than reported in previous studies. For instance, the standard deviation of the [Ba/Fe] values of our sample is 0.82 dex, while that found by McWilliam (1998) for 24 objects with [Fe/H] is 0.59 dex. One clear reason for this larger dispersion is that the detection limit for Ba lines in our work is lower than in previous programs, thanks to the high quality of the Subaru/HDS spectra. The other reason is likely due to our selection of candidate neutron-capture-enhanced stars, as mentioned in Paper I. In spite of this selection bias, the large dispersion in Ba abundances that exists in the metallicity range of [Fe/H] , and the possibly decreased scatter at lower iron abundances, provides an important clue to the sites and mechanisms of astrophysical neutron-capture processes (Wasserburg & Qian, 2000).
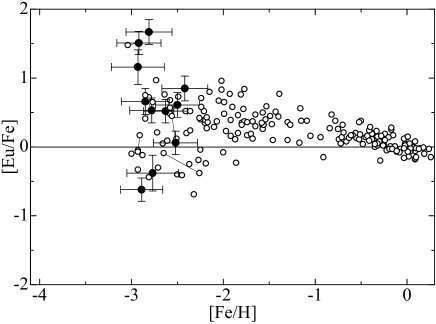
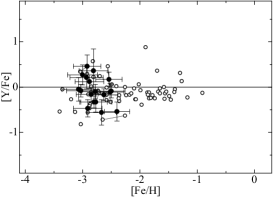
Roughly 95% of the Eu in solar-system material is believed to be produced by the r-process (e.g., Arlandini et al., 1999; Burris et al., 2000), hence this element is particularly suitable for investigating the characteristics of the r-process in the early Galaxy. However, measurements of Eu abundances in extremely metal-poor stars ([Fe/H] ) are still quite limited, because there is no strong Eu line, unlike those of Sr and Ba. We have detected Eu in 11 objects in our sample; the derived [Eu/Fe] ratios for our sample are shown in Figure 8 as a function of [Fe/H] (filled circles), along with the results obtained by previous studies (open circles). Our results show a large scatter also in [Eu/Fe] in very metal-poor stars, as has been reported by previous authors (e.g., McWilliam et al., 1995; Burris et al., 2000).
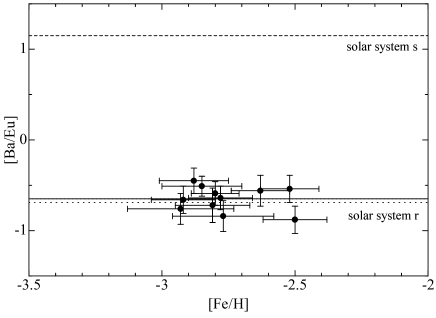
The ratio [Ba/Eu] is useful for distinguishing the contributions of the r- and s-processes, because the expected ratios from the two processes are quite different. Figure 9 shows [Ba/Eu] as a function of [Fe/H] for the 11 stars in our sample for which Eu has been detected. The dotted line indicates the value of [Ba/Eu] of the solar-system r-process component ([Ba/Eu] , Arlandini et al. 1999), while the dashed line indicates that of the s-process component ([Ba/Eu] , Arlandini et al. 1999). The [Ba/Eu] ratios exhibited by our stars are clearly associated with the r-process, rather than the s-process.
Similar results have been reported by previous authors. McWilliam (1998) found that the mean of the [Ba/Eu] ratios for 10 stars with [Fe/H] –2.4 is –0.69, consistent with the value expected from pure r-process nucleosynthesis within the measurement uncertainties. Here we find that the ratio of [Ba/Eu] matches that of the solar-system r-process component for many stars at low metallicity. These results suggest that Ba, as well as Eu, is primarily produced by the r-process during the early history of the Galaxy, and that Ba can be used as a powerful tool to investigate the behavior of r-process elements in the early Galaxy, as it remains detectable in stars of metallicities that are far lower than those in which Eu is detectable.333A number of stars with large excesses of s-process elements are known to exist in this metallicity range (e.g, Aoki et al., 2002b). The chemical compositions of these stars are interpreted as resulting from s-process nucleosynthesis in intermediate-mass, evolved stars followed by mass-transfer across the binary system. These stars do not exist in our sample, presumably because carbon-enhanced metal-poor stars have been specifically excluded in our sample selection (see Paper I).. Though most of the stars shown in Figure 8 exhibit [Eu/Fe] , we expect that the [Eu/Fe] values of the stars with low Ba abundances are lower than zero, and in reality will, once detected, exhibit a similarly large dispersion as seen in [Ba/Fe]. This prediction should be confirmed by studies of Eu lines using higher quality spectra for objects with [Fe/H] (e.g., Ishimaru et al. 2004).
Large levels of scatter are also found in the abundance ratios of almost all neutron-capture elements with Z 56. Figure 10 shows the average of the elemental abundances relative to iron [X/Fe], and the standard deviation as a measure of the scatter in the abundances, as a function of atomic number. The number of objects in which the species is detected depends upon the element: i.e., neutron-capture elements heavier than Ba are detected only in stars with excesses of neutron-capture elements. The dispersion of the abundances for elements which are detected in less than 12 objects is shown by the thin bars. Even though this limitation will make the dispersion of the abundances of heavy neutron-capture elements () smaller, the dispersion of the abundances of neutron-capture elements is much larger than found for the - and iron-peak elements.
The scatter in the abundances of heavy neutron-capture elements relative to iron found in these very metal-poor stars means that the nucleosynthesis site of iron-peak elements and the r-process elements are quite different, and that the mixing of the yields from the first supernovae into the ISM is incomplete in the early stages of the Galaxy. The large scatter of r-process elements appearing at [Fe/H] should provide a constraint on the dominant site of r-process nucleosynthesis (e.g., Ishimaru & Wanajo, 1999; Tsujimoto, Shigeyama, & Yoshii, 2000).
We have confirmed that CS 22892–052 and CS 31082–001 are extremely r-process-rich objects, and that HD 6268, HD 115444 and HD 186478 are moderately r-process-rich objects. In addition, we have found two new r-process-enhanced objects, CS 22183–031 and CS 30306-132. CS 22183–031 exhibits a large excess of r-process elements (e.g., [Eu/Fe] ). Unfortunately, we could not detect many lines because of the relatively low S/N in our spectrum of CS 22183-031. We are able to detect numerous lines in CS 30306-132, and found that this object has a moderate enhancement of r-process elements ([Eu/Fe] +0.8). In §4.2 we describe this object in detail.
4.1.2 The Light Neutron-Capture Elements ()
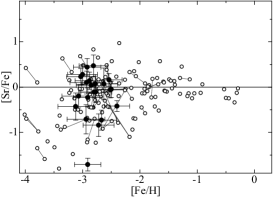
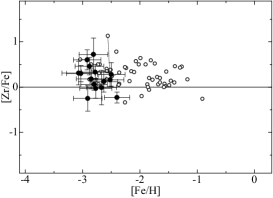
Figure 11 shows the abundance ratios of [Sr/Fe], [Y/Fe], and [Zr/Fe] as a function of [Fe/H]. The [Sr/Fe] ratios in our program stars are distributed over a very wide range, from to , confirming the large dispersions in this ratio found by previous studies (e.g., McWilliam et al., 1995; Burris et al., 2000). The stars in our sample appear to exhibit a rather higher mean [Sr/Fe] ratio than those of previous studies, but this is likely because of the sample selection, as discussed in the previous subsection. The scatter that appears in the [Y/Fe] and [Zr/Fe] ratios is smaller than that in [Sr/Fe]. However, Y and Zr do not have such strong spectral lines as the Sr II resonance lines, hence these two elements are not detected in several objects in our sample. This may account for their smaller dispersion; clearly, this should be investigated by obtaining higher-quality spectra of stars that presently have only upper limits on their Y and Zr abundances.
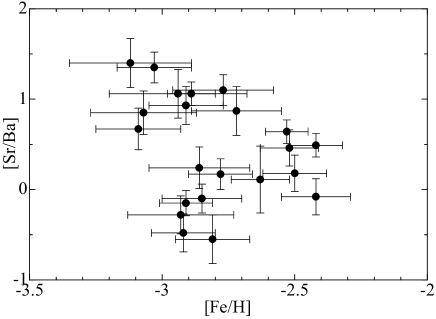
In order to investigate the reason of the large dispersion in the Sr abundances, in Figure 12 we plot [Sr/Ba] as a function of [Fe/H]. As discussed previously by McWilliam (1998), although the dispersion in [Sr/Ba] at very low metallicity is rather smaller than that of [Sr/Fe], the range is still almost 2 dex. This stands in stark contrast to the range of [Ba/Eu] exhibited by the stars in our sample, all of which have quite similar values. This result suggests that either (a) the process that contributed significant amounts of Sr in these metal-deficient stars did not yield similar amounts of Ba, or (b) the process that produced Ba at very low metallicity yielded a variety of Sr/Ba ratios.
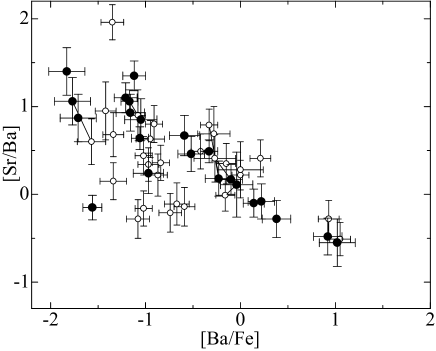
To investigate the correlation between Sr and Ba, Figure 13 shows the ratio [Sr/Ba] for the stars in our sample as a function of [Ba/Fe]. Such a diagram was was also shown, for a different set of stars, by Truran et al. (2002) and Sneden, Preston, & Cowan (2003). The sample of Sneden et al. (2003) includes s-process-rich stars, in which Pb is detected. By way of contrast, we have excluded stars known to exhibit large excesses of s-process elements and stars with [Fe/H] from this figure, in order to avoid possible contamination by s-process nucleosynthesis. (A possible contribution of the so-called weak s-process is discussed below.) One clear result found in this figure is that the dispersion in [Sr/Ba] decreases with increasing Ba abundance. This correlation is much clearer in our figure than in Figure 10 of Truran et al. (2002), presumably because their sample includes several rather metal-rich objects, which could well be affected by the contribution of s-process nucleosynthesis. Moreover, our new sample of stars has added a number of objects at the high end of the [Ba/Fe] range, hence this contributes to making the correlation in this range clearer.
Figure 14 shows the abundances of Sr and Ba for very metal-poor stars. For the stars in common between our study and those of others, we have adopted the abundances derived in the present study. As a result, a total of 46 stars are shown in this figure. It is obvious that the dispersion in the Sr abundance decreases with increasing Ba abundance. To demonstrate this quantitatively, we divided the sample into three groups on the Ba abundance ((Ba): 16 stars, (Ba): 19 stars, and (Ba): 11 stars), then measured the standard deviation of the Sr abundances for each group. The results are 0.25 dex, 0.38 dex, and 0.71 dex, respectively. Clearly, the dispersion increases with decreasing Ba abundances. While the standard deviation in the range of (Ba) is of a similar level as the typical observational errors, in the range of (Ba) the dispersion is significantly larger than the measurement errors.
We also plot in Figure 14 the values of Sr and Ba in solar-system material (Grevesse, Noels, & Sauval 1996, the dotted circle), as well as the solar-system r-process component (the filled square). Unfortunately, estimation of the s-process component for Sr (knowledge of which is required in order to obtain the r-process residual value) is quite uncertain, because of possible contamination from the so-called weak component of the s-process (Käppeler, Beer, & Wisshak, 1989). For the r-process component of Sr, we adopted the average of the values derived by Käppeler, Beer, & Wisshak (1989) and by Arlandini et al. (1999, the estimate from their classical model), and show the difference by an error bar.
A simple model can be constructed for the enrichment of Sr and Ba, assuming initial abundances of Sr and Ba ((Sr) and (Ba)) and a constant Sr/Ba ratio ((Sr/Ba)r) in the yields of the r-process, i.e.,
(Sr)=(Sr)(Sr/Ba)
(Ba)=(Ba) .
The two solid lines in Figure 14 show cases for different initial Sr abundances: (Sr) and 5, respectively. (Ba) and (Sr/Ba) is assumed for both cases. A glance at this figure shows that the observational data fill the range between the two lines. Hence, the distribution of the observed Sr and Ba abundances are quite naturally explained by the simple assumptions of a large dispersion of Sr abundances at (Ba) and enrichment of Ba and Sr with a constant Sr/Ba ratio. Moreover, if we extend the line representing the enrichment of Sr and Ba, the Sr and Ba abundance of the r-process component in solar-system material is also explained.
A similar scenario for Sr and Ba enrichment has already been proposed by previous studies (e.g., Sneden et al., 2000; Truran et al., 2002). In particular, Truran et al. (2002) selected several metal-deficient stars with high and low Ba abundances, and concluded that Ba-poor stars show high Sr/Ba ratios, while the Sr/Ba ratios of Ba-rich stars are similar to that of the r-process component in the Solar System. These authors suggested the existence of two processes (sites) that produce Sr. Our interpretation for the Sr and Ba abundance distributions is essentially the same as theirs. However, the enrichment of Sr and Ba is seen much more clearly in the present study, as the result of adding new measurements and excluding stars of higher metallicity.
The enrichment of Ba in the metallicity range around [Fe/H] is sometimes referred to as the main r-process, which produces heavy (A 130) neutron-capture elements (Wasserburg & Qian, 2000). Our interpretation for the variation of the Sr and Ba abundances results in the Sr/Ba ratio produced by this process, (Sr/Ba)r, to be about 1.5. The absence of stars with Sr/Ba in Figure 14 means that (Sr/Ba)r is not significantly smaller than unity. This value is much higher than the Sr/Ba predicted by recent models of r-process nucleosynthesis (e.g., : Otsuki, Mathews, & Kajino 2003). The value derived by these models should be, however, a lower limit of the Sr/Ba ratio produced by a single site, as these models deal with only one condition which can produce heavy neutron-capture elements like Ba. The yields in a real r-process site, such as a Type II supernova explosion, should be an integration of the results of a variety of conditions including the cases with low neutron-to-seed ratios, and produce light neutron-capture elements like Sr. If our interpretation for the correlation between Sr and Ba abundances is correct, this places a quite strong constraint on the Sr/Ba ratio produced by the main r-process.
In contrast, the nucleosynthesis process that is responsible for the production of light neutron-capture elements (e.g., Sr) without producing the heavier elements (e.g., Ba) is as yet unclear. One possibility is the existence of an independent nucleosynthesis process which dominantly produces lighter neutron-capture elements, probably prior to the ’main’ r-process which provides heavier ones (e.g., Truran et al. 2002). For instance, the above observational results are qualitatively explained by the assumption that different mass ranges of supernovae are responsible for the light and heavy neutron-capture elements (e.g., Qian & Wasserburg 2000). Two different explosion mechanisms, i.e., prompt and delayed explosion, are proposed for low-mass and high-mass supernovae, respectively, and numerical simulations of r-process nucleosynthesis have been made (e.g., Hillebrandt, Nomoto, & Wolff, 1984; Woosley et al., 1994; Meyer et al., 1992; Otsuki et al., 2000; Sumiyoshi et al., 2001; Wanajo et al., 2003). Possible r-process nucleosynthesis in neutron-star mergers may also play a role in the enrichment of the light neutron-capture elements (e.g., Rosswog et al., 1999; Freiburghaus, Rosswog, & Thielemann, 1999).
On the other hand, another explanation by r-process nucleosynthesis in a single site may be possible if incomplete mixing of supernova ejecta with interstellar matter is assumed. For instance, some neutrino-heated wind models predict significantly large overproduction of light neutron-capture elements in the early phase ( second) of the explosion prior to the r-process which produces the heavier elements (e.g., Woosley et al. 1994). Cameron (2001) suggested that r-process nucleosynthesis may take place in the jets associated with gamma-ray bursts, which would be a possible mechanism for production of an inhomogeneous r-process in a single event. Stars with high Sr and low Ba abundances may form from the interstellar medium polluted by the ejecta enriched in light neutron-capture elements, if the ejecta is not well mixed with the matter ejected in the later phase of the r-process.
An alternative explanation for the enrichment of Sr without Ba may be the so-called weak s-process, which proposes a neutron-capture process proposed to occur in core He-burning massive stars (e.g., Hoffman, Woosley & Weaver, 2001). This process is expected to be unimportant in metal-deficient stars, because 22Ne is believed to be the neutron source. However, if this process can operate, it may contribute to light neutron-capture elements in metal-deficient stars.
Further systematic studies of stars with low Ba abundances, especially of the abundance patterns for elements around Sr, will provide important information to constrain the nucleosynthesis process responsible for their production, and their ejection dynamics as well.
4.2 Distribution of Neutron-Capture Elements
One important discovery in recent abundance studies of the neutron-capture elements in metal-deficient stars is that the abundance pattern of heavy neutron-capture elements are very similar, essentially an exact match, within observational errors, to that of the r-process component in the Solar System. To examine details of r-process nucleosynthesis at low metallicity, it is essential to detect as many elements as possible over the entire range of atomic numbers (Z = 31 92). Such a study is possible for very metal-poor stars with overabundances of neutron-capture elements ([X/Fe] +0.5). In such stars the absorption lines of neutron-capture elements are relatively strong, and the blending from lines of other lighter elements is comparatively weak, due to the overall low metallicity of the star.
We examine the abundance pattern of neutron-capture elements in detail for the seven very metal-poor stars in which the Th absorption line (4019 Å) was detected (see Figures 4 and 5). All of these stars exhibit enhancements of their neutron-capture elements. Among them, CS 31082–001 and CS 22892–052, which have already been studied by Hill et al. (2002) and Sneden et al. (2003), are the most extreme cases, showing large enhancements of the neutron-capture elements (e.g., [Eu/Fe]=+1.7 and +1.5, respectively). The star HD 110184 does not exhibit a remarkable enhancement of neutron-capture elements relative to iron, but our high S/N spectrum makes it possible to study Th and other r-process elements in this star as well.
4.2.1 Abundance Pattern for Elements with 56 Z 70
Abundance studies of r-process-enhanced, metal-poor stars to date have shown that the abundance patterns of the neutron-capture elements with 56 Z 70 agree very well with that of the solar-system r-process pattern (e.g., Sneden et al. 2003). In order to investigate this phenomenon further, using our extended sample, we now compare the scaled abundance patterns of our stars with the abundance distributions in solar-system material.
For each of the seven stars with detectable r-process elements, we use the solar-system r-process abundance pattern as a template to compare the heavy-element abundances of the stars on a common scale (Figure 15). We scale the elemental abundances of our objects to match the solar-system abundances for elements between Ba and Yb (). The logarithmic values of the scaling factor () for individual stars are listed in the columns labeled ’s.s. r-process’ in Table 10. For this analysis, we adopt the r-process fraction in the Solar System given by Burris et al. (2000). The total solar-system abundances were taken from Grevesse, Noels, & Sauval (1996). Figure 15 shows that the abundance patterns of the elements with 56 70 for these very metal-poor stars agree very well with that of the solar-system r-process component.
We also attempted to compare the abundances of our metal-poor stars with the solar-system s-process distribution in the same manner. Take CS 30306–132, for example (Figure 16). As expected from the [Ba/Eu] ratios of these objects, the agreement between the abundance patterns of our objects and the s-process pattern is poor. We also compare the abundances of our subset of metal-poor stars with r-process enhancements with the total elemental abundance distribution of the Solar System (Figure 16). The logarithmic values of the scale factor are given in the column labeled ’s.s. total’ in Table 10. The agreement is clearly better than that in the case for the abundance pattern of the s-process component alone. This is because the r-process fraction dominates in the total solar-system abundances of elements with . The scaled abundances of Ba, La, and Ce in our stars, shown in Figures 15, are less than the solar-system total abundances of these elements. Presumably, this arises because the s-process contribution to the abundances of Ba, La, and Ce in the Solar System is larger than for other elements like Eu (Burris et al. 2000). From these comparisons, we conclude that the abundance patterns of heavy neutron-capture elements in our objects agree best with the r-process component in the Solar System.
In Table 10 we also provide the standard deviation (1-) of the difference between the scaled abundances of each star and the total solar-system abundances, as well as its r-process component. These standard deviations can be taken as indicators of the level of agreement between the abundance pattern of each star and the pattern of the solar-system abundances. The average of the observational errors for elements with () are also provided in Table 8. Comparisons of the observed 1- values with indicates good agreement between the scaled abundance pattern of our objects with that of the solar-system r-process component. We note that the 1- value for HD 110184 is slightly larger than those for other objects, and than its . One reason for this result may be that the r-process enhancement of this star (e.g., [Eu/Fe] = 0.06) is small, and a small contribution by the s-process may affect the abundance pattern of this star.
The excellent agreement between the abundance pattern of the heavy neutron-capture elements in very metal-deficient stars and that of the solar-system r-process component has already been reported for several very metal-poor stars by previous studies (e.g., Sneden et al., 1996, 2000; Westin et al., 2000; Johnson & Bolte, 2001; Hill et al., 2002; Cowan et al., 2002; Sneden et al., 2003), and is sometimes referred to as the ’universality’ of r-process nucleosynthesis. The apparent universality is ascribed to the fact that the predicted abundance patterns of elements with appear to be rather insensitive to variations in the parameters of the current r-process models (e.g., the entropy/baryon ratio). The nucleosynthesis paths in this mass range (i.e., 150) are quite similar among the r-process models that are used to predict the production of the actinide nuclei, even though the abundances of the actinides show an apparent variation in some stars (e.g., Wanajo et al., 2002; Otsuki, Mathews & Kajino, 2003).
4.2.2 The Radioactive Element Th and the Impact on Cosmochronometry
As mentioned in §1, the actinide Th is heavier than the elements at the third abundance peak produced by the r-process (Os, Ir, Pb, etc.), and is a key element for the understanding of this nucleosynthesis process. Application of the abundances of this element to cosmochronometry has also been discussed extensively in recent studies of very metal-deficient stars.
The abundances of Th measured for the seven stars in our sample are presented in Figure 15. For the Th abundance, the solid line here shows the initial abundance of this radioactive element, as estimated by Cowan et al. (1999), rather than the present Th abundance, which is shown by the dashed line in this figure. Since these very metal-poor stars are believed to be born in the early Galaxy, the Th abundances of our sample are expected to be lower than the value shown by the dashed line, if we assume that the abundance patterns of heavy neutron-capture elements, including Th, produced by the r-process, is indeed universal. This is in fact found for the stars HD 110184, HD 115444, HD 186478, and CS 22892–052. However, the Th abundances of the other three stars are higher than would be expected from this logic.
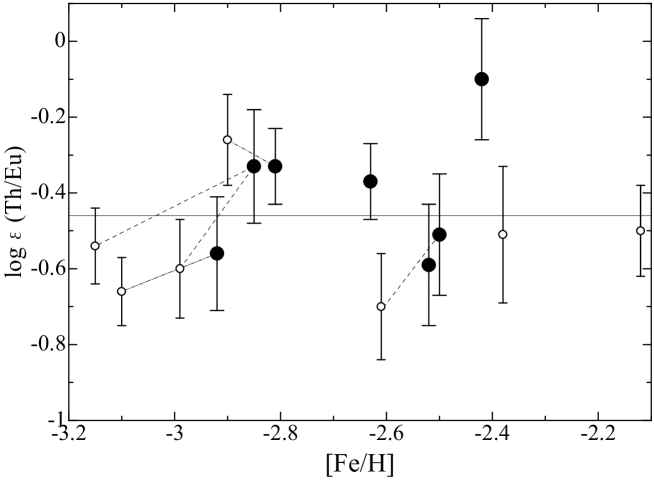
In order to investigate this issue more clearly, we show the abundance ratios between Th and the stable r-process element Eu ((Th/Eu) = (Th) (Eu)) in Figure 17, where we plot our results, and the results of previous studies (Westin et al., 2000; Sneden et al., 2000; Johnson & Bolte, 2001; Hill et al., 2002; Cowan et al., 2002). The average and standard deviation of the values of our seven stars are dex and 0.17 dex, respectively. The standard deviation is as large as, or slightly larger than, the typical observation errors, which were estimated from the root-sum-square of the random errors of Th and Eu abundances (error bars in Figure 17).
We have found that CS 31082–001 and CS 30306–132 have clearly higher Th/Eu ratios than the well studied star CS 22892–052 (Figure 17). In Figure 5, the observed spectra around the Th II line are shown. The Nd II 4018.6 Å line exists blueward of the Th II line. Since the atmospheric parameters in these giants are quite similar, the ratio of the line strengths between Th II and Nd II directly reflects the Th/Nd abundance ratio. In CS 22892–052, the Th II line is as strong as the Nd II line. The ratios of the line strengths in HD 6268 and HD 115444 are rather similar to that of CS 22892–052. In contrast, in CS 31082–001 the Th II line is significantly stronger than the Nd II line. In addition, in CS 30306–132, the Th II is clearly detected, while there is no evidence for the presence of the Nd II line. These results indicate that the Th/Nd ratios in CS 31082–001 and CS 30306–132 are significantly higher than in the other three stars. As discussed in detail in subsection 4.2.1, Nd in these objects is regarded as a product of the r-process, and can be taken as representative of the stable r-process elements. Therefore, the above inspection suggests the existence of some dispersion in the abundance ratios between Th and the other neutron-capture elements ().
A similar result was already reported for CS 31082–001 by Cayrel et al. (2001) and Hill et al. (2002), as mentioned in §1. Our present study shows that this object is not unique, but that there is at least one other similar object that shares the same “actinide boost,” CS 30306–132, though its enhancement factor of r-process elements is much smaller than that of CS 31082–001. We might expect that, in the near future, as additional r-process-enhanced metal-poor stars are identified, such behaviors will be seen in additional stars.
If the conventional Th/Eu chronometer (Cowan et al, 1999) is simply applied to the Th/Eu abundance ratios, the ages of a few stars, those exhibiting actinide boosts, are estimated to be shorter than that of the present age of the Sun. In particular, the derived ages of CS 31082–001 and CS 30306–132 are as low as zero. Even with a level of uncertainty of as much as 5 Gyr in the age estimation, the ages derived from the above method appear unrealistic. We note that the average of the Th/Eu ratios of our seven stars ((Th/Eu) ) is quite similar to the value of solar-system material ((Th/Eu) (Grevesse, Noels, & Sauval, 1996)). That is, the average of the ages derived from application of the Th/Eu chronometer is similar to the age of the Sun, and hence is also unrealistic.
The observations seem to suggest that some very metal-poor stars had higher initial Th abundances than expected from the solar-system r-process abundance pattern. In other words, even though the abundance pattern of the elements with agrees with the abundance pattern of the solar system r-process component, the initial abundance ratios of the heaviest elements, like Th, to the lighter ones (e.g., Eu) are not necessarily the same as those expected from the r-process component in the Solar System. In order to apply the abundance ratios between Th and other stable elements as chronometers, estimates of the initial abundance ratios for these elements are essential, hence a deeper understanding of the r-process nucleosynthesis for wider mass ranges is necessary.
One possible alternative cosmochronometer is the U/Th ratio, recently applied by Cayrel et al. (2001) and Hill et al. (2002) for the extremely r-process-enhanced, metal-poor star CS 31082–001. Since 232Th and 238U are neighboring actinide nuclei, their production rate is expected to be quite similar. This justifies the assumption that the initial abundance ratio is the same as in the initial solar-system abundance ratio, as shown by recent theoretical calculations (e.g., Wanajo et al., 2002; Otsuki, Mathews & Kajino, 2003). At present, U/Th is expected to be the best available chronometer.
We would like to point out that, even though we conclude from our analysis that there exists a real scatter in the abundance ratios between Th and other neutron-capture elements with , the level of this scatter is at most a factor of three, much smaller than the ratios between light () and heavy () neutron capture elements, which are as large as a factor of 10 (see Figure 15). Recent models of the r-process showed that the abundance ratios between the elements at the second and the third r-process peaks are quite sensitive to the parameters in the calculation (e.g., Hoffman, Woosley & Qian, 1997; Otsuki et al., 2000; Wanajo et al., 2002; Otsuki, Mathews & Kajino, 2003). The small dispersion of Th/Eu ratios found in our stars, as well as in other previously studied stars, should be an important constraint on modeling the r-process, as we are beginning to place limits on the possible range over within which the initial production ratio can fall. In order to derive a clear conclusion, it is required to systematically study the Th abundances for a larger sample of very metal-poor stars, based on high S/N spectra, which would enable one to detect the Th line even in stars with lower Th abundances.
5 Summary
We have conducted detailed abundance analyses for 22 very metal-poor stars based on high-resolution, high S/N near-UV-blue spectra obtained with Subaru/HDS. Our sample of stars covers the metallicity range [Fe/H] . This paper reports the results of abundance analyses concentrating in particular the r-process elements. The main conclusions of this study are as follows:
(1) We have identified a new highly r-process element-enhanced, metal-poor star, CS 22183–031, a giant with [Fe/H] = and [Eu/Fe] = +1.2. The lower S/N of its spectrum, however, prevented Th from being clearly detected. We also identified a new, moderately r-process-enhanced, metal-poor star, CS 30306–132, a giant with [Fe/H] = and [Eu/Fe] = +0.85, in which Th was detected.
(2) We have confirmed the large star-to-star scatter in the abundances of neutron-capture elements relative to iron observed for stars with [Fe/H] . The abundance pattern of the heavy neutron-capture elements () in seven r-process-enhanced, metal-poor stars are, however, quite similar to that of the r-process component in solar-system material. The Ba to Eu ratios in 11 metal-poor stars, including these seven objects, are nearly equal to that of the solar system r-process component. These results prove that heavy neutron-capture elements in very metal-poor stars are primarily synthesized by the r-process.
(3) We have investigated the correlation between Sr and Ba abundances in our sample, and in other very metal-poor stars ([Fe/H] ) studied by previous authors, and conclude that the dispersion of the Sr abundances clearly decreases with increasing Ba abundance. This trend suggests the existence of two nucleosynthesis processes, one of which produces Sr with very small production of Ba, and the other which produces Sr and Ba with Sr/Ba . The so-called main r-process might be associated with the latter process, while that responsible for the former is yet unidentified.
(4) The Th/Eu abundance ratios (log(Th/Eu)) measured for the seven r-process-enhanced stars range from to . We have confirmed the high Th/Eu ratio found for the extremely r-process-enhanced star CS 31082–001 (Hill et al., 2002); the newly discovered moderately r-process-enhanced star CS 30306-132 exhibits a similar (high) Th/Eu ratio as CS 31082–001. Since these very metal-poor stars are believed to be formed in the early Galaxy, this result means that a small dispersion appears in the abundance ratios between Th and rare-earth elements, such as Eu, in very metal-poor stars. In order to apply the Th/Eu ratios to estimates of stellar ages, further understanding of Th production by r-process nucleosynthesis is required.
Clearly, important information on the nature of r-process nucleosynthesis is being obtained from abundance studies of very metal-poor stars, especially for those with enhancements of r-process elements. Further observational studies of these objects, based on spectra of even higher quality, will provide strong constraints on element production via r-process nucleosynthesis in the early Galaxy.
In this study we have discovered a new, moderately r-process-enhanced, metal-poor star, CS 30306–132, which has a similar (high) Th/Eu ratio to CS 31082–001. We have also identified a new highly r-process element-enhanced, metal-poor star, CS 22183–031, a giant with [Fe/H] = and [Eu/Fe] = +1.2.
References
- Allende Prieto et al. (2000) Allende Prieto, C., Rebolo, R., Garca, Lpez, R., Serra-Ricart, M., Beers, T. C., Rossi, S., Bonifacio, P., & Molaro, P. 2000, AJ, 120, 1516
- Alonso, Arribas, & Martinez-Roger (1994) Alonso, A., Arribas, S., & Martinez-Roger, C. 1994, AA, 282, 684
- Alonso, Arribas, & Martinez-Roger (1996) Alonso, A., Arribas, S., & Martinez-Roger, C. 1996, AAS, 313, 873
- Alonso, Arribas, & Martinez-Roger (1998) Alonso, A., Arribas, S., & Martinez-Roger, C. 1998, AAS, 131, 209
- Alonso, Arribas, & Martinez-Roger (1999) Alonso, A., Arribas, S., & Martinez-Roger, C. 1999, AAS, 140, 261
- Aoki et al. (2001) Aoki, W., et al. 2001, ApJ, 561, 346
- Aoki et al. (2002a) Aoki, W. et al. 2002a, PASJ, 54, 427
- Aoki et al. (2002b) Aoki, W., Norris, J.E., Ryan, S.G., Beers, T.C., Ando, H., & Tsangarides, S. 2002b, ApJ, 580, 1149
- Arlandini et al. (1999) Arlandini, C., Käppeler, F., Wisshak, K., Gallino, R., Lugaro, M., Busso, M., & Straniero, O., 1999, ApJ, 525, 886
- Arce & Goodman (1999) Arce, H. G., & Goodman, A. A. 1999, ApJ, 512, L135
- Beers, Preston, & Shectman (1992) Beers, T. C., Preston, G. W., & Shectman, S. A. 1992, AJ, 103, 1987
- Bennet et al. (2003) Bennet, C. L., et al. 2003, ApJS, 148, 29
- Bonifacio, Monai, & Beers (2000) Bonifacio, P., Monai, S., & Beers, T. C. 2000, AJ, 120, 2065
- Burris et al. (2000) Burris, D. L., Pilachowski, C. A., Armandroff, T. E., Sneden, C., Cowan, J. J., & Roe, H 2000, ApJ, 544, 302
- Butcher (1987) Butcher, H. R. 1987, Nature, 328, 127
- Cameron (2001) Cameron, A. G. W. 2001, ApJ, 562, 456
- Cayrel et al. (2001) Cayrel, R.,et al. 2001, Nature, 409, 691
- Cayrel et al. (2004) Cayrel, R., et al. 2004, A&A, in press
- Cowan et al. (1999) Cowan, J. J., Pfeiffer, B., Kratz, K.-L., Thielemann, F.-K., Sneden, C., Burles, S, Tytler, D, & Beers, T. C. 1999, ApJ, 521, 194
- Cowan et al. (2002) Cowan, J. J., et al. 2002, ApJ, 572, 861
- Den Hartog et al. (2003) Den Hartog, E. A., Lawler, J. E., Sneden, C. & Cowan, J. J. 2003, ApJS, 148, 543
- François, Spite, & Spite (1993) François, P., Spite, M., & Spite, F. 1993, AA, 274, 821
- Freiburghaus, Rosswog, & Thielemann (1999) Freiburghaus, C., Rosswog, S., & Thielemann, F.-K. 1999, ApJ, 525, L121
- Giridhar (2001) Giridhar, S., Lambert, D. L., Gonzales, G., & Pandey, G. 2001, PASP, 113, 519
- Grevesse, Noels, & Sauval (1996) Grevesse, N., Noels, A., & Sauval, A.J. 1996, Cosmic Abundances, ed. S. S. Holt, G. Sonnebord, ASP Conf. Ser., 99, 117
- Hill et al. (2002) Hill, V., et al. 2002, A&A, 387, 560
- Hillebrandt, Nomoto, & Wolff (1984) Hillebrandt, W., Nomoto, K., & Wolff, R. G. 1984, A&A, 133, 175
- Hoffman, Woosley & Qian (1997) Hoffman, R. D., Woosley, S. E. & Qian, Y.-Z. 1997, ApJ, 482, 951
- Hoffman, Woosley & Weaver (2001) Hoffman, R. D., Woosley, S. E. & Weaver, T. A. 2001, ApJ, 549, 1085
- Honda et al. (2003) Honda, S., et al. 2003 ApJS submitted (Paper I)
- Ishimaru & Wanajo (1999) Ishimaru, Y., & Wanajo, S. 1999, ApJ, 511, L33
- Ishimaru et al. (2004) Ishimaru, Y., Wanajo, S., Aoki, W., & Ryan, S.G. 2004, ApJ, 600, L47
- Johnson & Bolte (2001) Johnson, J. A., & Bolte, M. 2001, ApJ, 554, 888
- Johnson & Bolte (2002) Johnson, J. A., & Bolte, M. 2002, ApJ, 579, 616
- Käppeler, Beer, & Wisshak (1989) Käppeler, F., Beer, H.,& Wisshak, K., 1989, Rep. Prog. Phys., 52, 945
- Kurucz (1993) Kurucz, R. L. 1993, Kurucz CD-ROM,No.13 (Harvard-Smithonian Center for Astrophysics)
- Lawler et al. (2001a) Lawler, J. E., Bonvallet, G., & Sneden, C. 2001a, ApJ, 556, 452
- Lawler et al. (2001b) Lawler, J. E., Wickliffe, M. E., Den Hartog, E. A., & Sneden, C. 2001b, ApJ, 563, 1075
- Lawler et al. (2001c) Lawler, J. E., Wickliffe, M. E., Cowley, C. R., & Sneden, C. 2001c, ApJS, 137, 341
- Meyer et al. (1992) Meyer, B. S., Mathews, G. J., Howard, W. M., Woosley, S. E., & Hoffman, R. D. 1992, ApJ, 399, 656
- McWilliam et al. (1995) McWilliam, A, Preston, G. W., Sneden, C, & Searle, L 1995, AJ, 109, 27
- McWilliam (1998) McWilliam, A 1998, AJ, 115, 1640
- Morell, Kallander, & Butcher (1992) Morell, O., Kallander, D., Butcher, H. R. 1992, AA, 259, 543
- Noguchi et al. (2002) Noguchi, K.,et al. 2002, PASJ, 54, 855
- Norris, Ryan, & Beers (1997) Norris, J. E., Ryan, S. G., & Beers, T. C. 1997, ApJ, 489, L169
- Norris, Ryan, & Beers (2001) Norris, J. E., Ryan, S. G., & Beers, T. C. 2001, ApJ, 561, 1034
- Otsuki et al. (2000) Otsuki, K., Tagoshi, H., Kajino, T., & Wanajo, S. 2000, ApJ, 533, 424
- Otsuki, Mathews & Kajino (2003) Otsuki, K., Mathews, G. J., & Kajino, T. 2003, New Astronomy, 8, 767
- Qian & Wasserburg (2000) Qian, Y.-Z., & Wasserburg, G. J. 2000, Phys.Rep., 333, 77
- Rosswog et al. (1999) Rosswog, S., Liebendorfer, M., Thielemann, F.-K., Davies, M. B., Benz, W., & Piran, T. 1999, A&A, 341, 499
- Ryan, Norris, & Beers (1996) Ryan, S. G., Norris, J. E., Beers, T. C. 1996, ApJ, 471, 254
- Schatz et al. (2002) Schatz, H., Toenjes, R., Pfeiffer, B., Beers, T. C., Cowan, J. J., Hill, V., & Kratz, K.-L. 2002, ApJ, 579, 626
- (53) Schlegel, D. J., Finkbeiner, D. P., & Davis, M. 1998, ApJ, 500, 525
- Skrutskie et al. (1997) Skrutskie, M.F. et al., 1997, in The Impact of Large Scale Near-IR Sky Surveys, ed. F. Garzon et al. (Dordrecht: Kluwer), p. 187
- Sneden et al. (1996) Sneden, C., McWilliam, A., Preston, G. W., Cowan, J. J., Burris, D. L., & Armosky, B. J. 1996, ApJ, 467, 819
- Sneden et al. (2000) Sneden, C, Cowan, J. J., Ivans, I. I., Fuller, G. M., Burles, S, Beers, T. C., & Lawler, J. E. 2000, ApJ, 533, L139
- Sneden et al. (2001) Sneden, C., Cowan, J. J., Beers, T. C., Truran, J. W., Lawler, J. E., & Fuller, G. 2001 Astrophysical Ages and Times Scales, ASP Conference Series Vol. 245,235
- Sneden et al. (2003) Sneden, C., et al. 2003, ApJ, 591, 936
- Sneden, Preston, & Cowan (2003) Sneden, C., Preston, G. W., & Cowan, J. J. 2003, ApJ, 592, 504
- Sumiyoshi et al. (2001) Sumiyoshi, K., Terasawa, M., Mathews, G. J., Kajino, T., Yamada, S., Suzuki, H. 2001, ApJ, 562, 880
- Truran et al. (2002) Truran, J. W., Cowan, J. J., Pilachowski, C. A., & Sneden, C. 2002, PASP, 114, 1293
- Tsujimoto, Shigeyama, & Yoshii (2000) Tsujimoto, T., Shigeyama, T., & Yoshii, Y. 2000, ApJ, 531, 33
- Wanajo et al. (2002) Wanajo, S., Itoh, N., Ishimaru, Y., Nozawa, S. & Beers, T.C. 2002, ApJ, 577, 853
- Wanajo et al. (2003) Wanajo, S., Tamamura, M., Itoh, N., Nomoto, K., Ishimaru, Y., Beers, T. C., & Nozawa, S. 2003, ApJ, 593, 968
- Wasserburg & Qian (2000) Wasserburg, G. J., & Qian, Y. -Z. 2000, ApJ, 529, L24
- Westin et al. (2000) Westin, J., Sneden, C., Gustafsson, B., & Cowan, J. J. 2000, ApJ, 530, 783
- Woosley et al. (1994) Woosley, S.E., Wilson, J.R., Mathews, G.J., Hoffman, R.D., & Meyer, B.S. 1994, ApJ, 433, 229
| Object | ||||||||||
|---|---|---|---|---|---|---|---|---|---|---|
| HD 4306 | 9.71 | 9.08 | 9.08 | 7.42 | 6.98 | 6.82 | 0.63 | 0.00 | 0.63 | 2.26 |
| HD 6268 | 8.89 | 8.10 | 8.10 | 6.34 | 5.84 | 5.71 | 0.79 | 0.00 | 0.79 | 2.39 |
| HD 88609 | 9.52 | 8.59 | 8.59 | 6.67 | 6.13 | 6.01 | 0.93 | 0.00 | 0.93 | 2.58 |
| HD 110184 | 9.48 | 8.31 | 8.31 | 6.13 | 5.51 | 5.35 | 1.17 | 0.00 | 1.17 | 2.96 |
| HD 115444 | 9.75 | 8.97 | 8.97 | 7.16 | 6.70 | 6.61 | 0.78 | 0.00 | 0.78 | 2.36 |
| HD 122563 | 7.11 | 6.20 | 6.20 | 4.79 | 4.03 | 3.73 | 0.91 | 0.00 | 0.91 | 2.47 |
| HD 126587 | 9.88 | 9.15 | 8.84 | 7.26 | 6.78 | 6.67 | 0.73 | 0.10 | 0.63 | 2.17 |
| HD 140283 | 7.70 | 7.21 | 7.18 | 6.01 | 5.70 | 5.59 | 0.49 | 0.01 | 0.48 | 1.59 |
| HD 186478 | 10.08 | 9.18 | 8.81 | 7.12 | 6.60 | 6.44 | 0.90 | 0.12 | 0.78 | 2.37 |
| BS 16082–129 | 14.22 | 13.55 | 13.49 | 11.86 | 11.40 | 11.31 | 0.67 | 0.02 | 0.65 | 2.18 |
| BS 16085–050 | 12.89 | 12.15 | 12.09 | 10.47 | 10.01 | 9.94 | 0.74 | 0.02 | 0.72 | 2.15 |
| BS 16469–075 | 14.19 | 13.42 | 13.36 | 11.75 | 11.26 | 11.20 | 0.77 | 0.02 | 0.75 | 2.16 |
| BS 16920–017 | 14.64 | 13.88 | 13.85 | 12.17 | 11.68 | 11.59 | 0.76 | 0.01 | 0.75 | 2.26 |
| BS 16928–053 | 14.32 | 13.47 | 13.44 | 11.66 | 11.14 | 11.04 | 0.85 | 0.01 | 0.84 | 2.40 |
| BS 16929–005 | 14.23 | 13.61 | 13.58 | 12.17 | 11.75 | 11.67 | 0.62 | 0.01 | 0.61 | 1.91 |
| BS 17583–100 | 12.88 | 12.37 | 12.06 | 11.10 | 10.69 | 10.66 | 0.51 | 0.10 | 0.41 | 1.40 |
| CS 22169–035 | 13.80 | 12.88 | 12.76 | 11.00 | 10.48 | 10.35 | 0.92 | 0.04 | 0.88 | 2.40 |
| CS 22183–031 | 14.27 | 13.62 | 13.50 | 12.11 | 11.65 | 11.58 | 0.65 | 0.04 | 0.61 | 1.91 |
| CS 22892–052 | 13.96 | 13.18 | 13.18 | 11.30 | 10.85 | 10.93 | 0.78 | 0.00 | 0.78 | 2.25 |
| CS 22952–015 | 14.05 | 13.27 | 13.15 | 11.49 | 11.02 | 10.92 | 0.78 | 0.04 | 0.74 | 2.23 |
| CS 30306–132 | 13.61 | 12.81 | 12.78 | 11.52 | 11.00 | 10.75 | 0.80 | 0.01 | 0.79 | 2.03 |
| CS 31082–001 | 12.44 | 11.67 | 11.67 | 10.05 | 9.61 | 9.46 | 0.77 | 0.00 | 0.77 | 2.21 |
| Object | (adopted) | [Fe/H] | N | |||||
|---|---|---|---|---|---|---|---|---|
| HD 4306 | 4814 | 5058 | 4810 | 1.6 | 1.8 | –2.89 | 0.09 | 81 |
| HD 6268 | 4679 | 4683 | 4600 | 2.1 | 1.0 | –2.63 | 0.11 | 82 |
| HD 88609 | 4512 | 4467 | 4550 | 2.4 | 1.1 | –3.07 | 0.20 | 70 |
| HD 110184 | 4220 | 4225 | 4240 | 2.1 | 0.3 | –2.52 | 0.11 | 47 |
| HD 115444 | 4707 | 4702 | 4720 | 1.7 | 1.5 | –2.85 | 0.15 | 76 |
| HD 122563 | 4599 | 4493 | 4570 | 2.2 | 1.1 | –2.77 | 0.19 | 84 |
| HD 126587 | 4919 | 5058 | 4960 | 1.8 | 2.1 | –2.78 | 0.12 | 80 |
| HD 140283 | 5633 | 5585 | 5630 | 1.4 | 3.5 | –2.53 | 0.08 | 78 |
| HD 186478 | 4700 | 4702 | 4720 | 2.2 | 1.6 | –2.50 | 0.12 | 78 |
| BS 16082–129 | 4898 | 5002 | 4900 | 1.6 | 1.8 | –2.86 | 0.15 | 76 |
| BS 16085–050 | 4943 | 4827 | 4950 | 1.8 | 1.8 | –2.91 | 0.10 | 82 |
| BS 16469–075 | 4950 | 4762 | 4880 | 1.4 | 2.0 | –3.03 | 0.14 | 79 |
| BS 16920–017 | 4839 | 4762 | 4760 | 1.4 | 1.2 | –3.12 | 0.23 | 69 |
| BS 16928–053 | 4681 | 4596 | 4590 | 1.6 | 0.9 | –2.91 | 0.14 | 80 |
| BS 16929–005 | 5267 | 5118 | 5270 | 1.3 | 2.7 | –3.09 | 0.15 | 63 |
| BS 17583–100 | 5934 | 5902 | 5930 | 1.4 | 4.0 | –2.42 | 0.10 | 55 |
| CS 22169–035 | 4667 | 4535 | 4670 | 1.9 | 1.3 | –2.72 | 0.17 | 35 |
| CS 22183–031 | 5247 | 5118 | 5270 | 1.2 | 2.8 | –2.93 | 0.20 | 49 |
| CS 22952–015 | 4879 | 4783 | 4850 | 1.5 | 1.5 | –2.94 | 0.26 | 57 |
| CS 30306–132 | 5105 | 4683 | 5110 | 1.8 | 2.5 | –2.42 | 0.13 | 93 |
| CS 22892–052 | 4778 | 4702 | 4790 | 1.8 | 1.6 | –2.92 | 0.14 | 82 |
| CS 31082–001 | 4825 | 4721 | 4790 | 1.9 | 1.8 | –2.81 | 0.12 | 69 |
| HD 4306 | HD 6268 | HD 88609 | HD 110184 | ||||||||||||||
|---|---|---|---|---|---|---|---|---|---|---|---|---|---|---|---|---|---|
| log | [X/Fe] | n | log | [X/Fe] | n | log | [X/Fe] | n | log | [X/Fe] | n | ||||||
| Fe/H | 4.62 | –2.89 | 0.09 | 81 | 4.88 | –2.63 | 0.11 | 82 | 4.44 | –3.07 | 0.2 | 70 | 4.99 | –2.52 | 0.11 | 47 | |
| 12C/13C | 20 | 4 | 3 | 5 | |||||||||||||
| 6 | C | 5.78 | 0.11 | 5.26 | –0.67 | 4.98 | –0.51 | 5.37 | –0.67 | ||||||||
| 12 | Mg | 5.25 | 0.56 | 0.17 | 4 | 5.44 | 0.49 | 0.25 | 4 | 4.94 | 0.43 | 0.28 | 4 | 5.25 | 0.19 | 0.16 | 2 |
| 13 | Al | 3.02 | –0.56 | 0.09 | 1 | 3.27 | –0.57 | 0.17 | 1 | 2.65 | –0.75 | 0.17 | 1 | 3.11 | –0.84 | 0.14 | 1 |
| 14 | Si | 5.26 | 0.60 | 0.09 | 1 | 5.46 | 0.54 | 0.17 | 1 | 5.06 | 0.58 | 0.17 | 1 | 5.52 | 0.49 | 0.14 | 1 |
| 20 | Ca | 3.97 | 0.50 | 0.01 | 3 | 4.09 | 0.36 | 0.11 | 3 | 3.66 | 0.37 | 0.08 | 4 | 4.13 | 0.29 | 0.08 | 2 |
| 21 | Sc | 0.45 | 0.17 | 0.03 | 3 | 0.51 | –0.03 | 0.03 | 3 | 0.14 | 0.04 | 0.07 | 3 | 0.59 | –0.06 | 0.08 | 2 |
| 22 | Ti | 2.55 | 0.42 | 0.09 | 21 | 2.62 | 0.23 | 0.10 | 12 | 2.22 | 0.27 | 0.12 | 17 | 2.58 | 0.08 | 0.12 | 21 |
| 23 | V | 1.24 | 0.13 | 0.17 | 3 | 1.42 | 0.05 | 0.22 | 3 | 1.34 | 0.41 | 0.17 | 2 | ||||
| 24 | Cr | 2.97 | 0.19 | 0.09 | 2 | 3.20 | 0.16 | 0.17 | 2 | 2.73 | 0.13 | 0.17 | 2 | 3.03 | –0.12 | 0.14 | 1 |
| 25 | Mn | 2.08 | –0.42 | 0.13 | 6 | 2.49 | –0.27 | 0.17 | 6 | 1.91 | –0.41 | 0.25 | 6 | 2.67 | –0.20 | 0.19 | 4 |
| 27 | Co | 2.32 | 0.29 | 0.09 | 2 | 2.48 | 0.19 | 0.17 | 2 | 1.77 | –0.08 | 0.17 | 2 | 2.28 | –0.12 | 0.14 | 2 |
| 28 | Ni | 3.33 | –0.03 | 0.09 | 2 | 3.40 | –0.22 | 0.17 | 2 | 2.75 | –0.43 | 0.17 | 2 | 3.54 | –0.19 | 0.14 | 2 |
| 29 | Cu | 0.39 | –0.75 | 0.17 | 1 | 1.02 | –0.67 | 0.14 | 1 | ||||||||
| 38 | Sr | –0.08 | –0.11 | 0.09 | 1 | 0.36 | 0.07 | 0.33 | 3 | –0.35 | –0.20 | 0.17 | 2 | 0.34 | –0.06 | 0.14 | 2 |
| 39 | Y | –0.99 | –0.33 | 0.18 | 6 | –0.57 | –0.17 | 0.06 | 8 | –0.89 | –0.05 | 0.17 | 5 | –0.40 | –0.11 | 0.16 | 5 |
| 40 | Zr | –0.22 | 0.06 | 0.09 | 2 | 0.10 | 0.12 | 0.20 | 4 | –0.15 | 0.31 | 0.17 | 3 | 0.25 | 0.16 | 0.10 | 3 |
| 45 | Ru | ||||||||||||||||
| 46 | Pd | –0.98 | –0.05 | 0.17 | 1 | ||||||||||||
| 56 | Ba | –1.84 | –1.17 | 0.09 | 2 | –0.45 | –0.04 | 0.17 | 2 | –1.90 | –1.05 | 0.17 | 2 | –0.82 | –0.52 | 0.14 | 2 |
| 57 | La | –2.55 | –0.88 | 0.09 | 1 | –1.32 | 0.09 | 0.05 | 5 | –1.76 | –0.46 | 0.14 | 5 | ||||
| 58 | Ce | –0.88 | 0.12 | 0.11 | 8 | –1.45 | –0.56 | 0.14 | 7 | ||||||||
| 59 | Pr | –1.54 | 0.29 | 0.17 | 2 | –2.32 | –0.60 | 0.14 | 1 | ||||||||
| 60 | Nd | –0.89 | 0.25 | 0.08 | 8 | –1.33 | –0.30 | 0.14 | 7 | ||||||||
| 62 | Sm | –1.27 | 0.38 | 0.21 | 3 | –1.63 | –0.09 | 0.23 | 4 | ||||||||
| 63 | Eu | –2.96 | –0.62 | 0.09 | 2 | –1.56 | 0.52 | 0.03 | 3 | –1.91 | 0.06 | 0.05 | 3 | ||||
| 64 | Gd | –1.01 | 0.53 | 0.17 | 2 | –1.85 | –0.42 | 0.14 | 1 | ||||||||
| 65 | Tb | –2.15 | 0.13 | 0.17 | 1 | –2.72 | –0.55 | 0.14 | 2 | ||||||||
| 66 | Dy | –1.00 | 0.46 | 0.14 | 5 | –1.44 | –0.09 | 0.24 | 4 | ||||||||
| 68 | Er | –1.20 | 0.46 | 0.13 | 3 | –1.75 | –0.20 | 0.08 | 3 | ||||||||
| 69 | Tm | –2.22 | 0.26 | 0.07 | 3 | –2.72 | –0.35 | 0.14 | 2 | ||||||||
| 70 | Yb | –1.33 | 0.34 | 0.17 | 1 | –1.70 | –0.14 | 0.14 | 1 | ||||||||
| 76 | Os | ||||||||||||||||
| 77 | Ir | –0.87 | 0.39 | 0.17 | 1 | ||||||||||||
| 90 | Th | –1.93 | 0.61 | 0.10 | 1 | –2.50 | –0.07 | 0.15 | 1 | ||||||||
| 92 | U | –2.63 | 0.50 | 1 | –2.52 | 0.50 | 1 | ||||||||||
[Fe/H] and 12C/13C are given for the first and second lines, respectively
| HD 115444 | HD 122563 | HD 126587 | HD 140283 | ||||||||||||||
|---|---|---|---|---|---|---|---|---|---|---|---|---|---|---|---|---|---|
| log | [X/Fe] | n | log | [X/Fe] | n | log | [X/Fe] | n | log | [X/Fe] | n | ||||||
| Fe/H | 4.66 | –2.85 | 0.15 | 76 | 4.74 | –2.77 | 0.19 | 84 | –2.78 | 0.12 | 80 | 4.98 | –2.53 | 0.08 | 78 | ||
| 12C/13C | 7 | 5 | 20 | 20 | |||||||||||||
| 6 | C | 5.30 | –0.41 | 5.38 | –0.41 | 5.97 | 0.19 | 6.31 | 0.28 | ||||||||
| 12 | Mg | 5.12 | 0.39 | 0.03 | 4 | 5.35 | 0.54 | 0.06 | 6 | 5.22 | 0.42 | 0.1 | 6 | 5.26 | 0.21 | 0.13 | 5 |
| 13 | Al | 3.14 | –0.48 | 0.11 | 1 | 3.30 | –0.40 | 0.12 | 1 | 2.98 | –0.71 | 0.12 | 1 | 2.92 | –1.02 | 0.09 | 1 |
| 14 | Si | 5.05 | 0.35 | 0.11 | 1 | 5.22 | 0.44 | 0.12 | 1 | 5.33 | 0.56 | 0.12 | 1 | 5.26 | 0.24 | 0.09 | 1 |
| 20 | Ca | 3.78 | 0.27 | 0.06 | 4 | 3.89 | 0.30 | 0.10 | 4 | 3.94 | 0.36 | 0.11 | 4 | 4.08 | 0.25 | 0.04 | 4 |
| 21 | Sc | 0.30 | –0.02 | 0.00 | 3 | 0.40 | 0.00 | 0.07 | 3 | 0.52 | 0.13 | 0.03 | 2 | 0.66 | 0.02 | 0.04 | 3 |
| 22 | Ti | 2.47 | 0.30 | 0.10 | 26 | 2.45 | 0.20 | 0.12 | 27 | 0.41 | 0.29 | 26 | 2.72 | 0.23 | 0.08 | 22 | |
| 23 | V | 1.10 | –0.05 | 0.15 | 4 | 1.28 | 0.05 | 0.13 | 4 | 1.45 | 0.23 | 0.12 | 2 | 1.55 | 0.07 | 0.08 | 3 |
| 24 | Cr | 2.88 | 0.06 | 0.17 | 3 | 3.05 | 0.15 | 0.15 | 3 | 3.36 | 0.47 | 0.15 | 3 | 3.35 | 0.21 | 0.15 | 3 |
| 25 | Mn | 2.01 | –0.53 | 0.12 | 6 | 2.46 | –0.16 | 0.09 | 6 | 2.21 | –0.40 | 0.11 | 6 | 2.59 | –0.27 | 0.10 | 6 |
| 27 | Co | 2.26 | 0.19 | 0.12 | 3 | 2.33 | 0.18 | 0.16 | 3 | 2.44 | 0.3 | 0.13 | 3 | 2.65 | 0.26 | 0.03 | 4 |
| 28 | Ni | 3.29 | –0.11 | 0.11 | 2 | 3.33 | –0.15 | 0.12 | 2 | 3.35 | –0.12 | 0.12 | 2 | 3.76 | 0.04 | 0.09 | 2 |
| 29 | Cu | 0.66 | –0.78 | 0.12 | 1 | ||||||||||||
| 38 | Sr | 0.11 | 0.04 | 0.11 | 2 | 0.04 | –0.11 | 0.12 | 1 | 0.21 | 0.07 | 0.12 | 1 | –0.03 | –0.42 | 0.09 | 1 |
| 39 | Y | –0.78 | –0.16 | 0.08 | 7 | –0.87 | –0.33 | 0.12 | 6 | –0.65 | –0.10 | 0.1 | 5 | –0.84 | –0.54 | 0.18 | 3 |
| 40 | Zr | –0.06 | 0.18 | 0.17 | 4 | –0.19 | –0.03 | 0.11 | 3 | 0.16 | 0.33 | 0.12 | 2 | –0.15 | –0.23 | 0.09 | 2 |
| 45 | Ru | ||||||||||||||||
| 46 | Pd | –1.06 | 0.09 | 0.11 | 1 | ||||||||||||
| 56 | Ba | –0.49 | 0.14 | 0.11 | 2 | –1.76 | –1.21 | 0.12 | 2 | –0.66 | –0.10 | 0.12 | 2 | –1.37 | –1.06 | 0.09 | 2 |
| 57 | La | –1.53 | 0.10 | 0.05 | 5 | –2.44 | –0.89 | 0.12 | 5 | –1.59 | –0.03 | 0.07 | 4 | ||||
| 58 | Ce | –1.10 | 0.12 | 0.10 | 8 | –1.08 | 0.07 | 0.12 | 5 | ||||||||
| 59 | Pr | –1.49 | 0.56 | 0.11 | 2 | –1.29 | 0.69 | 0.12 | 1 | ||||||||
| 60 | Nd | –1.06 | 0.30 | 0.06 | 7 | –1.95 | –0.67 | 0.12 | 1 | –1.07 | 0.22 | 0.19 | 6 | ||||
| 62 | Sm | –1.24 | 0.63 | 0.19 | 4 | –1.27 | 0.53 | 0.12 | 2 | ||||||||
| 63 | Eu | –1.64 | 0.66 | 0.03 | 3 | –2.60 | –0.38 | 0.12 | 1 | –1.70 | 0.53 | 0.04 | 3 | ||||
| 64 | Gd | –1.10 | 0.66 | 0.21 | 3 | –2.31 | –0.63 | 0.12 | 1 | –1.30 | 0.39 | 0.12 | 1 | ||||
| 65 | Tb | –2.29 | 0.21 | 0.11 | 1 | ||||||||||||
| 66 | Dy | –1.07 | 0.61 | 0.09 | 5 | –1.19 | 0.42 | 0.12 | 2 | ||||||||
| 68 | Er | –1.26 | 0.62 | 0.09 | 4 | ||||||||||||
| 69 | Tm | –2.18 | 0.52 | 0.11 | 2 | ||||||||||||
| 70 | Yb | –1.46 | 0.43 | 0.11 | 1 | ||||||||||||
| 76 | Os | ||||||||||||||||
| 77 | Ir | –0.89 | 0.59 | 0.11 | 1 | ||||||||||||
| 90 | Th | –1.97 | 0.79 | 0.15 | 1 | ||||||||||||
| 92 | U | –2.35 | 1.00 | 1 | |||||||||||||
| HD 186478 | BS 16082–129 | BS 16085–050 | BS 16469–075 | ||||||||||||||
|---|---|---|---|---|---|---|---|---|---|---|---|---|---|---|---|---|---|
| log | [X/Fe] | n | log | [X/Fe] | n | log | [X/Fe] | n | log | [X/Fe] | n | ||||||
| Fe/H | 5.01 | –2.50 | 0.12 | 78 | 4.65 | –2.86 | 0.15 | 76 | 4.60 | –2.91 | 0.10 | 82 | 4.48 | –3.03 | 0.14 | 79 | |
| 12C/13C | 6 | 7 | 3 | 5 | |||||||||||||
| 6 | C | 5.81 | –0.25 | 5.99 | 0.29 | –0.52 | 5.74 | 0.21 | |||||||||
| 12 | Mg | 5.50 | 0.42 | 0.15 | 4 | 5.00 | 0.28 | 0.15 | 7 | 5.28 | 0.61 | 0.17 | 7 | 4.91 | 0.36 | 0.24 | 4 |
| 13 | Al | 3.36 | –0.61 | 0.14 | 1 | 2.67 | –0.94 | 0.16 | 1 | 3.03 | –0.53 | 0.10 | 1 | 2.67 | –0.77 | 0.12 | 1 |
| 14 | Si | 5.48 | 0.43 | 0.14 | 1 | 5.05 | 0.36 | 0.16 | 1 | 5.57 | 0.93 | 0.10 | 1 | 4.92 | 0.40 | 0.12 | 1 |
| 20 | Ca | 4.25 | 0.39 | 0.13 | 4 | 3.81 | 0.31 | 0.04 | 4 | 3.83 | 0.38 | 0.03 | 4 | 3.63 | 0.30 | 0.16 | 4 |
| 21 | Sc | 0.70 | 0.03 | 0.09 | 3 | 0.30 | –0.01 | 0.06 | 2 | 0.56 | 0.30 | 0.07 | 2 | 0.18 | 0.04 | 0.05 | 2 |
| 22 | Ti | 2.81 | 0.29 | 0.12 | 24 | 2.40 | 0.24 | 0.12 | 22 | 2.33 | 0.22 | 0.09 | 24 | 2.22 | 0.23 | 0.10 | 21 |
| 23 | V | 1.64 | 0.14 | 0.15 | 3 | 1.16 | 0.02 | 0.16 | 2 | 1.34 | 0.25 | 0.10 | 2 | 1.04 | 0.07 | 0.12 | 2 |
| 24 | Cr | 3.34 | 0.17 | 0.14 | 2 | 2.81 | 0.00 | 0.16 | 3 | 2.82 | 0.06 | 0.10 | 2 | ||||
| 25 | Mn | 2.65 | –0.24 | 0.11 | 6 | 2.22 | –0.31 | 0.10 | 6 | 2.47 | –0.01 | 0.15 | 6 | 1.83 | –0.53 | 0.15 | 4 |
| 27 | Co | 2.50 | 0.08 | 0.14 | 2 | 2.38 | 0.32 | 0.13 | 3 | 2.29 | 0.28 | 0.09 | 3 | 2.23 | 0.34 | 0.07 | 3 |
| 28 | Ni | 3.42 | –0.33 | 0.14 | 2 | 3.20 | –0.19 | 0.16 | 2 | 3.54 | 0.20 | 0.10 | 2 | 3.24 | 0.02 | 0.12 | 2 |
| 29 | Cu | 1.03 | –0.68 | 0.14 | 1 | ||||||||||||
| 38 | Sr | 0.37 | –0.05 | 0.14 | 2 | –0.67 | –0.73 | 0.16 | 1 | –1.70 | –1.71 | 0.10 | 1 | 0.12 | 0.23 | 0.12 | 1 |
| 39 | Y | –0.36 | –0.09 | 0.08 | 5 | –1.19 | –0.56 | 0.25 | 4 | –0.88 | –0.08 | 0.00 | 4 | ||||
| 40 | Zr | 0.39 | 0.28 | 0.23 | 3 | –0.26 | –0.01 | 0.36 | 4 | –0.12 | 0.30 | 0.12 | 2 | ||||
| 45 | Ru | ||||||||||||||||
| 46 | Pd | –0.73 | 0.07 | 0.14 | 1 | ||||||||||||
| 56 | Ba | –0.51 | –0.23 | 0.14 | 2 | –1.61 | –0.97 | 0.16 | 2 | –1.56 | 0.10 | 2 | –1.93 | –1.12 | 0.12 | 2 | |
| 57 | La | –1.21 | 0.07 | 0.06 | 5 | ||||||||||||
| 58 | Ce | –0.75 | 0.12 | 0.12 | 8 | ||||||||||||
| 59 | Pr | –1.45 | 0.25 | 0.14 | 1 | ||||||||||||
| 60 | Nd | –0.75 | 0.26 | 0.09 | 6 | ||||||||||||
| 62 | Sm | –0.98 | 0.54 | 0.20 | 4 | ||||||||||||
| 63 | Eu | –1.34 | 0.61 | 0.06 | 3 | ||||||||||||
| 64 | Gd | –0.88 | 0.53 | 0.14 | 2 | ||||||||||||
| 65 | Tb | ||||||||||||||||
| 66 | Dy | –0.78 | 0.55 | 0.02 | 4 | ||||||||||||
| 68 | Er | –1.03 | 0.50 | 0.22 | 4 | ||||||||||||
| 69 | Tm | –1.92 | 0.43 | 0.12 | 3 | ||||||||||||
| 70 | Yb | –1.27 | 0.27 | 0.14 | 1 | ||||||||||||
| 76 | Os | ||||||||||||||||
| 77 | Ir | ||||||||||||||||
| 90 | Th | –1.85 | 0.56 | 0.15 | 1 | ||||||||||||
| 92 | U | –2.00 | 1.00 | 1 | |||||||||||||
| BS 16920–017 | BS 16928–053 | BS 16929–005 | BS 17583–100 | ||||||||||||||
|---|---|---|---|---|---|---|---|---|---|---|---|---|---|---|---|---|---|
| log | [X/Fe] | n | log | [X/Fe] | n | log | [X/Fe] | n | log | [X/Fe] | n | ||||||
| Fe/H | 4.39 | –3.12 | 0.23 | 69 | 4.60 | –2.91 | 0.14 | 80 | 4.52 | –3.09 | 0.15 | 63 | 5.09 | –2.42 | 0.10 | 55 | |
| 12C/13C | 3 | 5 | 7 | 3 | |||||||||||||
| 6 | C | –0.07 | 5.42 | –0.23 | 6.39 | 0.92 | 6.67 | 0.53 | |||||||||
| 12 | Mg | 4.67 | 0.21 | 0.28 | 6 | 5.06 | 0.39 | 0.35 | 4 | 4.87 | 0.38 | 0.32 | 4 | 5.43 | 0.27 | 0.26 | 5 |
| 13 | Al | 2.64 | –0.71 | 0.19 | 1 | 2.74 | –0.83 | 0.15 | 1 | 2.53 | –0.85 | 0.16 | 1 | 3.13 | –0.92 | 0.09 | 1 |
| 14 | Si | 4.42 | –0.01 | 0.19 | 1 | 4.93 | 0.29 | 0.15 | 1 | 4.84 | 0.38 | 0.16 | 1 | 5.45 | 0.32 | 0.09 | 1 |
| 20 | Ca | 3.21 | –0.03 | 0.18 | 4 | 3.76 | 0.31 | 0.07 | 4 | 3.73 | 0.46 | 0.17 | 4 | 4.22 | 0.28 | 0.07 | 6 |
| 21 | Sc | –0.23 | –0.28 | 0.07 | 2 | –0.04 | –0.30 | 0.13 | 2 | –0.45 | –0.53 | 0.16 | 1 | 0.92 | 0.17 | 0.07 | 2 |
| 22 | Ti | 2.24 | 0.34 | 0.13 | 23 | 2.24 | 0.13 | 0.09 | 23 | 2.35 | 0.42 | 0.12 | 16 | 2.99 | 0.39 | 0.07 | 17 |
| 23 | V | 1.14 | 0.26 | 0.19 | 1 | 0.93 | –0.16 | 0.15 | 2 | 1.92 | 0.34 | 0.09 | 1 | ||||
| 24 | Cr | 2.53 | –0.02 | 0.19 | 2 | 2.68 | –0.08 | 0.15 | 2 | 3.02 | –0.23 | 0.09 | |||||
| 25 | Mn | 2.50 | 0.23 | 0.20 | 6 | 2.24 | –0.24 | 0.09 | 6 | 1.56 | –0.74 | 0.16 | 2 | 2.49 | –0.48 | 0.06 | 3 |
| 27 | Co | 2.07 | 0.27 | 0.23 | 3 | 2.14 | 0.13 | 0.11 | 3 | 2.19 | 0.36 | 0.06 | 3 | 2.89 | 0.39 | 0.04 | 3 |
| 28 | Ni | 3.51 | 0.38 | 0.19 | 2 | 3.09 | –0.25 | 0.15 | 2 | 3.07 | –0.09 | 0.16 | 2 | 3.88 | 0.05 | 0.09 | 2 |
| 29 | Cu | ||||||||||||||||
| 38 | Sr | –0.63 | –0.43 | 0.19 | 1 | –0.22 | –0.23 | 0.15 | 1 | 0.11 | 0.28 | 0.16 | 2 | 0.66 | 0.16 | 0.09 | 1 |
| 39 | Y | –1.15 | –0.47 | 0.13 | 5 | –0.70 | 0.16 | 0.16 | 2 | –0.02 | 0.17 | 0.12 | 3 | ||||
| 40 | Zr | –0.55 | –0.25 | 0.25 | 3 | ||||||||||||
| 45 | Ru | ||||||||||||||||
| 46 | Pd | ||||||||||||||||
| 56 | Ba | –2.73 | –1.83 | 0.19 | 2 | –1.85 | –1.16 | 0.15 | 2 | –1.46 | –0.59 | 0.16 | 2 | –0.53 | –0.33 | 0.09 | 2 |
| CS 22169–035 | CS 22183–031 | CS 22952–015 | CS 30306–132 | ||||||||||||||
|---|---|---|---|---|---|---|---|---|---|---|---|---|---|---|---|---|---|
| log | [X/Fe] | n | log | [X/Fe] | n | log | [X/Fe] | n | log | [X/Fe] | n | ||||||
| Fe/H | 4.79 | –2.72 | 0.17 | 35 | 4.58 | –2.93 | 0.20 | 49 | 4.57 | –2.94 | 0.26 | 5.09 | –2.42 | 0.13 | |||
| 12C/13C | 3 | 3 | 20 | ||||||||||||||
| 6 | C | 5.59 | –0.25 | 6.05 | 0.42 | 5.40 | –0.22 | 6.48 | 0.34 | ||||||||
| 12 | Mg | 4.80 | –0.06 | 0.50 | 4 | 5.07 | 0.42 | 0.32 | 5 | 4.45 | –0.19 | 0.21 | 5 | 5.49 | 0.33 | 0.19 | 7 |
| 13 | Al | 2.64 | –1.11 | 0.19 | 1 | 2.98 | –0.56 | 0.15 | 1 | 2.85 | –0.68 | 0.19 | 1 | 3.41 | –0.64 | 0.14 | 1 |
| 14 | Si | 5.15 | 0.32 | 0.19 | 1 | 5.36 | 0.74 | 0.15 | 1 | 5.00 | 0.39 | 0.19 | 1 | 5.64 | 0.51 | 0.14 | 1 |
| 20 | Ca | 3.72 | 0.29 | 0.15 | 4 | 3.45 | 0.03 | 0.16 | 2 | 4.28 | 0.34 | 0.03 | 3 | ||||
| 21 | Sc | 0.12 | –0.33 | 0.05 | 2 | 0.54 | 0.30 | 0.05 | 2 | –0.13 | –0.36 | 0.06 | 2 | 0.87 | 0.12 | 0.14 | 2 |
| 22 | Ti | 2.17 | –0.13 | 0.06 | 13 | 2.47 | 0.38 | 0.03 | 16 | 1.96 | –0.12 | 0.06 | 13 | 2.95 | 0.35 | 0.03 | 25 |
| 23 | V | 1.75 | 0.68 | 0.15 | 1 | 1.03 | –0.03 | 0.19 | 1 | 1.79 | 0.21 | 0.14 | 2 | ||||
| 24 | Cr | 3.31 | 0.06 | 0.14 | 2 | ||||||||||||
| 25 | Mn | 2.76 | 0.09 | 0.19 | 2 | 2.01 | –0.45 | 0.27 | 3 | 2.11 | –0.34 | 0.39 | 3 | 2.84 | –0.13 | 0.23 | 6 |
| 27 | Co | 1.98 | –0.22 | 0.15 | 3 | 2.36 | 0.37 | 0.11 | 4 | 2.04 | 0.06 | 0.19 | 2 | 2.74 | 0.24 | 0.14 | 3 |
| 28 | Ni | 3.12 | –0.41 | 0.19 | 2 | 3.44 | 0.12 | 0.15 | 2 | 3.20 | –0.11 | 0.19 | 2 | 3.57 | –0.26 | 0.14 | 2 |
| 29 | Cu | ||||||||||||||||
| 38 | Sr | –0.64 | –0.84 | 0.19 | 2 | 0.09 | 0.10 | 0.15 | 1 | –0.73 | –0.71 | 0.19 | 2 | 0.64 | 0.14 | 0.14 | 2 |
| 39 | Y | –0.49 | 0.21 | 0.15 | 2 | –0.07 | 0.12 | 0.12 | 6 | ||||||||
| 40 | Zr | 0.65 | 0.46 | 0.14 | 4 | ||||||||||||
| 45 | Ru | ||||||||||||||||
| 46 | Pd | ||||||||||||||||
| 56 | Ba | –2.21 | –1.71 | 0.19 | 2 | –0.33 | 0.38 | 0.15 | 2 | –2.49 | –1.77 | 0.19 | 2 | 0.02 | 0.22 | 0.14 | 2 |
| 57 | La | –0.78 | 0.42 | 0.06 | 5 | ||||||||||||
| 58 | Ce | –0.31 | 0.48 | 0.26 | 5 | ||||||||||||
| 59 | Pr | –0.65 | 0.97 | 0.14 | 1 | ||||||||||||
| 60 | Nd | –0.38 | 0.55 | 0.12 | 8 | ||||||||||||
| 62 | Sm | –0.82 | 0.62 | 0.14 | 2 | ||||||||||||
| 63 | Eu | –1.22 | 1.16 | 0.08 | 3 | –1.02 | 0.85 | 0.05 | 3 | ||||||||
| 64 | Gd | –0.37 | 0.96 | 0.14 | 2 | ||||||||||||
| 65 | Tb | ||||||||||||||||
| 66 | Dy | –0.43 | 0.82 | 0.11 | 3 | ||||||||||||
| 68 | Er | –0.62 | 0.83 | 0.22 | 4 | ||||||||||||
| 69 | Tm | –1.38 | 0.89 | 0.14 | 2 | ||||||||||||
| 70 | Yb | –0.81 | 0.65 | 0.14 | 1 | ||||||||||||
| 76 | Os | ||||||||||||||||
| 77 | Ir | ||||||||||||||||
| 90 | Th | –1.12 | 1.21 | 0.15 | 1 | ||||||||||||
| 92 | U | –1.42 | 1.50 | 1 | |||||||||||||
| CS 31082–001 | CS 22892–052 | ||||||||
|---|---|---|---|---|---|---|---|---|---|
| log | [X/Fe] | n | log | [X/Fe] | n | ||||
| Fe/H | 4.70 | –2.81 | 0.12 | 4.59 | –2.92 | 0.14 | |||
| 12C/13C | 10 | 20 | |||||||
| 6 | C | 5.84 | 0.09 | 6.55 | 0.91 | ||||
| 12 | Mg | 5.43 | 0.66 | 0.11 | 4 | 4.93 | 0.27 | 0.17 | 7 |
| 13 | Al | 3.05 | –0.61 | 0.19 | 1 | 2.94 | –0.61 | 0.15 | 1 |
| 14 | Si | 5.36 | 0.62 | 0.19 | 1 | 4.87 | 0.24 | 0.15 | 1 |
| 20 | Ca | 3.97 | 0.42 | 0.19 | 1 | 3.70 | 0.26 | 0.09 | 4 |
| 21 | Sc | 0.19 | –0.17 | 0.19 | 1 | 0.17 | –0.08 | 0.01 | 2 |
| 22 | Ti | 2.55 | 0.34 | 0.05 | 15 | 2.18 | 0.08 | 0.03 | 19 |
| 23 | V | 1.47 | 0.28 | 0.19 | 2 | 1.07 | –0.01 | 0.15 | 1 |
| 24 | Cr | ||||||||
| 25 | Mn | 2.41 | –0.17 | 0.24 | 5 | 2.14 | –0.33 | 0.12 | 4 |
| 27 | Co | 2.49 | 0.38 | 0.13 | 3 | 2.12 | 0.12 | 0.05 | 3 |
| 28 | Ni | 3.64 | 0.20 | 0.19 | 1 | 3.05 | –0.28 | 0.15 | 2 |
| 29 | Cu | ||||||||
| 38 | Sr | 0.58 | 0.47 | 0.19 | 2 | 0.44 | 0.44 | 0.15 | 2 |
| 39 | Y | –0.22 | 0.36 | 0.46 | 6 | –0.23 | 0.46 | 0.22 | 7 |
| 40 | Zr | 0.52 | 0.72 | 0.33 | 4 | 0.29 | 0.60 | 0.18 | 3 |
| 45 | Ru | 0.13 | 1.22 | 0.15 | 1 | ||||
| 46 | Pd | ||||||||
| 56 | Ba | 0.43 | 1.02 | 0.19 | 2 | 0.22 | 0.92 | 0.15 | 2 |
| 57 | La | –0.48 | 1.11 | 0.06 | 6 | –0.84 | 0.86 | 0.08 | 5 |
| 58 | Ce | –0.19 | 0.99 | 0.09 | 7 | –0.38 | 0.91 | 0.08 | 7 |
| 59 | Pr | –0.63 | 1.38 | 0.19 | 1 | –1.09 | 1.03 | 0.15 | 1 |
| 60 | Nd | –0.06 | 1.26 | 0.12 | 9 | –0.34 | 1.09 | 0.12 | 9 |
| 62 | Sm | –0.33 | 1.50 | 0.12 | 4 | –0.65 | 1.29 | 0.19 | 4 |
| 63 | Eu | –0.59 | 1.67 | 0.01 | 3 | –0.86 | 1.51 | 0.02 | 3 |
| 64 | Gd | –0.18 | 1.54 | 0.19 | 2 | –0.40 | 1.43 | 0.34 | 3 |
| 65 | Tb | –1.16 | 1.30 | 0.19 | 2 | –1.31 | 1.26 | 0.32 | 3 |
| 66 | Dy | 0.00 | 1.64 | 0.13 | 5 | –0.21 | 1.54 | 0.14 | 5 |
| 68 | Er | –0.22 | 1.62 | 0.26 | 4 | –0.45 | 1.50 | 0.14 | 5 |
| 69 | Tm | –1.20 | 1.46 | 0.19 | 3 | –1.41 | 1.36 | 0.05 | 4 |
| 70 | Yb | –0.32 | 1.54 | 0.19 | 1 | –0.67 | 1.29 | 0.15 | 1 |
| 76 | Os | 0.46 | 1.90 | 0.19 | 1 | ||||
| 77 | Ir | ||||||||
| 90 | Th | –0.92 | 1.80 | 0.10 | 1 | –1.42 | 1.41 | 0.15 | 1 |
| 92 | U | –1.96 | 1.35 | 1 | –1.92 | 1.50 | 1 | ||
| species | [Fe/H] | r.s.s. | ||||||||||
|---|---|---|---|---|---|---|---|---|---|---|---|---|
| Mg I | +0.12 | 0.13 | +0.08 | 0.08 | 0.03 | +0.01 | 0.07 | 0.09 | 0.17 | |||
| Al I | +0.11 | 0.13 | +0.06 | 0.06 | 0.07 | +0.03 | 0.31 | 0.33 | 0.36 | |||
| Si I | +0.12 | 0.12 | +0.02 | 0.01 | 0.03 | +0.01 | 0.12 | 0.09 | 0.15 | |||
| Ca I | +0.08 | 0.08 | +0.02 | 0.01 | 0.02 | +0.01 | +0.11 | 0.08 | 0.11 | |||
| Sc II | +0.06 | 0.06 | 0.09 | +0.10 | +0.02 | +0.00 | +0.12 | 0.07 | 0.13 | |||
| Ti I | +0.13 | 0.14 | +0.02 | 0.02 | 0.03 | +0.01 | +0.08 | 0.05 | 0.14 | |||
| Ti II | +0.05 | 0.05 | 0.08 | +0.09 | +0.00 | +0.01 | +0.26 | 0.19 | 0.21 | |||
| V I | +0.14 | 0.14 | +0.03 | 0.01 | 0.02 | +0.00 | +0.02 | 0.01 | 0.14 | |||
| V II | +0.05 | 0.04 | 0.09 | +0.10 | +0.02 | 0.01 | +0.03 | 0.02 | 0.12 | |||
| Cr I | +0.14 | 0.16 | +0.04 | 0.04 | 0.07 | +0.03 | +0.44 | 0.31 | 0.35 | |||
| Cr II | +0.00 | +0.01 | 0.11 | +0.11 | +0.01 | 0.00 | +0.01 | 0.01 | 0.11 | |||
| Mn I | +0.13 | 0.15 | +0.03 | 0.03 | 0.05 | +0.02 | +0.23 | 0.17 | 0.22 | |||
| Fe I | +0.12 | 0.14 | +0.05 | 0.04 | 0.04 | +0.02 | +0.17 | 0.16 | 0.21 | |||
| Co I | +0.13 | 0.15 | +0.03 | 0.03 | 0.05 | +0.01 | +0.36 | 0.20 | 0.25 | |||
| Ni I | +0.14 | 0.18 | +0.05 | 0.05 | 0.09 | +0.03 | +0.46 | 0.42 | 0.46 | |||
| Sr II | +0.05 | 0.07 | 0.06 | +0.05 | 0.01 | +0.02 | +0.16 | 0.22 | 0.23 | |||
| Y II | +0.07 | 0.07 | 0.09 | +0.09 | +0.02 | 0.00 | +0.15 | 0.08 | 0.14 | |||
| Zr II | +0.06 | 0.07 | 0.09 | +0.09 | +0.02 | 0.01 | +0.05 | 0.03 | 0.12 | |||
| Ba II | +0.11 | 0.12 | 0.07 | +0.06 | 0.03 | +0.04 | +0.46 | 0.37 | 0.39 | |||
| La II | +0.08 | 0.08 | 0.09 | +0.10 | +0.02 | 0.01 | +0.04 | 0.02 | 0.13 | |||
| Pr II | +0.08 | 0.08 | 0.09 | +0.10 | +0.03 | 0.01 | +0.02 | 0.01 | 0.13 | |||
| Nd II | +0.08 | 0.08 | 0.09 | +0.10 | +0.03 | 0.01 | +0.03 | 0.02 | 0.13 | |||
| Sm II | +0.09 | 0.08 | 0.09 | +0.11 | +0.03 | 0.01 | +0.01 | +0.00 | 0.14 | |||
| Eu II | +0.08 | 0.09 | 0.09 | +0.09 | +0.02 | 0.02 | +0.01 | 0.01 | 0.14 | |||
| Gd II | +0.08 | 0.09 | 0.09 | +0.10 | +0.02 | 0.01 | +0.05 | 0.03 | 0.13 | |||
| Dy II | +0.08 | 0.08 | 0.09 | +0.10 | +0.03 | 0.01 | +0.02 | 0.01 | 0.13 | |||
| Th II | +0.10 | 0.09 | 0.10 | +0.10 | +0.00 | 0.02 | +0.00 | +0.00 | 0.14 | |||
| Object name | s.s. r-process | s.s. total | ||||
|---|---|---|---|---|---|---|
| HD 6268 | 2.08 | 0.18 | 2.34 | 0.18 | 0.13 | |
| HD 110184 | 2.58 | 0.24 | 2.84 | 0.22 | 0.15 | |
| HD 115444 | 2.16 | 0.18 | 2.42 | 0.22 | 0.11 | |
| HD 186478 | 1.89 | 0.10 | 2.17 | 0.25 | 0.12 | |
| CS 22892–052 | 1.43 | 0.13 | 1.69 | 0.24 | 0.15 | |
| CS 30306–132 | 1.45 | 0.15 | 1.73 | 0.24 | 0.14 | |
| CS 31082–001 | 1.16 | 0.12 | 1.42 | 0.23 | 0.15 | |