Long-term IR Photometry of Seyferts
Abstract
Long-term (up to 10000d) monitoring has been undertaken for 41 Seyferts in the near infrared (1.25 – 3.45m). All but two showed variability, with amplitudes at in the range 0.1 to 1.1 mag. The timescale for detectable change is from about one week to a few years.
Where contemporary observations of variability in x-rays, UV or visible light exist, it is found that the near-infrared varies in a similar way, though in some cases the shorter-wavelength IR bands are diluted by underlying galaxy radiation.
A simple cross-correlation study indicates that there is evidence for delays of up to several hundred days between the variations seen at the shortest wavelengths ( or ) and the longest () in many galaxies. In particular, the data for Fairall 9 now extend to twice the interval covered in earlier publications and the delay between its UV and IR outputs is seen to persist.
An analysis of the fluxes shows that, for any given galaxy, the colours of the variable component of its nucleus are usually independent of the level of activity. The state of activity of the galaxy can be parameterized.
Taken over the whole sample, the colours of the variable components fall within moderately narrow ranges. In particular, the colour is appropriate to a black body of temperature 1600K. The excess for a heavily reddened nucleus can be determined and used to find , which can be compared to the values found from the visible region broad line ratios.
Using flux-flux diagrams, the flux within the aperture from the underlying galaxies can often be determined without the need for model surface brightness profiles. In many galaxies it is apparent that there must be an additional constant contribution from warm dust.
keywords:
galaxies: Seyfert – active – nuclei – photometry1 INTRODUCTION
This programme was started with the aim of making a reliable study of the variability of Seyfert galaxies in the near infrared ( bands; 1.25, 1.65, 2.2 and 3.45m). Previous work had indicated that some Seyfert galaxies do vary, but the data remained somewhat sparse and controversial. At the commencement of the programme it was believed, for example, that Seyfert 1 galaxies varied but Seyfert 2 galaxies did not. A 450-day programme by Penston et al (1974) appeared to confirm this viewpoint. Lebofsky & Rieke (1980) reported on variations observed in several Seyferts, of which that in 3C 120 was the most spectacular, but the numbers of observations were very limited.
Some results from this programme have already been published. One of the most unexpected was the discovery by Clavel, Wamsteker and Glass (1989) that there was a delay of 400 days between the UV variations of Fairall 9 and the response of its infrared output. This was satisfactorily interpreted according to a dust reverberation model (Barvainis, 1987). NGC 1566 showed a delay of 2 1 month between the UV and the IR (Baribaud et al, 1992). Similarly, a possible delay of d was seen in NGC 3783 (Glass, 1992). The infrared output of NGC 1068 was shown to have increased by a factor of two between the early 1970s and 1995 by Glass (1995). The galaxy NGC 2992 showed an energetic flare-like outburst with a decay time of about 900d (Glass, 1997a) and NGC 7469 showed a dramatic but relatively short-lived decline in its nuclear energy output in October 1989 (Glass 1998).
More recently, Salvati et al (1993) observed an outburst in NGC 4051 and Nelson (1996) reported one in Mkn 744, with a 32 7 day delay between the visible and IR light curves. Oknyanskij & Horne (2001) have re-examined the published data and concluded that the observed delays are consistent with dust sublimation radii . Oknyanskij (2002) includes two additional objects. The angular diameter of the dust ring or shell as viewed fron the earth is of order tenths of milliarcsec.
Throughout this paper it is assumed that the excess infrared radiation from a Seyfert when compared to a less active galaxy comes from dust that is heated by ultraviolet radiation originating near a central massive black hole. It is usually assumed that this dust is distributed in a torus; e.g., Pier & Krolik (1992). The maximum temperature that dust can reach without sublimating, in the neighbourhood of 1600K, together with the ultraviolet luminosity of the nucleus, sets the inner radius of its distribution and the corresponding light travel time gives the delay in the response of a dust grain to a change in the ultraviolet flux from the nucleus.
During part of the present programme, photometry was obtained by Winkler et al (1992), Winkler (1997) and other observers.
2 Observations
The choice of galaxies to observe was very simple: only a few southern Seyferts were known at the start of the programme. As others were discovered, by examination of the ESO and UK Schmidt plates or from x-ray satellites, they were included. The -band luminosities (calculated from the redshifts and the fluxes seen through a 12 arcsec diameter aperture) range over three orders of magnitude. It will be seen later that the proportion of nuclear to underlying galaxy fluxes also covers a large range.
Nearly all the observations were made with the MkIII infrared photometer attached to the 1.9m telescope at Sutherland. The aperture was normally 12 arcsec diameter. In some cases, observations were made at 9 arcsec diameter to improve the signal-to-noise ratio at slight expense to the systematic accuracy. The chopper throw was 30 arcsec, alternately north and south of the object position. The same filters were used throughout the programme.
Some of the earliest observations were made with the MkI infrared photometer, which used the same filters but had chopper throws of 12 or 60 arcsec, also in the N–S direction.
Standard stars were taken from Carter (1990), whose measures were transformed to the natural system of the photometer using the empirical relation . The other bands were taken to be the same on both systems. The results were placed on the Carter system using the inverse transformation.
Table 1 lists the galaxies included in the survey. The positions, redshifts, Seyfert types, , and were taken from Véron-Cetty & Véron (2000). The absorption arising in our own galaxy was calculated from the NASA/IPAC Database Extinction Calculator on the Worldwide Web, which is based on Schlegel, Finkbeiner & Davis (1998). The columns and are the overall observed amplitudes observed at and , respectively. It should be noted that these two quantities are sensitive to errors in individual measurements, and are, in effect, upper limits. The column ‘No’ gives the number of observations of each object. The last three columns give the average dereddened near-IR colours.
Observations were usually made four times per year over periods of a week. Usually a given galaxy could be observed three times per year, with one or two repeats within a few days. In a few cases, several observations were made over a short period as part of international multi-wavelength campaigns.
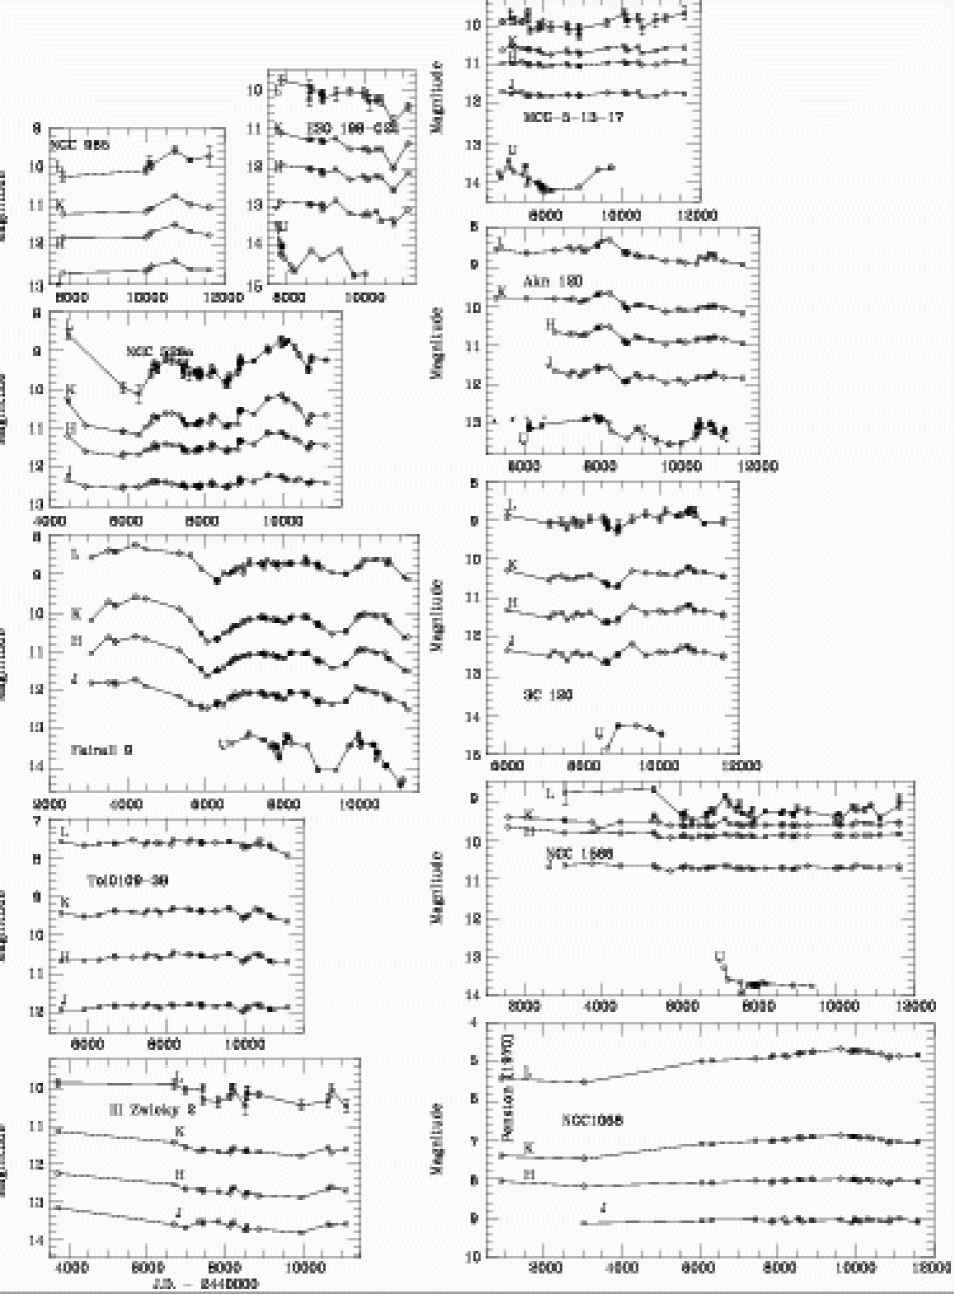
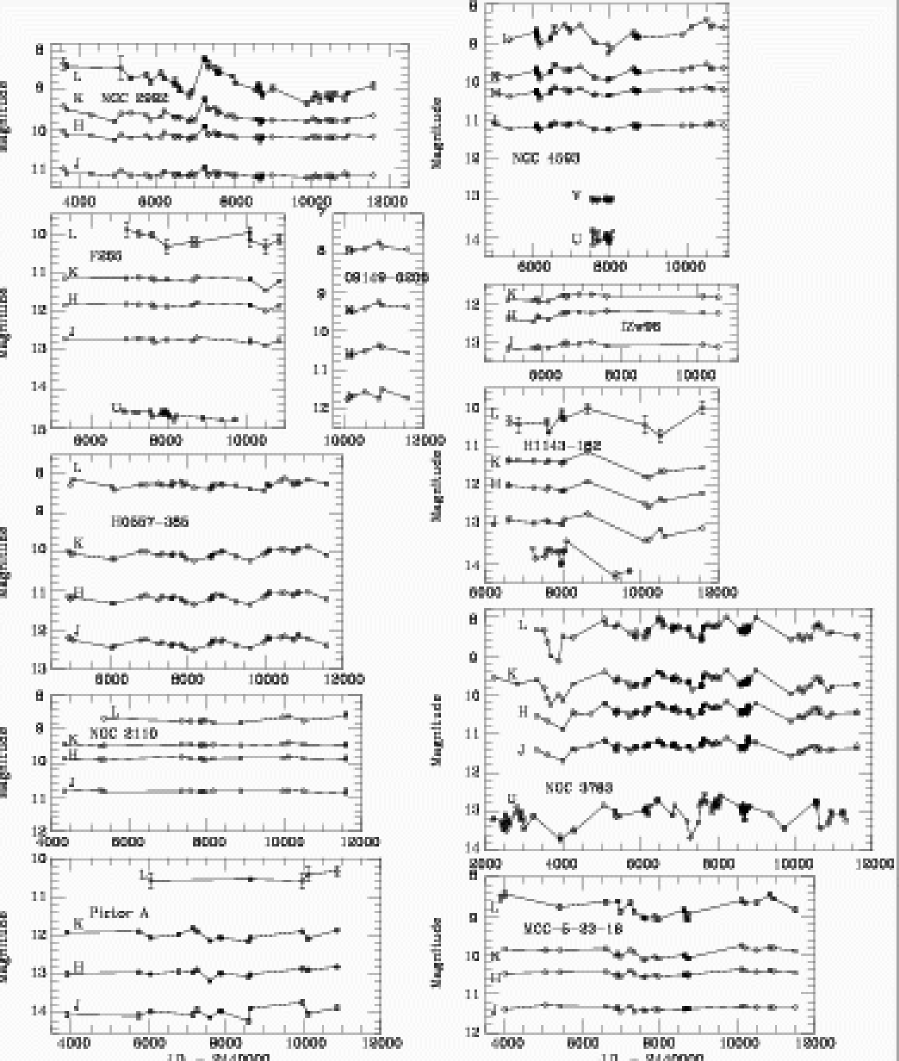
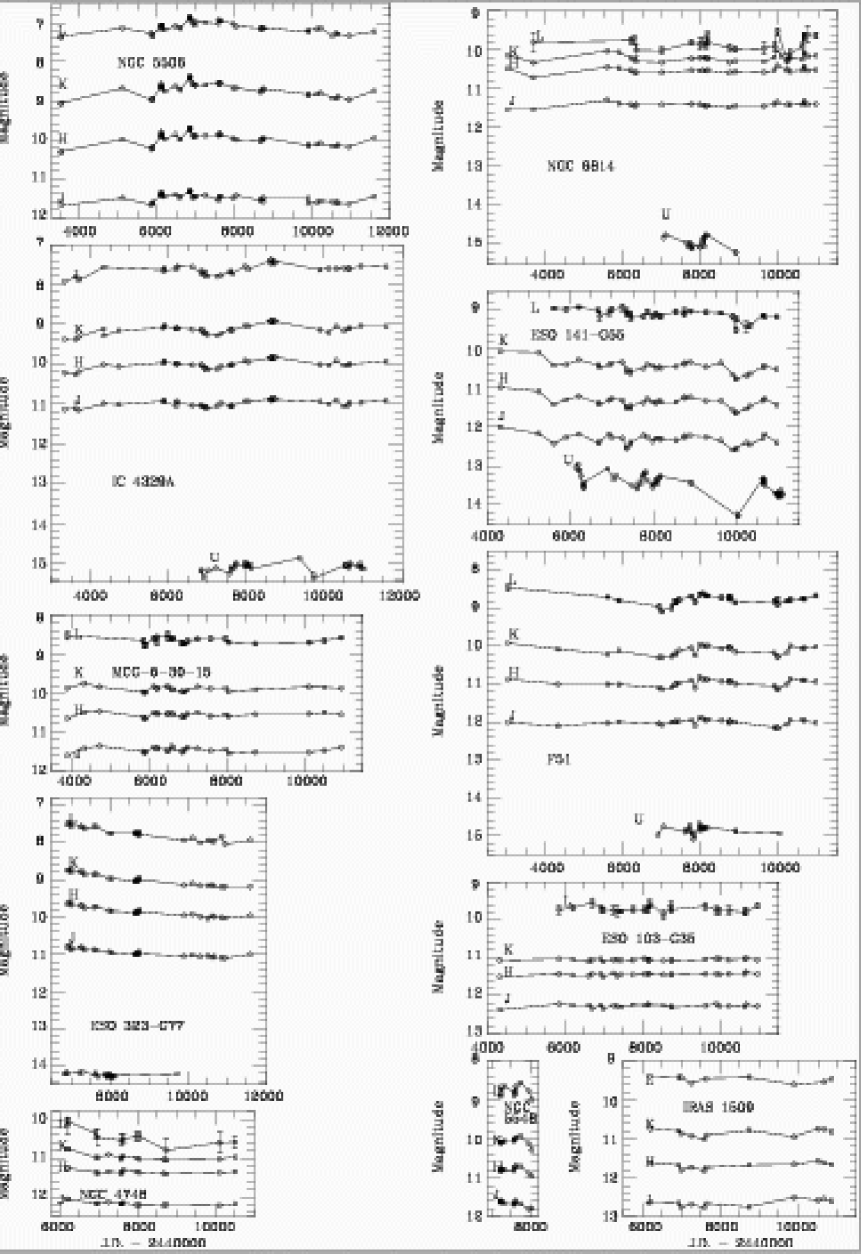
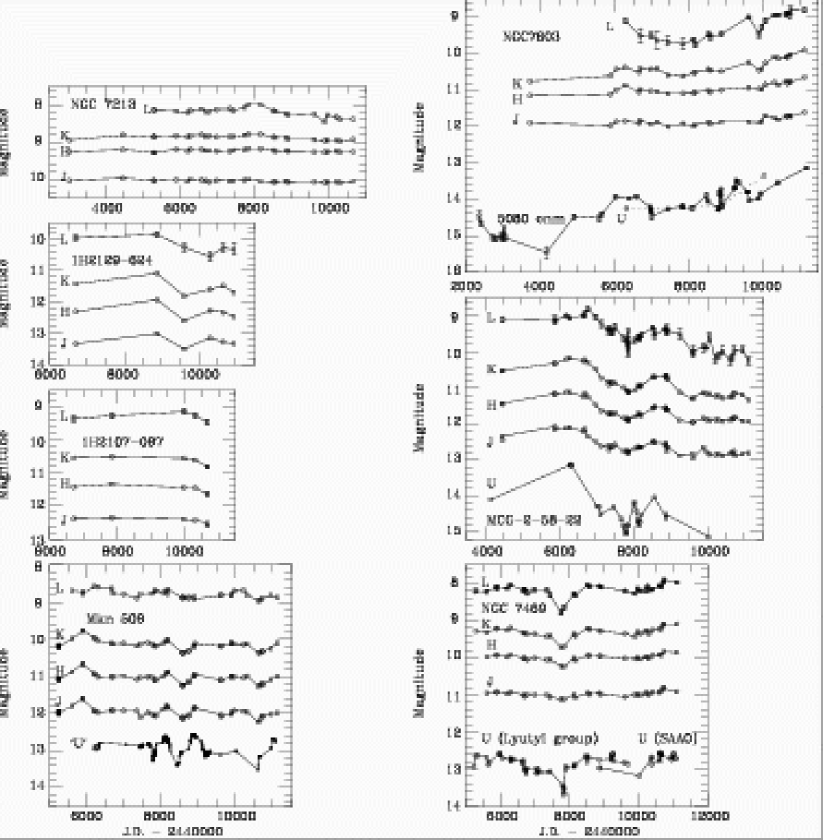
Figs 2 a,b,c,d show the observations plotted against time. The same time and magnitude scales are employed throughout, for ease of comparison. Additional data obtained by other workers in the band have been included in several cases. The error bars have been plotted only when they are expected to be substantial. Normally, the standard errors at , arising from the standard stars and the uncertainties in the extinctions, are expected to be 0.03 mag and, at , 0.05 mag. In general, these are the dominant errors. However, at the signal-to-noise ratio was reduced and observations were usually limited to about 320 sec of integration, so that the final errors may be higher than 0.05 mag, especially when 9.
The observations are available at the end of this version of the paper.
| Name | R.A.1 (2000) Dec. | z1 | type1 | No. | - | - | - | |||||||||
|---|---|---|---|---|---|---|---|---|---|---|---|---|---|---|---|---|
| III Zwicky 2 | 00 | 10 | 31.0 | +10 | 58 | 28 | .090 | S1.2 | 23.72 | .082 | .66 | .68 | 17 | 0.91 | 1.09 | 1.45 |
| Tol 0109-38 | 01 | 11 | 27.7 | –38 | 05 | 01 | .011 | S1.9 | 22.88 | .014 | .21 | .34 | 31 | 1.27 | 1.14 | 1.76 |
| F9 | 01 | 23 | 45.8 | –58 | 48 | 21 | .045 | S1.2 | 23.66 | .020 | .78 | 1.15 | 71 | 1.00 | 0.91 | 1.45 |
| NGC526A | 01 | 23 | 54.4 | –35 | 03 | 56 | .019 | S1.9 | 22.69 | .022 | .26 | 1.01 | 52 | 0.96 | 0.74 | 1.31 |
| NGC985 | 02 | 34 | 37.8 | –08 | 47 | 15 | .043 | S1.5 | 23.18 | .030 | .31 | .48 | 7 | 0.89 | 0.66 | 1.13 |
| ESO 198-G24 | 02 | 38 | 19.7 | –52 | 11 | 32 | .045 | S1.0 | 23.10 | .033 | .62 | .92 | 18 | 0.90 | 0.74 | 1.23 |
| NGC1068 | 02 | 42 | 40.7 | –00 | 00 | 47 | .003 | S1h | 22.88 | .030 | .12 | .60 | 27 | 1.01 | 1.03 | 2.16 |
| NGC1566 | 04 | 20 | 00.7 | –54 | 56 | 17 | .004 | S1.5 | 21.37 | .008 | .14 | .28 | 42 | 0.83 | 0.29 | 0.42 |
| 3C120 | 04 | 33 | 11.1 | +05 | 21 | 15 | .033 | S1.5 | 23.31 | .297 | .50 | .53 | 30 | 0.93 | 0.90 | 1.41 |
| Akn 120 | 05 | 16 | 11.4 | –00 | 09 | 00 | .033 | S1.0 | 23.44 | .109 | .40 | .52 | 32 | 0.96 | 0.82 | 1.28 |
| MCG-5-13-172 | 05 | 19 | 35.6 | –32 | 39 | 30 | .013 | S1.5 | 22.12 | .017 | .15 | .23 | 25 | 0.77 | 0.36 | 0.70 |
| Pic A3 | 05 | 19 | 44.3 | –45 | 46 | 50 | .034 | S1.5 | - | .043 | .42 | .33 | 14 | 1.00 | 0.96 | |
| NGC2110 | 05 | 52 | 11.4 | –07 | 27 | 23 | .020 | S1i | 22.99 | .375 | .09 | .10 | 15 | 0.85 | 0.34 | 0.69 |
| H0557-383 | 05 | 58 | 02.1 | –38 | 20 | 05 | .034 | S1.2 | 23.61 | .046 | .35 | .37 | 33 | 1.14 | 1.11 | 1.78 |
| F265 | 06 | 56 | 17.3 | –65 | 33 | 48 | .029 | S1.2 | 22.74 | .082 | .20 | .22 | 12 | 0.87 | 0.65 | 1.07 |
| IRAS09149-6206 | 09 | 16 | 09.5 | –62 | 19 | 29 | .057 | S1 | 24.32 | .182 | .24 | .26 | 7 | 1.08 | 1.09 | 1.52 |
| NGC2992 | 09 | 45 | 42.0 | –14 | 19 | 35 | .008 | S1.9 | 22.17 | .060 | .38 | .65 | 52 | 0.98 | 0.52 | 0.84 |
| MCG-5-23-164 | 09 | 47 | 40.2 | –30 | 56 | 54 | .008 | S1.9 | 22.16 | .108 | .19 | .37 | 25 | 0.86 | 0.51 | 1.17 |
| NGC3783 | 11 | 39 | 01.8 | –37 | 44 | 19 | .009 | S1.5 | 22.44 | .119 | .63 | .90 | 95 | 0.86 | 0.72 | 1.31 |
| H1143-1825 | 11 | 45 | 40.6 | –18 | 27 | 17 | .033 | S1.5 | 22.77 | .039 | .70 | .66 | 14 | 0.85 | 0.70 | 1.09 |
| I Zwicky 96 | 12 | 00 | 43.3 | –20 | 50 | 01 | .062 | S1 | - | .051 | .18 | .19 | 13 | 0.78 | 0.44 | |
| NGC4593 | 12 | 39 | 39.4 | –05 | 20 | 39 | .009 | S1.0 | 22.26 | .025 | .17 | .40 | 41 | 0.88 | 0.52 | 0.94 |
| NGC47486 | 12 | 53 | 12.4 | –13 | 24 | 53 | .014 | S1n | 21.95 | .050 | .16 | .28 | 14 | 0.79 | 0.38 | 0.43 |
| ESO 323-G77 | 13 | 06 | 26.6 | –40 | 24 | 42 | .015 | S1.2 | 23.12 | .101 | .31 | .49 | 27 | 1.09 | 0.84 | 1.22 |
| MCG-6-30-15 | 13 | 35 | 53.4 | –34 | 17 | 48 | .008 | S1.5 | 22.21 | .062 | .18 | .18 | 25 | 0.88 | 0.66 | 1.25 |
| IC4329A | 13 | 49 | 19.3 | –30 | 18 | 34 | .016 | S1.2 | 23.22 | .059 | .29 | .46 | 38 | 0.97 | 0.87 | 1.48 |
| NGC5506 | 14 | 13 | 14.8 | –03 | 12 | 26 | .007 | S1i | 22.71 | .060 | .37 | .70 | 43 | 1.50 | 1.27 | 1.59 |
| NGC5548 | 14 | 17 | 59.6 | +25 | 08 | 13 | .017 | S1.5 | 22.81 | .020 | .22 | .19 | 12 | 0.86 | 0.72 | 1.29 |
| IRAS15091-2107 | 15 | 11 | 59.8 | –21 | 19 | 02 | .044 | S1n | 23.36 | .118 | .26 | .27 | 10 | 0.92 | 0.82 | 1.33 |
| ESO 103-G35 | 18 | 38 | 20.3 | –65 | 25 | 42 | .013 | S1.9 | 22.20 | .076 | .16 | .09 | 25 | 0.81 | 0.37 | 1.32 |
| F51 | 18 | 44 | 54.0 | –62 | 21 | 53 | .014 | S1.5 | 22.65 | .108 | .29 | .37 | 29 | 1.00 | 0.84 | 1.34 |
| ESO 141-G55 | 19 | 21 | 14.3 | –58 | 40 | 13 | .037 | S1.2 | 23.36 | .111 | .59 | .71 | 34 | 0.94 | 0.89 | 1.35 |
| NGC6814 | 19 | 42 | 40.7 | –10 | 19 | 24 | .006 | S1.5 | 21.50 | .183 | .19 | .32 | 24 | 0.83 | 0.29 | 0.40 |
| Mkn 509 | 20 | 44 | 09.7 | –10 | 43 | 24 | .035 | S1.5 | 23.43 | .057 | .65 | .62 | 46 | 0.91 | 0.88 | 1.35 |
| 1H2107-097 | 21 | 09 | 09.8 | –09 | 40 | 17 | .027 | S1.2 | 23.00 | .233 | .26 | .33 | 7 | 0.90 | 0.79 | 1.29 |
| 1H2129-624 | 21 | 36 | 23.2 | –62 | 24 | 00 | .059 | S1.5 | 23.33 | .037 | .49 | .72 | 6 | 0.94 | 0.80 | 1.31 |
| NGC7213 | 22 | 09 | 16.4 | –47 | 10 | 01 | .006 | S3b | 22.14 | .015 | .12 | .18 | 26 | 0.81 | 0.36 | 0.68 |
| NGC7469 | 23 | 03 | 15.6 | +08 | 52 | 26 | .017 | S1.5 | 23.05 | .069 | .31 | .63 | 32 | 0.96 | 0.67 | 1.12 |
| MCG-2-58-22 | 23 | 04 | 43.5 | –08 | 41 | 08 | .048 | S1.5 | 23.44 | .042 | .87 | 1.17 | 49 | 0.94 | 0.80 | 1.31 |
| NGC7603 | 23 | 18 | 56.7 | +00 | 14 | 38 | .029 | S1.5 | 23.09 | .046 | .40 | .87 | 26 | 0.89 | 0.59 | 1.05 |
Notes: Positions, redshifts and Seyfert types taken from Véron-Cetty & Véron (2000). Pic A and NGC 7213 have broad Balmer lines, but also exceptionally strong [OI] and many other typical liner characteristics. In the blue, NGC 2110 looks like a type 2, but near H it has the spectrum of a liner (Winkler, private communication).
The values are taken from the NASA/IPAC Database Extinction Calculator on the World Wide Web, which is based on Schlegel et al (1998).
The average luminosity at , seen throught the 12 arcsec diameter aperture, is given in units of log WHz-1 in the column marked , taking as 65 km s-1pc-1.
, are maximum amplitude ranges observed.
etc are the unweighted averaged de-reddened colours.
1These columns are from Véron-Cetty & Véron (2000).
2Given by Véron-Cetty & Véron (2000) as ESO362-G18
3Given by Véron-Cetty & Véron (2000) as PKS0518-45.
4Given by Véron-Cetty & Véron (2000) as ESO434-G40.
5Given by Véron-Cetty & Véron (2000) as NPM1G-18.0386.
6Better known as IRAS1249-131
3 Average near-IR colours
The average, unweighted, de-reddened colours of the galaxies in the sample are given in the right-most columns of Table 1. De-reddening was carried out according to the relations
The and colours of ‘inactive’, or early-type galaxies without obvious emission lines, on the same photometric system as that used here, are typically around 0.78 and 0.22 (Glass, 1984). The colour (in the absence of dust emission) has been taken to be 0.22, based on the similarity of and colours for late-type stars (Glass, 1997c)
A few of the sample, NGC 1566, MCG-5-13-17, NGC 2110, I Zw 96, NGC 4748, NGC 6814 and NGC 7213, show and colours only moderately redder than inactive galaxies. This can also be seen in the vertical spacing of their light curves in Fig 2. When quiescent, the light curve of a galaxy such as NGC 1566 is so close to the curve that there is obviously no excess. NGC 4748 and NGC 6814 also revert to inactive colours during minima. Their nuclear fluxes are assumed to be swamped by the stellar fluxes of the underlying galaxies at and , but may become more conspicuous at longer wavelengths because their spectral energy distributions rise and overcome the Rayleigh-Jeans tails of the stellar fluxes.
excesses are seen at all times in MCG-5-13-17, NGC 2110 and NGC 7213, indicating continuous nuclear activity. NGC 7213 has positive , indicating that its nucleus is heavily reddened.
On the other hand, in the case of ESO 103-G35, the and light curves are far apart, implying a considerable excess in spite of a lack of variability. Since its colour is normal, the excess must arise from a blackbody of about 800K or less. A positive implies that its nucleus may be heavily reddened.
Most of the remainder of the sample show well-developed infrared excesses.
4 Variability Patterns
The galaxies of the sample do not show variability on a night-to-night basis, within the limits of the photometry. The only ones which may not have varied at all are NGC 2110 and ESO 103-G35. Most show smooth behaviour on a timescale of years, but some show shorter-term fluctuations. The most conspicuous of the latter is NGC 3783. An active galaxy is thus more likely to be revealed by IR variability than by broad emission lines, which may be hidden from view by extinction within the host galaxy.
As already mentioned, two very interesting cases of large amplitude short-term events are seen in NGC 2992, which seems to have experienced a substantial outburst (Glass, 1997a) and NGC 7469, whose nuclear source virtually shut off for a short period (Glass, 1998).
Some galaxies show major changes over the long term. For example, the archetype S2 galaxy NGC 1068 doubled in flux over about 20 years. NGC 4748 has become fainter over 2000d and ESO 323-G77 over 5000d. MCG-2-58-22 has declined by over a magnitude in 5000d, though not monotonically.
Otherwise, major variations, of more than one mag, have been seen in Fairall 9 and NGC 526a. Fairall 9 shows a delay between its UV output and its flux, which can be detected even between the and bands. This has been satisfactorily explained in terms of dust-reprocessing by Clavel, Wamsteker & Glass (1989), using a model put forward by Barvainis (1987). The delay continues to exist in data obtained since the completion of the earlier work.
In many cases, the variability is most apparent at the longer wavelengths, especially . This can have two causes, swamping at short wavelengths by the underlying galaxy in the 12 arcsec diameter aperture (as mentioned) and circumnuclear reddening, which is almost certainly present in NGC 1068.
Some constraint on the size of the emitting regions can be obtained from the timescale on which substantial variations can occur. If a dust re-emission model is accepted, the material may be distributed at different distances from the nucleus of the active galaxy and at arbitrary angles. Thus, the infrared response to an instantaneous change in the ultraviolet [e.g., ] will usually be smeared out. Only in the case of a ring of dust perpendicular to the line of sight can a very sharp response be expected (Barvainis, 1992).
5 Search for delays
A number of the galaxies in the present paper have been monitored at shorter wavelengths for various lengths of time and some of this work is included in Fig 2. The variations in tend to have higher amplitude and possibly shorter time scales than those at infrared wavelengths.
Delays between the short-wavelength light curve(s), thought to be indicative of the UV flux from the central engine, and the flux originating in the dust that it is heating, have been looked for using a simple cross-correlation programme based on the interpolation method of Gaskell & Peterson (1987). It should be emphasized that there are many opinions as to the best method for finding delays in cases where the data are irregularly spaced. A more detailed analysis will be carried out in a future paper.
The Gaskell & Peterson method was applied to those galaxies with significant variability and many data points. Ideally, the data should have been sampled at regular intervals, shorter than the expected delay times, for this procedure to be reliable. The programme first interpolates the longest wavelength photometry to give values for each day as well as extrapolating its starting and stopping values as constants for 1000 days before and after the series. Each light curve is shifted by a constant to have average value 0 and divided so as to have rms deviation 1. The cross-correlation is performed for the dates of the shorter-wavelength observations, using a range of 1000 days in each direction. The correlogram is divided by its maximum value so that the maximum of the peak is 1.0. Some of the causes that may distort the correlogram are (a) insufficient sampling (b) long gaps in the data, particularly if these coincide with enhanced activity (deviation from flat behaviour) (c) closely-clustered measurements, which cause over-weighting of certain sections of the non-interpolated sequences (d) an amplitude of variation that is not much greater than the noise, such as occurs at the wavelength in some galaxies (e) noise (f) correlated errors from sampling of the two wavelengths quasi-simultaneously and (f) extrapolation of the data before and after the series, as described. No attempt was made to correct the data for these effects, except that some early and very sparsely sampled data were removed in a few cases. Allowances for these problems will be made in future analysis work, when possible.
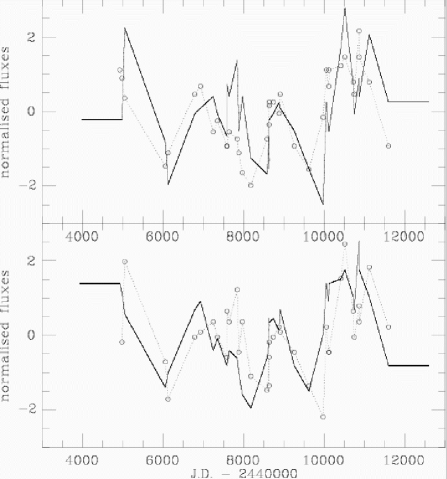
The procedure is carried out twice, exchanging the two data sets, so that in the second case the shorter-wavelength data are interpolated instead of the longer. The position of the peak is taken to be the centre of the correlogram measured at the vertical level of 0.8 to avoid sometimes spiky peaks. The results are presented in Table 2. The technique used is known to be lacking in mathematical rigour, and can only be justified by the fact that almost all galaxies tried show some degree of delay between the or and the light curves. To check the input data the shifted and divided data sets were plotted for inspection. In some cases the delay is obvious to the eye; fig 1 is an example of such a plot, for H0557-383. The vs cross-correlation gives 310d and the vs gives –300d. Averaging these two implies a delay of about 305d. The longer delays are likely to be the most certain and the shorter ones should be regarded as indicative only. If the cross-correlation has multiple peaks at the 0.8 level or greater it is rejected. In the case of MCG-2-58-22 the autocorrelation function was very broad, as were the cross-correlation peaks, although suggestive of a delay of several hundred days.
There is no guarantee that the delay between the ultraviolet and the infrared response is a constant quantity. The evaporation of dusty clouds near an AGN has been considered by Pier & Voit (1995) and it is clear that a prolonged period of high activity will cause the inner edge of the dust torus to retreat, increasing the propagation time for the UV radiation. According to Barvainis (1992), for an equilibrium situation, the radius within which particles will evaporate is
where is the UV luminosity in units of , is the UV optical depth of the cloud, is the temperature of the hottest grains and is the grain radius in m.
The present data show that long-term secular variations in the average infrared luminosity of Seyfert galaxies are quite common. Their UV luminosity is probably also variable, so that the Barvainis (1992) relation given above should be applied with caution if at all.
A possibility for further work, pointed out by Dr V.L. Oknyanskij (private communication), would be to concentrate on the -band emission, which is likely to be more representative of the hottest dust component and may show a more precise response to ultraviolet variations than .
| Name | bands | delay | bands | delay | average1 |
| (days) | (days) | (days) | |||
| III Zwicky 2 | - | ||||
| Tol 0109-38 | +100 | -90 | 95 | ||
| F9 | +500 | -440 | 470 | ||
| F9 | +370 | -370 | 370 | ||
| NGC526A | +120 | -250 | 185 | ||
| NGC985 | - | ||||
| ESO 198-G24 | - | ||||
| NGC1068 | - | ||||
| NGC1566 | - | ||||
| 3C120 | +160 | -160 | 160 | ||
| Akn 120 | +120 | 0 | 60 | ||
| Akn 120 | +250 | -380 | 315 | ||
| MCG-5-13-17 | - | ||||
| Pic A | - | ||||
| NGC2110 | - | ||||
| H0557-383 | +310 | -300 | 305 | ||
| F265 | - | ||||
| IRAS09149-6206 | - | ||||
| NGC2992 | 0 | -70 | 35 | ||
| MCG-5-23-16 | - | ||||
| NGC3783 | 185 | -110 | 148 | ||
| NGC3783 | 200 | -170 | 185 | ||
| H1143-182 | - | ||||
| I Zwicky 96 | - | ||||
| NGC4593 | 110 | 0 | 55 | ||
| NGC4748 | - | ||||
| ESO 323-G77 | - | ||||
| MCG-6-30-15 | 47 | -20 | 34 | ||
| IC4329A | 2 | 135 | 70 | 33 | |
| IC4329A | 2 | 150 | -20 | 85 | |
| NGC5506 | -10 | -503 | 25 | ||
| NGC5548 | - | ||||
| IRAS15091-2107 | - | ||||
| ESO 103-G35 | - | ||||
| F51 | 20 | -10 | 15 | ||
| ESO 141-G55 | 180 | -280 | 230 | ||
| ESO 141-G55 | 210 | -100 | 155 | ||
| NGC6814 | 80 | 0 | 40 | ||
| Mkn 509 | - | ||||
| 1H2107-097 | - | ||||
| 1H2129-624 | - | ||||
| NGC7213 | - | ||||
| NGC7469 | 30 | -12 | 21 | ||
| NGC7469 | 110 | +30 | 40 | ||
| MCG-2-58-22 | 270 | -500 | 155 | ||
| NGC7603 | - |
Notes:
1 The ‘average’ column gives the average of the two ‘delay’ columns, for a delay in the sense long wavelength - short wavelength.
2 The CCFs are asymmetric. At the usual level of 0.8 the delay is 33 d and at 0.7 it is 85 d.
3 The vs CCF is asymmetric. The delay is 0 at the peak.
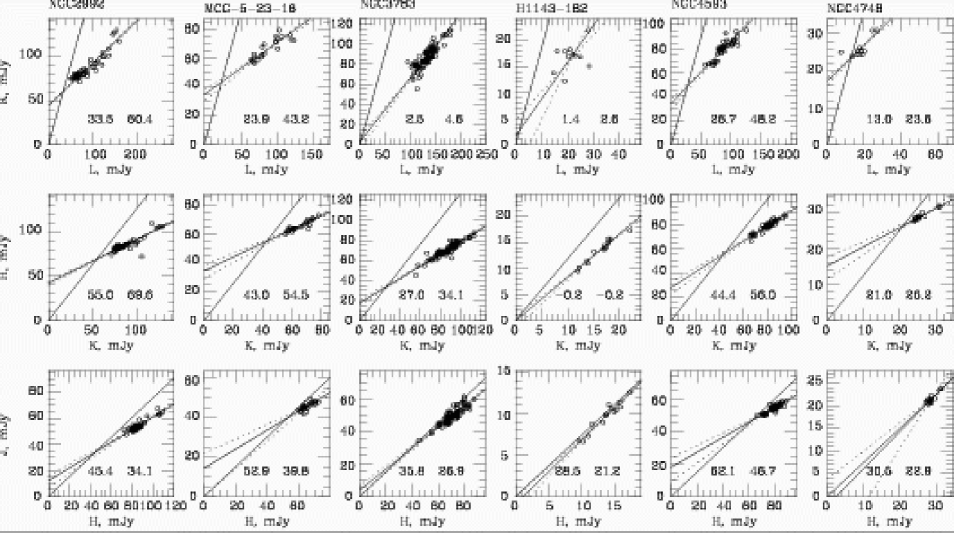
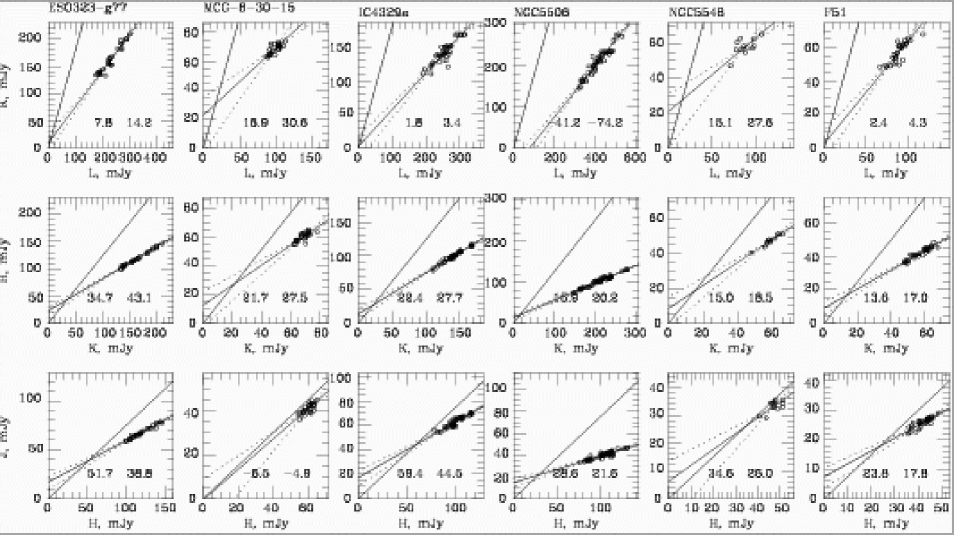
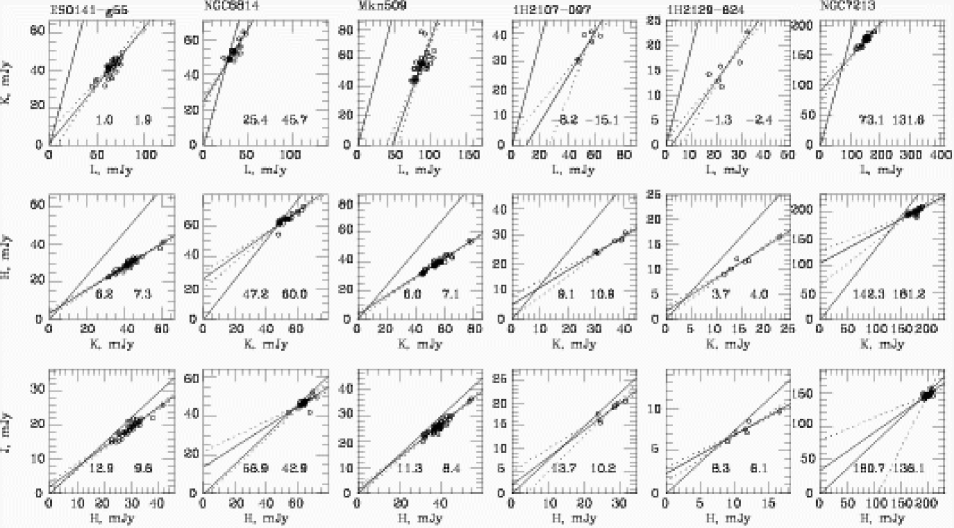
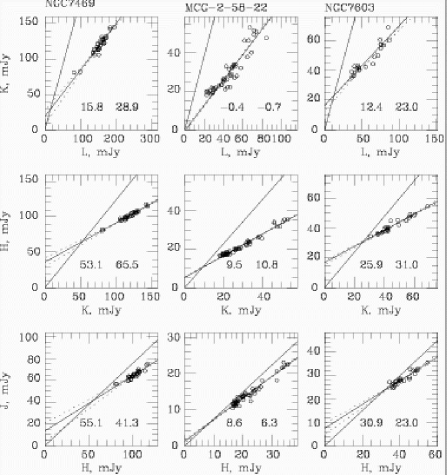
6 Spectral Energy Distributions of the Variable Components
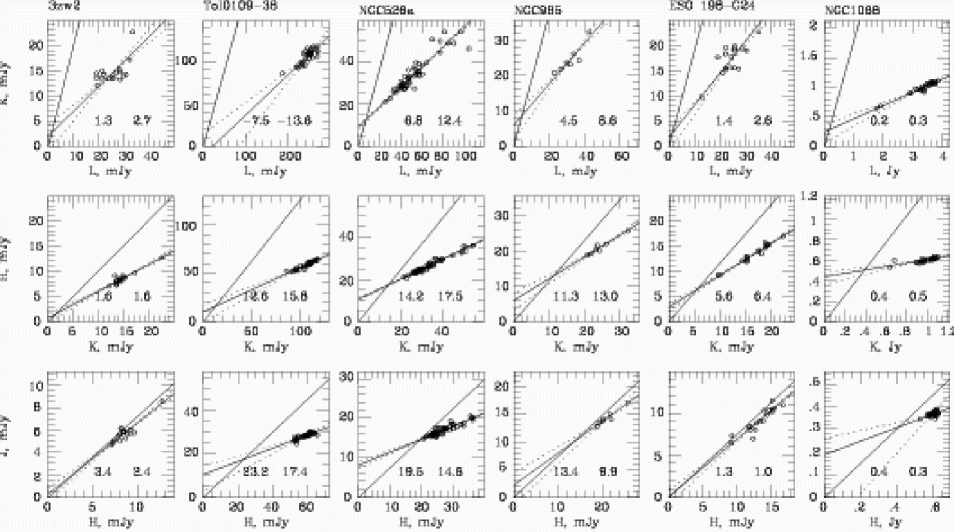
In the spectral region Winkler et al (1992) (see also Winkler, 1997) found that the fluxes from many Seyferts, when plotted against each other on linear scales, follow clear linear relationships. This effect had been observed previously by Chołoniewski (1981) in NGC 4151 and a number of other active galaxies, QSOs and BL Lac objects. The implication is that the spectral energy distribution of the variable component is constant with time in a given galaxy and does not change with the level of activity. The slopes obtained from the linear flux-flux diagrams can be expressed as colours and it is found that they have some tendency to have values that are independent of the galaxy being considered. Galaxies with nuclei that are clearly perceived to be obscured have redder variable components.
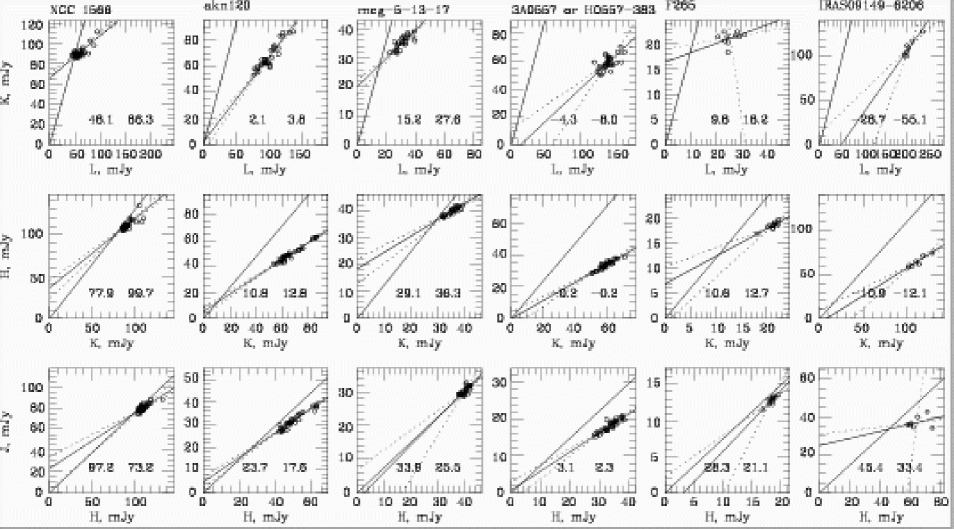
The colours of the variable components have also been found to stay constant or very nearly constant in the near-infrared (Glass, 1992), and a number of examples have already been published: NGC 3783 (Glass 1992), NGC 1068 (Glass 1995), NGC 2992 (Glass 1997a) and NGC 7469 (Glass 1998). Figs 4a–f, 5 and 6 give data in the form of flux-flux plots for many of the galaxies in this paper. The linear relations between most pairs of colours are obvious. Only in the cases of III Zw 2, NGC2992, MCG-2-58-22 and NGC7603 do there seem to be changes of slope with intensity, in the vs diagram. These may be associated with long-term monotonic changes and are discussed in more detail below.
The infrared colours of the variable components of all the galaxies in this sample have been determined from the flux-flux plots. Each galaxy was first dereddened according to the values given in Table 1 and the magnitudes were converted to fluxes using the calibration for a zeroth mag star of log(flux) = –22.82, –23.01, –23.21 and –23.55 Wm-2Hz-1 for , , and respectively. The procedure of Simon and Drake (1989), which assumes that all the scatter is due to observational error, was then used to calculate the regression coefficients , and and their standard errors. The programme assumes constant errors of 0.03 mag and errors of 0.06 mag, which were exceeded in some cases.
The colours of the variable components were calculated using the following formulae:
The colours and errors are given in Table 3. The errors can sometimes be quite large. They arise from (a) the variations in many cases being quite small (b) lower-quality photometry in the -band, where the objects were often rather faint and (c) from uncertainties in the telluric extinction corrections at and to a lesser extent at . (The and extinctions of the earth’s atmosphere track each other very well, so that the colour is the most reliable; Glass & Carter, 1989).
| Name | |||
|---|---|---|---|
| III Zw 2 | 0.96 0.11 | 1.19 0.11 | 1.62 0.21 |
| Tol 0109-38 | 1.76 0.32 | 1.35 0.09 | 1.67 0.30 |
| F9 | 1.29 0.05 | 1.08 0.04 | 1.20 0.06 |
| NGC526a | 1.68 0.10 | 1.31 0.04 | 1.67 0.05 |
| NGC985 | 1.08 0.24 | 1.03 0.17 | 1.44 0.19 |
| ESO 198-G24 | 0.91 0.09 | 1.01 0.07 | 1.35 0.14 |
| NGC1068 | 1.79 0.72 | 2.47 0.36 | 2.48 0.21 |
| NGC1566 | 1.19 0.28 | 0.72 0.16 | 1.83 0.11 |
| 3C120 | 1.06 0.10 | 1.01 0.09 | 1.38 0.14 |
| Akn 120 | 1.14 0.10 | 0.96 0.08 | 1.33 0.11 |
| MCG-5-13-17 | 0.70 0.41 | 1.04 0.23 | 1.63 0.17 |
| Pic A | 0.42 0.34 | 1.63 0.33 | 5.85 0.54 |
| NGC2110 | 5.47 0.54 | 0.14 0.68 | 5.85 0.54 |
| H0557-383 | 1.18 0.16 | 1.11 0.15 | 1.68 0.40 |
| F265 | 0.66 0.49 | 1.16 0.44 | 5.85 0.54 |
| IRAS09149-6206 | 2.28 1.05 | 1.00 0.30 | 1.22 0.54 |
| NGC2992 | 1.25 0.12 | 1.27 0.06 | 1.65 0.05 |
| MCG-5-23-16 | 1.28 0.34 | 1.32 0.16 | 1.97 0.13 |
| NGC3783 | 0.96 0.07 | 1.04 0.05 | 1.35 0.08 |
| H1143-183 | 0.75 0.09 | 0.70 0.09 | 1.22 0.32 |
| I Zw 96 | 1.32 0.33 | 0.08 0.22 | 5.85 0.54 |
| NGC4593 | 1.31 0.21 | 0.98 0.10 | 1.55 0.10 |
| NGC4748 | 0.69 0.37 | 1.19 0.23 | 1.63 0.14 |
| ESO 323-G77 | 1.40 0.14 | 1.07 0.08 | 1.28 0.10 |
| MCG-6-30-15 | 0.87 0.32 | 0.92 0.26 | 1.68 0.39 |
| IC4329A | 1.33 0.14 | 1.04 0.09 | 1.51 0.14 |
| NGC5506 | 2.00 0.16 | 1.42 0.08 | 1.35 0.10 |
| NGC5548 | 1.08 0.40 | 0.94 0.23 | 1.79 0.39 |
| IRAS15091-2107 | 0.94 0.32 | 1.13 0.30 | 1.05 0.80 |
| ESO 103-G35 | 0.62 0.70 | -0.09 0.58 | 5.85 0.54 |
| F51 | 1.37 0.20 | 1.11 0.13 | 1.39 0.17 |
| ESO 141-G55 | 1.06 0.09 | 1.02 0.07 | 1.39 0.17 |
| NGC6814 | 1.20 0.35 | 0.87 0.15 | 1.07 0.12 |
| Mkn 509 | 0.96 0.08 | 0.97 0.07 | 0.49 0.19 |
| 1H2107-097 | 1.02 0.25 | 1.04 0.19 | 1.06 0.39 |
| 1H2129-624 | 1.35 0.17 | 0.96 0.11 | 1.22 0.19 |
| NGC7213 | 1.10 0.70 | 1.17 0.32 | 1.48 0.20 |
| NGC7469 | 1.22 0.17 | 1.15 0.10 | 1.31 0.11 |
| MCG-2-58-22 | 1.04 0.04 | 1.13 0.03 | 1.30 0.04 |
| NGC7603 | 1.21 0.12 | 1.16 0.06 | 1.52 0.07 |
The colours from Table 3 have been plotted in a histogram (fig 3). Those with errors in excess of 0.4 mag have been omitted.
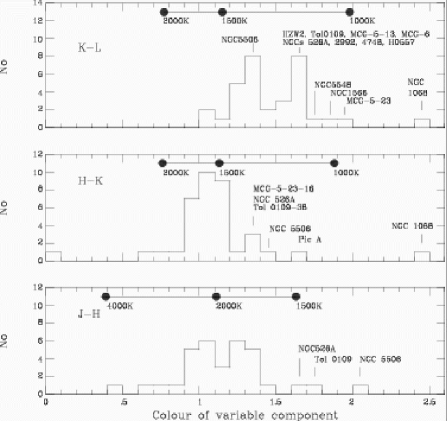
There is a strong tendency for the colour temperatures to clump at particular values. The best-determined colours are , whose histogram peak at 1.06 corresponds to a temperature around 1600K, believed to be the highest temperature at which dust can exist without sublimation. These wavelengths may be the least contaminated by the tail of the nuclear ultraviolet continuum or an extra dust component. Taking only galaxies with errors in 0.2, the average colour in the 0.95, 1.05 and 1.15 columns of the histogram is = 1.056 0.016.
In , the typical colour temperature is around 2000K. It is likely that the tail of the ultraviolet component contributes to the band (1.25m) more than to the (1.65m), leading to an apparently hotter colour. This possibility is considered in detail for NGC 3783, for which data are available, by Glass (1992). In NGC 3783 the contribution to the band from the extrapolated flux is nearly equal to the flux from the short-wavelength tail of the blackbody radiation from dust at 1500K.
In , the colour temperature is lower, about 1300–1400K, and may represent dust slightly further from the nucleus that that which predominates in and . It is possible that there is a series of zones, proceeding outward from the nucleus, with decreasing dust temperatures. It is interesting to note that an optically thick spherical dust shell having a radius of 470d (as measured for Fairall 9) and a temperature of 1400K would have an -band luminosity of 3 1024W Hz-1. This is about 8 times the observed luminosity given in table 1. Fairall 9 has –0.85, indicating that there is almost no circumnuclear absorption along the line of sight. Thus part of the factor of 8 may result from a dust distribution which is not spherical but possibly toroidal.
6.1 Reddenings estimated from the variable components
It is noticeable that the variable part of the flux from the Seyfert 2 galaxy NGC 1068 is much redder in and than the average for Seyferts as a whole. This is an indication that its nucleus is highly obscured, with = 2.47 – 1.056 = 1.414 0.37, or = 7.6 2.0 ( = 23 6) for a normal galactic extinction law(see also Glass, 1997b). In the band its variation is minimal as almost no nuclear flux can penetrate the dust barrier: the colour of the variable part cannot be determined precisely enough to be useful.
Five other galaxies besides NGC1068 have colours of their variable components which stand out from the average of 1.056 0.016 in Fig 3. NGC5506 has EH-K = 1.42 0.08 – 1.056 0.016 or 0.364 0.08. For the galactic extinction law given above and taking EB-V = 0.33 for AV = 1.0, NGC5506 would have EB-V = 2.0 0.4. Similarly, for NGC526a, we have EB-V = 1.37 0.22, for MCG-5-23-16, EB-V = 1.4 0.9 and for NGC2992 EB-V = 1.2 0.3. These values, though not very precise, are generally higher than Maiolino et al (2001) report for the same galaxies by applying the galactic extinction law to the broad H lines and may lend some support to their conclusion that the extinction law (which they discuss in terms of ) in the vicinity of active galactic nuclei is anomalous, i.e. that , the standard galactic value. The fifth galaxy, not included in Maiolino et al (2001), is Tol 0109-36 with EB-V = 1.6 0.5.
7 Constant flux component
It is reasonable to assume that the flux in the 12 arcsec diameter aperture has components other than the variable one, presumed here to be from radiation by hot dust. In the simplest model it is required that this remnant flux should be ‘ordinary’ or inactive galaxy, i.e., a typical mixture of late-type giant stars (as seen in the near-infrared). The and colours of such galaxies are remarkably independent of spectral type (Glass, 1984). The effect of relativistic K-corrections have been estimated from , K, K (see Frogel et al, 1978; Longmore & Sharples, 1982; Griersmith et al, 1982) and used to predict the colours of such a component in any of the present sample.
Returning to the flux-flux plots, Figs 4a–f, 6 and 7, if nuclear activity were to cease altogether, the lowest point the fluxes could reach would be given by the intersection of the observational line with the locus of inactive galaxy flux. It is thus possible to separate the variable and fixed components independently of model surface brightness profiles.
7.1 Underlying galaxy component
If there were no other components besides ordinary galaxy and the variable source present in the 12-arcsec aperture, it would be expected that the fluxes derived from the intersections in each panel should agree with each other; i.e., that the flux of underlying galaxy from the vs flux-flux plot should agree with the flux from the vs plot and the flux from the vs should agree with the flux from the vs plot. However, the accuracy with which the points of intersection can be determined is limited by how well the slope of the variable component is known and by the extent to which the observed line must be extrapolated to meet the underlying galaxy. Further, in the vs plot, the accuracy is also affected by the fact that the regression line is usually almost parallel to the underlying galaxy line.
Some galaxies have solutions for and that are reasonably consistent. These objects are usually of low luminosity with variable fluxes that are much smaller than the underlying galaxy components, though tending to be a larger fraction at the longest wavelength. Some idea of the errors to be expected in the determination of the points of intersection can be obtained by plotting the regression lines for the observed points with slope increased by and hinged about the average flux levels.
The flux-flux diagrams also reveal that some of the most luminous members of the sample, such as H0557-383, H1143-182 and Mkn509, have almost no normal galaxy contribution to the fluxes in the 12 arcsec diameter aperture; i.e., they are essentially QSOs.
7.2 Other constant components
Most of the Seyferts in the sample cannot be resolved into a variable component and a simple underlying standard inactive galaxy.
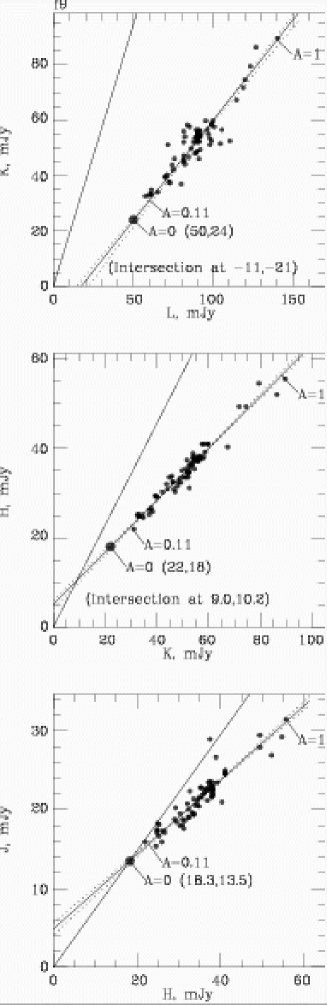
Taking F9 (Fig 5) as an example, which will be discussed below in more detail, the flux of the intersection in the vs diagram is 18 mJy, whereas it is only 10.2 mJy in the vs diagram. Similarly, the flux of the intersection is 10.2 mJy in the vs and –21 mJy in the vs diagrams, the latter being clearly unphysical. It will be seen that these discrepancies can be resolved by postulating the existence of a component with associated cool dust that contributes to the fixed flux, increasing with wavelength.
Another example of this kind is NGC 7469, which was discussed in detail by Glass (1998). A circumnuclear ring exists in this galaxy and appears to constitute a non-variable contribution in addition to the ordinary galaxy stellar component. The ring has been measured at high spatial resolution in by Genzel et al (1995), so that its contribution is known.
8 Parameterization of the nuclear activity
Because of the linear relations between fluxes at different wavelengths, the position of a measured point along the regression line in a flux-flux diagram (see fig 5) can be taken as a measure of the activity at the time. We can define an activity parameter which rises from 0 at the point where the regression line crosses the locus of the ordinary galaxy component to 1 at the maximum of the observed flux. An error can be estimated for by determining the points at which the regression lines intersect with the same locus. The error can be large if there are only a few observational points or if the regression line is almost parallel to the ordinary galaxy line. Such is often the case for the diagram.
For several galaxies, the errors are small and the values of found from all three diagrams agree reasonably well. These are well-observed objects whose constant component appears to be pure inactive galaxy.
In the case of those galaxies where an extra constant component seems to be present, the intersections in the diagram are lower down than expected, and sometimes at unphysical values, because the extra component is cool and causes a displacement of the longer-wavelength fluxes (plotted always along the x-axis) to the right. A self-consistent picture of the different contributions can often be derived by starting with the vs or the vs regressions, according to the probable errors, and estimating the effects of the extra component, followed by iterating. Because of its low temperature it has relatively little effect at shorter wavelengths. Based on the well-observed galaxy F9, the ratio of fluxes are about , corresponding to a cool dust component of 850K. This galaxy is discussed in detail in section 9.3. Its and fluxes lead to a value of at the lowest level of activity of about 11 3% of the maximum observed values.
Table 4 gives the value of A based on the vs diagrams for suitable candidates, together with the underlying galaxy flux in the 12 arcsec measuring aperture at and an estimate of the excess cool component, if present, at .
| Galaxy | A | (mJy) | comments |
| III Zw 2 | 0.49 | 3 | VS |
| Tol 0109-38 | 0.70 | 20 | |
| F9 | 0.11 | 162 | |
| NGC526a | 0.056 | 142 | no strong CE |
| ESO198-G24 | 0.45 | 5.61 | no strong CE |
| NGC1068 | 0.33 | 39050 | CE = 0.25Jy |
| NGC1566 | 0.27 | 875 | |
| 3C120 | 0.5 | 10 | CE = 16 mJy |
| Akn120 | 0.58 | 11 | CE = 35mJy |
| MCG-5-13-17 | 0.26 | 295 | |
| H0557-383 | 0.72 | 7 | |
| NGC2992 | 0.20 | 552 | VS |
| MCG-5-23-16 | 0.35 | 432 | |
| NGC3783 | 0.28 | 325 | CE = 32 mJy |
| PKS1143-182 | 0.55 | 2 | |
| NGC4593 | 0.41 | 464 | no strong CE |
| NGC4748 | 0.28 | 212 | no strong CE |
| ESO323-G77 | 0.56 | 3610 | no strong CE |
| MCG-6-30-15 | 0.74 | 30 | |
| IC4329A | 0.37 | 50 | CE = 97 mJy |
| NGC5506 | 0.43 | 27 | CE = 140 mJy |
| F51 | 0.45 | 17 | CE = 23 mJy |
| ESO141-G55 | 0.32 | 12 | CE = 20 mJy |
| NGC6814 | 0 | 472 | no strong CE |
| MKN 509 | 0.51 | 23 | CE = 40 |
| NGC7213 | 0.74 | 14010 | no strong CE |
| NGC7469 | 0.19 | 58 | CE = 41 |
| MCG-2-58-22 | 0.15 | 11 | CE = 15; VS |
| NGC7603 | 0.13 | 261 | no strong CE, VS |
Notes:
CE denotes cool excess component at , in mJy.
VS denotes variable vs slope
Values without quoted errors are the (approximate) results of iterative solutions.
Absorption within the Milky Way galaxy has been allowed for.
9 Comments on individual galaxies
Many of the galaxies observed during this programme are the subjects of extensive studies only a few of which will be referred to.
9.1 III Zw 2
This is one of the galaxies in which variations were found by Lebofsky & Rieke (1980). At the time of their work (1978-79) it was at the high end of its luminosity range. Their photometry falls (after correction for reddening) close to the regression lines derived from the present work. The infrared increase they observed was attributed to a previously noted increase in its optical-UV radiation, providing early evidence for the dust reverberation model.
The slope of the regression in the vs diagram may have changed with time in the sense that the flux is continuing to decrease even though the flux has bottomed out. This may be a reflection of a very long-term decrease in the flux, arising from relatively distant dust, following a protracted decline in UV activity since the time of the Lebofsky & Rieke work. See also NGC 2992, MCG-2-58-22 and NGC 7469 below.
9.2 Tol 0109-28
This Seyfert 2 galaxy has shown very little activity. The colours of its variable components are considerably redder than average, suggesting strong nuclear reddening. There appears to be a delay of about 100d between and .
9.3 Fairall 9
The data on Fairall 9 yield the best argument so far for the dust reverberation model. The delay of 400 d found by Clavel, Wamsteker & Glass (1989) between the IUE continuum and the -band light curve remains the strongest evidence for the dust reverberation model. Monitoring has continued at SAAO in the band and a delay is still seen in the infrared response. The SAAO data are shown in Fig 1. Variations seen in the new data are found to precede those at by 470d. The lag between and for the entire data set is found to be 370d.
Fig 5 shows the flux-flux plots for F9, together with the ‘activity parameter’, . In the vs diagram, the point corresponding to the level of activity the lowest flux comes closer to the ‘ordinary galaxy’ line than in the other two diagrams. We now assume that the point of intersection of the two lines, = (182, 13.52), represents pure galaxy and an activity of = 0. The minimum observed activity, as a proportion of the maximum, is then .
Using the minimum and maximum levels of , we can estimate the points on the vs diagram where would be zero, namely at = (22,18), with correlated uncertainties of about 2 mJy in each coordinate. It is clear that in Fairall 9, as well as many other galaxies, this point does not coincide with the intersection of the regression line and the ordinary galaxy line. Instead, the position of the point at (22,18) can be regarded as the sum of an ‘ordinary galaxy’ component of (16,18) and an underlying constant component with 0 (see next paragraph) and = 62 mJy.
Similarly, for the vs diagram, the position of the point corresponding to = 0, namely = (50,24) can be regarded as the sum of an ordinary galaxy component of (9,16) with an underlying constant component of (41,8). This corresponds to a colour of 2.42, or a blackbody temperature of 850K. The colour for this temperature of blackbody is 2.4, which would imply an flux only about 18% of the flux, or about 1.4 mJy. This is sufficiently close to the estimated flux of 0 to be acceptable.
Barvainis (1992) made a detailed reverberation model of Fairall 9, based on the data presented by Glass (1986) and Clavel, Wamsteker & Glass (1989). It should be noted that information from a well-sampled IUE UV light curve, contemporary with the infrared data, was available for this galaxy. From Fig. 2 of Glass (1986) he took the underlying galaxy contribution in a 12 arcsec diameter aperture to be 14, 19, 17 and 9 mJy at respectively. These figures are close to the 13.5, 18, 16 and 9 mJy used in the work just described. From fits of his dust model, Barvainis concluded that there must be a ‘fourth component’ of flux that is constant with time. He found for this flux the values 1.5, 3.7, 9.0 and 37mJy respectively, arising from quiescent dust at about 800K or a power law with = –3. His deduction is consistent with the results found here, i.e. that the fourth component has = 8 and = 34 mJy. The present method gives no information as to and as they are tacitly taken to be zero but, if the source is dust at 800K, we have seen that the fluxes at these wavelengths will be small.
9.4 NGC 526A
This object appears heavily obscured in visible light and its variable component is significantly redder than average. There is some evidence for a delay between and of 200100 days.
9.5 ESO 198-G24
A large visual range was found for this galaxy by Winkler et al (1992).
9.6 NGC 1068
The archetype S2 galaxy, NGC 1068 has been discussed in detail by Glass (1995). The colour of its variable component is not well-determined, but the and colours are by far the reddest of the sample.
9.7 NGC 1566
A detailed discussion of the event around JD 2447000, as observed at many wavelengths from the x-ray to the IR, was given by Baribaud et al (1992). A time lag of 2 1 months was found between the UV and the IR. This result was criticised by Oknyanskij & Horne (2001), who find that the delay is consistent with 0 and is less than 20d.
9.8 3C 120
Lebofsky & Rieke (1980) reported a decline in the flux of 3C 120 from levels of 64–71 mJy, that had been observed in 1970–1972 by Penston et al (1974), to 24 mJy in 1978. This decline took at least three years. In the present work the (not dereddened) flux varied from 32 to 47 mJy. Only three galaxies in the present sample have shown such large changes. However, the case for 3C 120 seems to be well corroborated and is almost certainly real. The Penston et al and Lebofsky & Rieke values are plotted with the present data in Fig 6 as crosses. The fluxes tend to lie quite close to the regression lines shown except at , where the Penston values seem too bright. However, the standard errors of his measurements were quite high.
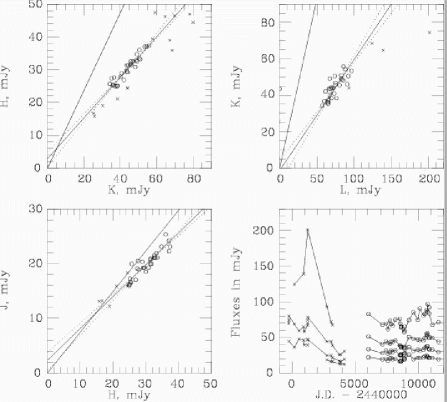
Long-term light curves of 3C 120 have been presented by Hagen-Thorn et al (1997) and Clements et al (1995), in which a decline over the years 1973 to 1978 is clearly seen.
A cross-correlation analysis between and shows that the longer wavelength emission is delayed by about 160 days compared to the shorter.
9.9 Akn 120
Akn 120 has been monitored in the visible region at SAAO by Winkler et al (1992), Winkler (1997) and in a service observing programme at SAAO under the control of Dr D. Kilkenny.
It has also been observed extensively by Doroshenko & Lyuty (1999), who found that the colour of its variable component did not remain constant during two episodes of fading.
A delay of about 315 days was found between and , but between and only 60d was found. Clavel, Wamsteker & Glass (1989) found that the delay between and the near-IR wavelengths tended to be increase with wavelength in F9. Uneven sampling could also play a part in the seeming discrepancy.
9.10 MCG-5-13-17
Visible-region photometry from Winkler et al (1992) & Winkler (1997) is also shown. The data are insufficient for cross-correlation purposes.
9.11 H0557-383
This is one of the most luminous galaxies in the sample and it shows clear evidence for a delay of about 305d between variations at and (See also Fig 1).
9.12 F265
points from Winkler et al (1992) and Winkler (1997) are shown.
9.13 IRAS09149-6206
This is the most luminous galaxy in the sample but unfortunately there are insufficient data to determine a lag.
9.14 NGC 2992
This galaxy showed some form of outburst, much more luminous than any normal supernova, at around JD2447200. The cross-correlation programme described here does not yield a significant delay between and . However, Oknyanskij & Horne (2001) find 18 10d between and and 84 30d between and . The programme used here gets a delay of about 35d between and .
The vs diagram shows some curvature instead of a linear relation. Glass (1997a) mentioned that the time constant for the decay of the outburst at is considerably longer than that for .
9.15 MCG-5-23-16
This galaxy shows little variation at and no significant evidence for delays.
9.16 NGC 3783
The data now presented stretch about 3000 days beyond those of Glass (1992) which suggested the existence of a delay of about 80 days between and . The data now available now suggest a delay of about 190d. It should be noted, however, that the sampling is rather inadequately spaced.
9.17 NGC 4593
Oknyanskij & Horne (2001) conclude from the data of Santos-Lléo et al (1994) that there is a delay of 36 15d between the and variations. The present analysis yields 55d.
9.18 ESO323-G77
The nucleus of this bright Seyfert 1 galaxy is partially obscured and shows visible-light polarization explicable by scattering off dust close to a torus (Schmid, Appenzeller & Burch, 2003). In the infrared it shows a slow decline over 5000d, by about 0.2 mag at and about 0.1 mag at .
9.19 MCG-6-30-15
This well-known x-ray galaxy has shown only modest variations in the IR and its flux variation gradients cannot be determined very accurately. A delay of about 34d between and is indicated.
9.20 IC4329A
This has a partially obscured nucleus, very faint at visible wavelengths (Winkler et al, 1992). There is a suggestion of a delay of between 33 and 85d between and .
9.21 NGC 5506
This is a heavily obscured nucleus, with colours of its variable part much redder than average in and . A delay of about 25d between and may be present.
9.22 ESO 103-G35
Shows no significant variability.
9.23 F51
A high-polarization Seyfert 1 galaxy, similar to ESO 323-G77. The infrared colours are not noticeably redder than average. There is a delay of about 15d, probably not significant, between and . The cross-correlation of with does not yield a sensible result, possibly because of the poorer sampling in .
9.24 ESO141-G55
Cross-correlation between and gives 230d, while between and a delay of 160d is found.
9.25 NGC 6814
This is a Seyfert with nearly ‘ordinary’ colours much of the time. Oknyanskij & Horne (2001) report an upper limit for the delay between and of 15d, based on work by B.O. Nelson. The present data give 35d.
9.26 Mkn 509
For the interval JD 2447415–9323, Carone et al (1996) have published visible-region spectrophotometric data which includes (5110Å) data. It is found that these data, converted to a magnitude scale and assigned a suitable zero point, fit well with the -band data obtained at SAAO by Winkler et al (1992), Winkler (1997) and as part of the service programme. Further data by Doroshenko (1996) is also in good agreement. A hybrid ‘’ light curve has been constructed from these data and is shown in Fig 1.
The band output appears to be heavily smoothed compared to the , , and . The delay between and is poorly defined but seems to be about 60d. However, the flux lags the by about 100 days. It is possible that the geometry of the dust shell smears out the response. It is also the case that there was no infrared monitoring just after the UV outbursts at JD2448100 and 2448800, when the long wavelength emission might have been expected to peak.
The vs diagram of Mkn509 shows an atypical slope for the regression line which makes the colour of the variable component much bluer (0.49 0.23) than average. If the two brightest points are omitted, the slope is changed significantly and has a more typical value, viz 1.13 0.19. However, no obvious mistake can be found in the photometric record.
Carone et al (1996) note that the response of Hβ and HeII to the continuum variations show lags of 80 and 60d respectively; these delays are unusually long.
9.27 NGC 7469
Oknyanskij & Horne (2001) have taken the data of Glass (1998) and cross-correlated it with published and unpublished photometry (e.g. Doroshenko, Lyutyi & Rakhimov, 1989; Chuvaev, Lyutyi & Doroshenko, 1990), finding that there are delays of 5215d at and 6010d at . The present data, using only the published photometry, yield, with lower significance, a delay between and of 21d and between and of 40d. The Oknyanskij & Horne (2001) value should probably be preferred.
9.28 MCG-2-58-22
Four RoSat X-ray observations plotted by Kim & Boller (2002) covering JD 2448000 to 2449500 are consistent with the peak we see in the band around JD 2448500.
This galaxy declined by over a magnitude in between JD 2446800 and JD 2450000, with minor recoveries. The vs diagram, although affected by observational scatter, seems to show a flattening out, or change of slope, as the galaxy becomes faint, in the sense that is tending towards a constant value as declines further. There is some indication of a similar, but less certain, trend in the vs diagram. The explanation may be that the hottest dust, closest to the nucleus in distance and propagation time, has already cooled in response to the shutting off of the ultraviolet component, and a cooler dust zone that contributes to the radiation is still cooling because it is further away and takes longer to respond.
The present data suggest a delay of 160d between and .
9.29 NGC 7603
NGC 7603 has been monitored spectrophotometrically in the visible for 20 years by Kollatschny, Bischoff & Dietrich (2000). Their continuum flux at 5080Å is plotted in Fig. 1. The general features of the contimuum variations are also seen in the infrared. Unfortunately, there was no IR coverage around the continuum peak at JD 2449270. The sharp spike in continuum emission at JD2448862 does not seem to have affected the IR observation on JD 2448874. The fluxes and colours at the time of the first IR observation (JD 2443719) are consistent with an ordinary underlying galaxy. From the Kollatschny et al (2000) data it is probable that the nuclear activity was then close to its lowest point.
The cross-correlation programme does not yield a useful output.
10 Conclusions
Thirty-nine of the forty-one Seyfert galaxies in this sample have shown variability during the observing programme; some of them by over one mag. These variations reflect changes in the ultraviolet output of the central engine in the same way as the visible-light continuum and spectral line observations do; i.e., after a certain time-lag.
Lags are common and most conspicuous at , but difficult to determine accurately. Several of the lower-luminosity galaxies in the present sample have been shown to vary and to exhibit probable lags on time scales of tens of days. These will repay study with more frequent sampling. There is some suggestion that a decline in the flux following a drop in the UV from the central engine may show a longer time constant than its counterpart at , perhaps because of increased radial extent of the dust zone which contributes most at this wavelength.
For the most part, there are strong linear correlations between the and fluxes. The colours of the variable components are therefore easy to determine, provided that the variations have sufficient amplitude and the photometry is sufficiently accurate. There is a high degree of uniformity of colours among the variable components which allows an estimate of the nuclear reddening to be made in heavily reddened cases. It also clear that the near-infrared emission mechanism is the same in all Seyfert galaxies.
In many cases, the fluxes seen through the measuring aperture can be separated into variable and underlying galaxy components without recourse to surface-brightness modelling. In a number of galaxies, a further non-variable component, probably arising from cool dust, is clearly present at and may be modelled.
| MJD | |||||
|---|---|---|---|---|---|
| 3717 | 13.18 | 12.25 | 11.11 | 9.82 | .12 |
| 6695 | 13.61 | 12.55 | 11.41 | 9.86 | .14 |
| 6989 | 13.71 | 12.67 | 11.54 | 10.01 | .09 |
| 7436 | 13.60 | 12.70 | 11.63 | 9.95 | .11 |
| 7437 | 13.55 | 12.72 | 11.61 | 10.28 | .10 |
| 7342 | 13.55 | 12.68 | 11.65 | ||
| 7842 | 13.54 | 12.74 | 11.67 | 10.32 | .16 |
| 8132 | 13.67 | 12.78 | 11.68 | 10.19 | .05 |
| 8172 | 13.59 | 12.69 | 11.62 | 9.91 | .06 |
| 8227 | 13.56 | 12.61 | 11.57 | 10.00 | .13 |
| 8529 | 13.79 | 12.86 | 11.67 | 10.43 | .22 |
| 8574 | 13.64 | 12.76 | 11.60 | 10.07 | .17 |
| 8576 | 13.75 | 12.75 | 11.67 | 10.10 | .18 |
| 8874 | 13.75 | 12.84 | 11.67 | 10.13 | .05 |
| 9966 | 13.84 | 12.89 | 11.79 | 10.41 | .12 |
| 10655 | 13.61 | 12.66 | 11.56 | 10.31 | .17 |
| 10742 | 13.64 | 12.61 | 11.69 | 10.00 | .16 |
| 11117 | 13.60 | 12.71 | 11.60 | 10.43 | .16 |
11 Acknowledgments
I would like to thank Dr David Kilkenny and François van Wyk and Fred Marang, the observers on the SAAO 0.5-m service programme, for unpublished photometry. Dr Hartmut Winkler (VISTA University) is thanked for reading an early version of the ms. Dr Chris Koen (SAAO) has helped by commenting on statistical and other questions. The referee, Dr Victor Oknyanskij, is thanked for useful comments.
References
- [] Baribaud T., Alloin D., Glass, I.S., Pelat D., 1992, A&A, 256, 375
- [] Barvainis R., 1987, ApJ, 320, 537
- [] Barvainis R., 1992, ApJ, 400, 502
- [] Carter B.S., 1990, MNRAS, 242, 1
- [] Carone T.E. et al, 1996, ApJ, 471, 737
- [] Chołoniewski J., 1981, Acta Astr, 31, 293
- [] Chuvaev K.K., Lyutyi V.M., Doroshenko V.T., 1990, Sov. Astr. Letts., 16, 372
- [] Clavel J., Wamsteker W., Glass I.S., 1989, ApJ, 337, 236.
- [] Clements S.D., Smith A.G., Aller H.D., Aller M.F., 1995, AJ, 529
- [] Doroshenko V.T., 1996, Astr. Letts., 22, 309
- [] Doroshenko V.T., Lyuty V.M., 1999, Astr. Letts., 25, 883
- [] Doroshenko V.T., Lyutyi V.M., Rakhimov V.Yu., 1989, Sov. Astr. Letts., 15, 207
- [] Frogel J.A., Persson S.E., Aaronson M., Matthews K., 1978, ApJ, 220, 75
- [] Gaskell C.M., Peterson B.M., 1987, ApJS, 65, 1
- [] Genzel R., Weitzel L., Tacconi-Garman L.E., Blietz M., Cameron M., Krabbe A., Lutz D., Sternberg A., 1995, ApJ, 444, 129
- [] Glass I.S., 1984, MNRAS 211, 461
- [] Glass I.S., 1986, MNRAS 219, 5p (Fairall 9)
- [] Glass I.S., 1992, MNRAS 256, L23. (NGC 3783)
- [] Glass I.S., 1995, MNRAS 276, L65 (NGC 1068)
- [] Glass I.S., 1997a, MNRAS 257, L50 (NGC 2992)
- [] Glass I.S., 1997b, ApSpSci, 248, 191
- [] Glass I.S., 1997c, Mon Notes astr Soc S. Africa, 56, 110
- [] Glass I.S., 1998, MNRAS 297, 18 (NGC 7469)
- [] Glass I.S., Carter B.S., 1989, In IAU Joint Commission Meeting Problems of Infrared Standardisation and Extinction, ed. E.F. Milone, Springer, Berlin, 37
- [] Griersmith D., Hyland A.R., Jones T.J., 1982, AJ, 87, 1106
- [] Hagen-Thorn V.A., Marchenko S.G., Mikolaichuk O.V., Yakoleva V.A., 1997, Astr. Rep., 41, 1
- [] Kim C., Boller T., 2002, ApSpSci 281, 663
- [] Kollatschny W., Bischoff K., Dietrich M., 2000, A&A, 361, 901
- [] Lebofsky M.J., Rieke G.H., 1980, Nature, 284, 410
- [] Longmore A.J., Sharples R.M., 1982, MNRAS, 201, 111
- [] Maiolino R., Marconi A., Salvati M., Risaliti G., Severgnini P., Oliva E., La Franca F., Vanzi L., 2001, A&A, 365, 28
- [] Nelson B.O., 1996, ApJ 465, L87
- [] Oknyanskij V.L., 2002, in Galaxies, the Third Dimension, ASP Conf. Ser. Vol. 282, p. 330
- [] Oknyanskij V.L., Horne K., 2001, in Probing the Physics of Active Galactic Nuclei by Multiwavelength Monitoring, ASP Conf. Ser. Vol. 224, p. 149
- [] Penston M.V., Penston M.J., Selmes R.A., Becklin E.E., Neugebauer G., 1974, MNRAS, 169, 357
- [] Pier E.A. & Krolik J.H., 1992, ApJ, 401, 99
- [] Pier E.A. & Voit G.M., 1995, ApJ, 450, 628
- [] Salvati M. et al, (1993), A&A, 274, 174
- [] Santos-Lléo M., Clavel J., Barr P., Glass I.S., Pelat D., Peterson B.M., Reichert G., 1995, MNRAS 270, 580
- [] Schlegel D.J., Finkbeiner D.P., Davis M., 1998, ApJ, 500, 525
- [] Schmid H.M., Appenzeller I., Burch U., 2003, A&A, 404, 505
- [] Simon T., Drake S.A., 1989. ApJ, 346, 305
- [] Véron-Cetty M.-P., Véron P., 2000, ESO Scientific Report No. 19
- [] Winkler H., 1997, MNRAS, 292, 273
- [] Winkler H., Glass I.S., van Wyk F., Marang F., Spencer Jones J.H., Buckley D.A.H. and Sekiguchi K., 1992. MNRAS, 257, 659
| MJD | ||||
|---|---|---|---|---|
| 5302 | 11.91 | 10.65 | 9.43 | 7.60 |
| 5885 | 11.91 | 10.66 | 9.52 | 7.70 |
| 6287 | 11.84 | 10.64 | 9.48 | 7.65 |
| 6664 | 11.80 | 10.52 | 9.36 | 7.63 |
| 6692 | 11.83 | 10.56 | 9.39 | 7.66 |
| 7143 | 11.82 | 10.57 | 9.41 | 7.55 |
| 7436 | 11.84 | 10.57 | 9.44 | 7.67 |
| 7509 | 11.78 | 10.50 | 9.37 | 7.61 |
| 7749 | 11.83 | 10.53 | 9.37 | 7.63 |
| 7841 | 11.86 | 10.60 | 9.43 | 7.63 |
| 8132 | 11.78 | 10.52 | 9.36 | 7.67 |
| 8173 | 11.82 | 10.44 | 9.30 | 7.55 |
| 8573 | 11.78 | 10.49 | 9.33 | 7.61 |
| 8630 | 11.78 | 10.49 | 9.35 | 7.55 |
| 8875 | 11.77 | 10.51 | 9.38 | 7.61 |
| 8902 | 11.81 | 10.54 | 9.38 | 7.63 |
| 8906 | 11.77 | 10.52 | 9.40 | 7.63 |
| 8908 | 11.83 | 10.54 | 9.37 | 7.61 |
| 9258 | 11.83 | 10.55 | 9.39 | 7.62 |
| 9614 | 11.79 | 10.47 | 9.32 | 7.60 |
| 9615 | 11.78 | 10.48 | 9.30 | 7.59 |
| 9970 | 11.98 | 10.66 | 9.54 | 7.68 |
| 9971 | 11.93 | 10.69 | 9.57 | 7.75 |
| 10058 | 11.86 | 10.62 | 9.52 | 7.74 |
| 10117 | 11.86 | 10.57 | 9.48 | 7.72 |
| 10304 | 11.78 | 10.47 | 9.32 | 7.65 |
| 10410 | 11.79 | 10.50 | 9.36 | 7.55 |
| 10413 | 11.84 | 10.53 | 9.38 | 7.69 |
| 10655 | 11.89 | 10.67 | 9.51 | 7.70 |
| 10738 | 11.91 | 10.68 | 9.55 | 7.77 |
| 11115 | 11.85 | 10.68 | 9.64 | 7.95 |
| MJD | ||||
|---|---|---|---|---|
| 3061 | 11.81 | 11.05 | 10.20 | 8.58 |
| 3510 | 11.80 | 10.64 | 09.73 | 8.40 |
| 3681 | 11.79 | 10.75 | 09.80 | 8.43 |
| 3683 | 11.85 | 10.75 | 09.84 | 8.44 |
| 4204 | 11.72 | 10.62 | 09.60 | 8.26 |
| 4469 | 11.89 | 10.69 | 09.64 | 8.37 |
| 5341 | 12.16 | 10.97 | 09.91 | 8.48 |
| 5619 | 12.35 | 11.25 | 10.18 | 8.52 |
| 5889 | 12.41 | 11.48 | 10.56 | 8.87 |
| 5890 | 12.46 | 11.45 | 10.52 | |
| 6047 | 12.46 | 11.63 | 10.75 | |
| 6287 | 12.36 | 11.50 | 10.68 | 9.16 |
| 6312 | 12.31 | 11.49 | 10.70 | 9.23 |
| 6313 | 12.38 | 11.50 | 10.68 | 9.17 |
| 6314 | 12.32 | 11.48 | 10.69 | 9.19 |
| 6476 | 12.38 | 11.42 | 10.54 | 8.98 |
| 6608 | 12.20 | 11.32 | 10.49 | 9.01 |
| 6662 | 12.24 | 11.28 | 10.42 | 8.94 |
| 6690 | 12.17 | 11.22 | 10.38 | 8.95 |
| 6767 | 12.09 | 11.20 | 10.32 | 8.93 |
| 6777 | 12.18 | 11.16 | 10.33 | 8.85 |
| 6850 | 12.14 | 11.17 | 10.35 | 8.85 |
| 6984 | 12.07 | 11.12 | 10.24 | 8.79 |
| 6985 | 12.07 | 11.11 | 10.21 | 8.99 |
| 7141 | 12.08 | 11.08 | 10.18 | 8.64 |
| 7143 | 12.08 | 11.08 | 10.16 | 8.76 |
| 7435 | 12.09 | 11.05 | 10.12 | 8.74 |
| 7436 | 12.03 | 11.05 | 10.12 | 8.73 |
| 7438 | 12.07 | 11.06 | 10.12 | 8.74 |
| 7509 | 12.12 | 11.03 | 10.11 | 8.85 |
| 7512 | 12.13 | 11.11 | 10.14 | 8.74 |
| 7580 | 12.15 | 11.07 | 10.16 | 8.65 |
| 7748 | 12.10 | 11.09 | 10.16 | 8.74 |
| 7749 | 12.11 | 11.10 | 10.18 | 8.73 |
| 7839 | 12.19 | 11.13 | 10.18 | 8.74 |
| 7842 | 12.18 | 11.14 | 10.19 | 8.75 |
| 7875 | 12.15 | 11.14 | 10.19 | 8.85 |
| 7876 | 12.13 | 11.13 | 10.19 | 8.73 |
| 7964 | 12.24 | 11.17 | 10.23 | |
| 8042 | 12.23 | 11.18 | 10.26 | 8.74 |
| 8170 | 12.06 | 11.04 | 10.15 | 8.75 |
| 8172 | 12.04 | 11.03 | 10.15 | 8.72 |
| 8173 | 12.05 | 11.05 | 10.14 | 8.72 |
| 8224 | 12.07 | 11.03 | 10.10 | 8.73 |
| 8529 | 12.04 | 11.06 | 10.11 | 8.72 |
| 8573 | 12.13 | 11.04 | 10.10 | 8.67 |
| 8576 | 12.12 | 11.04 | 10.10 | 8.57 |
| 8629 | 12.08 | 11.03 | 10.10 | 8.75 |
| 8633 | 12.09 | 11.03 | 10.13 | 8.66 |
| 8875 | 12.29 | 11.24 | 10.28 | 8.76 |
| 8877 | 12.26 | 11.21 | 10.27 | 8.75 |
| 8902 | 12.27 | 11.21 | 10.32 | 8.73 |
| 8905 | 12.33 | 11.28 | 10.30 | 8.85 |
| 8908 | 12.32 | 11.26 | 10.31 | 8.81 |
| 8995 | 12.28 | 11.26 | 10.37 | 8.84 |
| 9255 | 12.37 | 11.44 | 10.55 | 8.97 |
| 9609 | 12.28 | 11.33 | 10.47 | 9.00 |
| 9614 | 12.30 | 11.31 | 10.49 | 9.02 |
| 9889 | 11.90 | 11.01 | 10.15 | 8.84 |
| 9966 | 11.98 | 10.95 | 10.07 | 8.82 |
| 9972 | 11.97 | 10.95 | 10.08 | 8.80 |
| 10053 | 11.99 | 10.95 | 10.04 | 8.68 |
| 10113 | 11.99 | 10.95 | 10.04 | 8.63 |
| 10302 | 12.04 | 11.00 | 10.06 | 8.64 |
| 10410 | 12.08 | 11.04 | 10.08 | 8.62 |
| 10614 | 12.11 | 11.03 | 10.07 | 8.64 |
| 10655 | 12.24 | 11.17 | 10.19 | 8.77 |
| 10720 | 12.25 | 11.17 | 10.21 | 8.65 |
| 10742 | 12.21 | 11.21 | 10.25 | 8.72 |
| 11118 | 12.37 | 11.49 | 10.65 | 9.09 |
| 11209 | 12.50 | 11.51 | 10.63 | 9.16 |
| MJD | |||||
|---|---|---|---|---|---|
| 4466 | 12.32 | 11.18 | 10.22 | ||
| 4482 | 10.32 | 8.58 | .10 | ||
| 4919 | 12.49 | 11.59 | 10.92 | ||
| 5889 | 12.54 | 11.71 | 11.09 | 9.95 | .15 |
| 5890 | 12.48 | 11.64 | 11.06 | ||
| 6287 | 12.50 | 11.66 | 11.16 | 0.11 | .20 |
| 6478 | 12.44 | 11.55 | 10.95 | ||
| 6608 | 12.36 | 11.52 | 10.85 | 9.59 | .11 |
| 6664 | 12.36 | 11.47 | 10.71 | 9.44 | .07 |
| 6692 | 12.36 | 11.38 | 10.67 | 9.32 | .07 |
| 6767 | 12.36 | 11.50 | 10.71 | 9.46 | .09 |
| 6776 | 12.36 | 11.44 | 10.73 | 9.43 | .15 |
| 6985 | 12.37 | 11.39 | 10.60 | 9.23 | .05 |
| 7142 | 12.42 | 11.42 | 10.60 | 9.25 | .08 |
| 7341 | 12.46 | 11.42 | 10.65 | 9.29 | .08 |
| 7435 | 12.45 | 11.49 | 10.79 | 9.42 | .04 |
| 7436 | 12.45 | 11.56 | 10.79 | 9.46 | .07 |
| 7438 | 12.45 | 11.52 | 10.77 | 9.62 | .09 |
| 7509 | 12.46 | 11.54 | 10.89 | 9.32 | .12 |
| 7584 | 11.58 | 10.89 | 9.60 | .18 | |
| 7748 | 12.46 | 11.56 | 10.89 | 9.53 | .06 |
| 7749 | 12.46 | 11.56 | 10.89 | 9.53 | .06 |
| 7839 | 12.51 | 11.51 | 10.85 | 9.51 | .09 |
| 7841 | 12.46 | 11.51 | 10.83 | 9.63 | .03 |
| 7843 | 12.49 | 11.53 | 10.83 | 9.65 | .10 |
| 7875 | 12.48 | 11.52 | 10.80 | 9.58 | .08 |
| 7876 | 12.45 | 11.49 | 10.79 | 9.58 | .10 |
| 8132 | 12.45 | 11.52 | 10.85 | 9.61 | .05 |
| 8172 | 12.37 | 11.41 | 10.68 | 9.43 | .06 |
| 8226 | 12.45 | 11.45 | 10.68 | 9.53 | .05 |
| 8529 | 12.49 | 11.57 | 10.95 | 9.84 | .10 |
| 8573 | 12.50 | 11.59 | 10.96 | 9.75 | .10 |
| 8576 | 12.50 | 11.52 | 10.89 | 9.80 | .13 |
| 8630 | 12.44 | 11.54 | 10.89 | 9.68 | .10 |
| 8833 | 12.43 | 11.53 | 10.89 | 9.55 | .08 |
| 8875 | 12.31 | 11.29 | 10.59 | 9.45 | .03 |
| 8877 | 12.25 | 11.32 | 10.56 | 9.34 | .05 |
| 8902 | 12.38 | 11.33 | 10.52 | 9.18 | .06 |
| 8905 | 12.33 | 11.33 | 10.50 | 9.24 | .05 |
| 8906 | 12.37 | 11.29 | 10.57 | 9.31 | .05 |
| 8908 | 12.30 | 11.30 | 10.49 | 9.29 | .07 |
| 9255 | 12.36 | 11.40 | 10.62 | 9.26 | .05 |
| 9609 | 12.21 | 11.10 | 10.24 | 8.91 | .03 |
| 9614 | 12.18 | 11.11 | 10.22 | 9.02 | .04 |
| 9966 | 12.24 | 11.09 | 10.15 | 8.67 | .05 |
| 9971 | 12.20 | 11.09 | 10.15 | 8.85 | .07 |
| 10053 | 12.28 | 11.18 | 10.26 | 8.81 | .04 |
| 10116 | 12.31 | 11.20 | 10.26 | 8.74 | .06 |
| 10302 | 12.34 | 11.25 | 10.36 | 8.91 | .05 |
| 10410 | 12.29 | 11.31 | 10.48 | 9.10 | .06 |
| 10655 | 12.41 | 11.52 | 10.85 | 9.47 | .08 |
| 10721 | 12.39 | 11.38 | 10.67 | 9.23 | .09 |
| 10738 | 12.35 | 11.38 | 10.65 | 9.18 | .09 |
| 11114 | 12.40 | 11.44 | 10.65 | 9.24 | .02 |
| MJD | |||||
|---|---|---|---|---|---|
| 7839 | 12.70 | 11.80 | 11.19 | 10.23 | .11 |
| 9972 | 12.65 | 11.78 | 11.13 | 10.07 | .08 |
| 10057 | 12.60 | 11.72 | 11.07 | 9.87 | .13 |
| 10118 | 12.53 | 11.65 | 11.05 | 9.95 | .12 |
| 10721 | 12.39 | 11.46 | 10.71 | 9.55 | .09 |
| 11117 | 12.60 | 11.63 | 10.94 | 9.81 | .06 |
| 11601 | 12.62 | 11.73 | 11.02 | 9.71 | .24 |
| MJD | |||||
|---|---|---|---|---|---|
| 7842 | 12.88 | 11.92 | 11.10 | 9.75 | .11 |
| 8575 | 12.91 | 12.00 | 11.29 | 9.91 | .14 |
| 8576 | 12.96 | 12.03 | 11.26 | 10.25 | .15 |
| 8630 | 12.93 | 12.03 | 11.27 | 9.97 | .12 |
| 8875 | 12.94 | 12.06 | 11.27 | 10.10 | .06 |
| 8902 | 12.95 | 12.12 | 11.36 | 10.15 | .14 |
| 8906 | 13.00 | 12.08 | 11.29 | 10.10 | .08 |
| 8908 | 13.09 | 12.17 | 11.33 | 10.26 | .10 |
| 9255 | 12.83 | 12.03 | 11.24 | 10.09 | .17 |
| 9614 | 13.18 | 12.30 | 11.52 | 10.03 | .11 |
| 9970 | 13.22 | 12.22 | 11.51 | 10.09 | .12 |
| 10053 | 13.16 | 12.29 | 11.51 | 10.14 | .16 |
| 10116 | 13.22 | 12.29 | 11.58 | 10.31 | .19 |
| 10304 | 13.12 | 12.21 | 11.52 | 10.24 | .10 |
| 10413 | 13.37 | 12.25 | 11.51 | 10.25 | .12 |
| 10721 | 13.32 | 12.57 | 12.02 | 10.85 | .21 |
| 10738 | 13.45 | 12.58 | 11.98 | ||
| 11117 | 13.08 | 12.13 | 11.37 | 10.42 | .10 |
| MJD | ||||
|---|---|---|---|---|
| 0900 | 0.0 | 8.05 | 7.40 | 5.42 |
| 3024 | 9.13 | 8.18 | 7.47 | 5.51 |
| 6047 | 9.06 | 8.08 | 7.09 | 4.97 |
| 6314 | 9.05 | 8.09 | 7.10 | 4.96 |
| 7437 | 9.03 | 8.03 | 7.01 | 4.90 |
| 7842 | 9.07 | 8.08 | 7.03 | 4.88 |
| 7877 | 9.07 | 8.06 | 7.01 | 4.82 |
| 8173 | 9.02 | 8.03 | 6.97 | 4.82 |
| 8529 | 9.00 | 8.00 | 6.92 | 4.77 |
| 8575 | 9.05 | 8.02 | 6.93 | 4.78 |
| 8634 | 9.08 | 8.02 | 6.94 | 4.75 |
| 8875 | 9.04 | 7.99 | 6.90 | 4.74 |
| 8902 | 9.06 | 8.02 | 6.91 | 4.73 |
| 9615 | 9.04 | 7.99 | 6.87 | 4.66 |
| 9889 | 0.0 | 0.0 | 6.89 | 4.72 |
| 9895 | 9.12 | 8.02 | 6.91 | 4.70 |
| 9966 | 9.06 | 7.99 | 6.89 | 4.69 |
| 9971 | 9.09 | 8.01 | 6.89 | 4.71 |
| 10057 | 9.06 | 8.03 | 6.91 | 4.70 |
| 10114 | 9.07 | 8.04 | 6.93 | 4.69 |
| 10302 | 9.03 | 8.00 | 6.92 | 4.72 |
| 10410 | 9.04 | 8.04 | 6.95 | 4.75 |
| 10655 | 9.06 | 8.04 | 6.97 | 4.78 |
| 10863 | 9.09 | 8.10 | 7.07 | 4.80 |
| 10868 | 9.08 | 8.08 | 7.02 | 4.84 |
| 11115 | 9.00 | 8.01 | 7.04 | 4.84 |
| 11599 | 9.10 | 8.07 | 7.05 | 4.82 |
| 11600 | 9.05 | 8.06 | 7.03 | 4.81 |
| MJD | |||||
|---|---|---|---|---|---|
| 1569 | 10.59 | 9.66 | 9.41 | ||
| 3024 | 9.48 | ||||
| 3025 | 10.64 | 9.80 | 9.50 | 8.77 | .28 |
| 3718 | 10.59 | 9.78 | 9.53 | ||
| 3887 | 9.70 | ||||
| 4466 | 10.65 | 9.81 | 9.53 | ||
| 5266 | 0.0 | 9.51 | |||
| 5302 | 10.64 | 9.79 | 9.36 | 8.70 | .07 |
| 5341 | 10.69 | 9.83 | 9.38 | ||
| 5420 | 10.72 | 9.91 | 9.54 | ||
| 5740 | 10.78 | 9.93 | 9.62 | ||
| 6050 | 10.69 | 9.89 | 9.62 | 9.38 | .11 |
| 6059 | 10.70 | 9.88 | 9.61 | 9.30 | .03 |
| 6117 | 10.66 | 9.89 | 9.64 | 9.35 | .13 |
| 6287 | 10.71 | 9.93 | 9.62 | 9.51 | .08 |
| 6479 | 10.73 | 9.89 | 9.62 | ||
| 6664 | 10.69 | 9.88 | 9.60 | 9.36 | .10 |
| 6691 | 10.73 | 9.92 | 9.62 | 9.34 | .08 |
| 6777 | 10.69 | 9.91 | 9.64 | 9.23 | .08 |
| 6846 | 10.68 | 9.89 | 9.62 | 9.27 | .10 |
| 7143 | 10.65 | 9.83 | 9.45 | 8.87 | .04 |
| 7247 | 10.67 | 9.88 | 9.58 | 9.04 | .12 |
| 7435 | 10.72 | 9.86 | 9.58 | 9.21 | .08 |
| 7509 | 10.70 | 9.87 | 9.61 | 9.07 | .09 |
| 7581 | 10.73 | 9.90 | 9.63 | 9.30 | .05 |
| 7749 | 10.70 | 9.88 | 9.59 | 9.35 | .04 |
| 7842 | 10.73 | 9.88 | 9.60 | 9.20 | .05 |
| 7876 | 10.74 | 9.90 | 9.62 | 9.50 | .07 |
| 8173 | 10.72 | 9.90 | 9.61 | 9.26 | .05 |
| 8576 | 10.71 | 9.87 | 9.60 | 9.31 | .06 |
| 8630 | 10.71 | 9.86 | 9.59 | 9.25 | .07 |
| 8875 | 10.73 | 9.89 | 9.62 | 9.32 | .03 |
| 8902 | 10.74 | 9.91 | 9.63 | 9.37 | .06 |
| 8995 | 10.70 | 9.87 | 9.62 | 9.19 | .09 |
| 9255 | 10.66 | 9.88 | 9.63 | 9.26 | .09 |
| 9971 | 10.72 | 9.87 | 9.57 | 9.40 | .08 |
| 0053 | 10.71 | 9.88 | 9.59 | 9.30 | .05 |
| 0114 | 10.69 | 9.87 | 9.60 | 9.47 | .11 |
| 0411 | 10.71 | 9.88 | 9.60 | 9.14 | .05 |
| 0509 | 10.64 | 9.87 | 9.55 | 9.19 | .10 |
| 0721 | 10.69 | 9.87 | 9.56 | 9.10 | .07 |
| 0868 | 10.69 | 9.87 | 9.56 | 9.40 | .08 |
| 1117 | 10.70 | 9.85 | 9.60 | 9.43 | .06 |
| 1601 | 10.67 | 9.83 | 9.53 | 9.11 | .07 |
| 1602 | 10.78 | 9.91 | 9.59 | 8.92 | .09 |
| MJD | |||||
|---|---|---|---|---|---|
| 6049 | 12.32 | 11.30 | 10.28 | 8.86 | .06 |
| 7143 | 12.48 | 11.49 | 10.54 | 9.08 | .07 |
| 7437 | 12.42 | 11.36 | 10.43 | 9.05 | .05 |
| 7580 | 12.59 | 11.53 | 10.49 | 9.18 | .09 |
| 7749 | 12.40 | 11.45 | 10.52 | 8.99 | .04 |
| 7839 | 12.37 | 11.36 | 10.45 | 9.06 | .06 |
| 7968 | 12.46 | 11.43 | 10.45 | 9.10 | .09 |
| 8172 | 12.42 | 11.35 | 10.40 | 8.97 | .03 |
| 8529 | 12.66 | 11.61 | 10.59 | 8.95 | .04 |
| 8575 | 12.58 | 11.60 | 10.59 | 9.05 | .05 |
| 8629 | 12.65 | 11.61 | 10.62 | 9.12 | .06 |
| 8633 | 12.62 | 11.59 | 10.65 | 9.12 | .05 |
| 8634 | 12.64 | 11.60 | 10.66 | 9.13 | .05 |
| 8874 | 12.42 | 11.58 | 10.71 | 9.26 | .04 |
| 8902 | 12.47 | 11.51 | 10.68 | 9.12 | .05 |
| 8908 | 12.39 | 11.50 | 10.64 | 9.22 | .05 |
| 9255 | 12.16 | 11.21 | 10.29 | 8.98 | .05 |
| 9615 | 12.46 | 11.38 | 10.34 | 8.83 | .04 |
| 9970 | 12.36 | 11.32 | 10.37 | 8.97 | .05 |
| 10114 | 12.38 | 11.36 | 10.39 | 8.76 | .01 |
| 10410 | 12.34 | 11.32 | 10.40 | 8.89 | .06 |
| 10507 | 12.26 | 11.25 | 10.32 | 8.86 | .04 |
| 10657 | 12.21 | 11.18 | 10.21 | 8.79 | .04 |
| 10720 | 12.26 | 11.17 | 10.18 | 8.82 | .05 |
| 10738 | 12.30 | 11.18 | 10.23 | 8.69 | .06 |
| 10863 | 12.36 | 11.29 | 10.29 | 8.74 | .08 |
| 10868 | 12.36 | 11.31 | 10.33 | 8.85 | .07 |
| 11115 | 12.36 | 11.32 | 10.32 | 9.08 | .05 |
| 11599 | 12.50 | 11.41 | 10.45 | ||
| 11600 | 12.46 | 11.44 | 10.44 | 9.02 | .10 |
| MJD | ||||
|---|---|---|---|---|
| 6780 | 11.65 | 10.67 | 9.81 | 8.57 |
| 7143 | 11.76 | 10.71 | 9.83 | 8.49 |
| 7244 | 11.67 | 10.70 | 9.80 | 8.55 |
| 7437 | 11.80 | 10.76 | 9.90 | 8.49 |
| 7513 | 11.70 | 10.73 | 9.85 | 8.60 |
| 7580 | 11.68 | 10.72 | 9.85 | 8.56 |
| 7839 | 11.57 | 10.57 | 9.70 | 8.43 |
| 7875 | 11.56 | 10.54 | 9.67 | 8.43 |
| 7876 | 11.64 | 10.55 | 9.70 | 8.47 |
| 7967 | 11.59 | 10.53 | 9.67 | 8.34 |
| 8172 | 11.57 | 10.53 | 9.66 | 8.29 |
| 8529 | 11.92 | 10.86 | 9.94 | 8.59 |
| 8575 | 11.92 | 10.92 | 10.02 | 8.67 |
| 8576 | 11.94 | 10.94 | 10.03 | 8.61 |
| 8629 | 11.93 | 10.92 | 10.06 | 8.63 |
| 8633 | 11.89 | 10.94 | 10.07 | 8.62 |
| 8874 | 11.75 | 10.77 | 9.96 | 8.70 |
| 8902 | 11.77 | 10.80 | 9.97 | 8.69 |
| 8995 | 11.83 | 10.82 | 9.96 | 8.72 |
| 9255 | 11.81 | 10.87 | 10.03 | 8.74 |
| 9615 | 11.96 | 10.97 | 10.14 | 8.83 |
| 9966 | 11.88 | 10.89 | 10.08 | 8.84 |
| 10113 | 11.96 | 10.93 | 10.11 | 8.88 |
| 10410 | 11.85 | 10.86 | 10.09 | 8.90 |
| 10507 | 11.80 | 10.83 | 10.02 | 8.72 |
| 10657 | 11.82 | 10.83 | 10.03 | 8.78 |
| 10720 | 11.80 | 10.85 | 10.02 | 8.71 |
| 10738 | 11.80 | 10.81 | 10.00 | 8.65 |
| 10863 | 11.76 | 10.81 | 10.02 | 8.66 |
| 10868 | 11.75 | 10.79 | 9.97 | 8.76 |
| 11115 | 11.82 | 10.84 | 10.05 | 8.84 |
| 11599 | 11.84 | 10.96 | 10.18 | 8.93 |
| MJD | |||||
|---|---|---|---|---|---|
| 6923 | 11.67 | 10.96 | 10.61 | 9.89 | .05 |
| 7144 | 11.74 | 10.96 | 10.51 | 9.78 | .17 |
| 7246 | 11.69 | 10.97 | 10.54 | 9.87 | .10 |
| 7437 | 11.70 | 10.92 | 10.57 | 9.89 | .08 |
| 7580 | 11.81 | 10.98 | 10.59 | 9.63 | .05 |
| 7581 | 11.79 | 10.95 | 10.57 | 9.83 | .08 |
| 7634 | 11.76 | 11.00 | 10.60 | 10.11 | .08 |
| 7842 | 11.77 | 10.99 | 10.63 | 10.02 | .10 |
| 7876 | 11.77 | 10.97 | 10.61 | 10.00 | .10 |
| 7964 | 11.80 | 11.04 | 10.70 | 9.95 | .16 |
| 8173 | 11.80 | 11.02 | 10.73 | 10.03 | .11 |
| 8576 | 11.76 | 10.96 | 10.61 | 10.00 | .10 |
| 8629 | 11.78 | 11.02 | 10.70 | 10.09 | .14 |
| 8877 | 11.78 | 11.02 | 10.65 | 10.05 | .12 |
| 8902 | 11.79 | 11.04 | 10.72 | 10.25 | .10 |
| 8908 | 11.79 | 11.03 | 10.72 | 10.07 | .12 |
| 9615 | 11.71 | 10.95 | 10.56 | 9.90 | .11 |
| 10053 | 11.70 | 10.92 | 10.50 | 9.65 | .08 |
| 10113 | 11.75 | 10.97 | 10.60 | 9.84 | .05 |
| 10115 | 11.73 | 10.96 | 10.62 | 9.84 | .15 |
| 10411 | 11.70 | 10.93 | 10.53 | 9.77 | .11 |
| 10509 | 11.82 | 11.00 | 10.69 | 10.04 | .2 |
| 10863 | 11.80 | 10.99 | 10.63 | 9.84 | .17 |
| 11115 | 11.72 | 10.93 | 10.56 | 9.78 | .09 |
| 11597 | 11.74 | 10.92 | 10.55 | 9.66 | .15 |
| MJD | ||||
|---|---|---|---|---|
| 3887 | 14.04 | 12.98 | 11.92 | |
| 5743 | 14.07 | 12.94 | 11.89 | |
| 6050 | 13.95 | 12.99 | 12.05 | |
| 6776 | 12.93 | 11.97 | ||
| 7144 | 14.04 | 12.95 | 11.81 | |
| 7247 | 13.92 | 12.88 | 11.88 | |
| 7584 | 14.12 | 13.17 | 12.13 | |
| 7842 | 13.94 | 12.97 | 12.05 | |
| 7877 | 13.96 | 12.98 | 12.06 | |
| 8579 | 14.21 | 13.05 | 12.14 | |
| 8630 | 13.88 | 12.99 | 12.05 | |
| 9971 | 12.86 | 11.89 | ||
| 10115 | 14.01 | 12.88 | 12.07 | |
| 10509 | 13.85 | 12.96 | 12.01 | |
| 10600 | 14.18 | 13.06 | 12.09 | |
| 10721 | 13.79 | 12.93 | 11.96 | |
| 10866 | 13.87 | 12.81 | 11.90 | 10.34 |
| MJD | ||||
|---|---|---|---|---|
| 4320 | 10.83 | 9.86 | 9.44 | |
| 5266 | 10.79 | 9.88 | 9.50 | |
| 5343 | 10.84 | 9.90 | 9.48 | 8.68 |
| 7347 | 10.83 | 9.81 | 9.44 | 8.75 |
| 7580 | 10.82 | 9.86 | 9.44 | 8.76 |
| 7839 | 10.84 | 9.86 | 9.47 | 8.78 |
| 7876 | 10.84 | 9.87 | 9.45 | 8.74 |
| 7967 | 10.84 | 9.90 | 9.47 | 8.74 |
| 8172 | 10.82 | 9.86 | 9.45 | 8.80 |
| 8874 | 10.83 | 9.85 | 9.48 | 8.80 |
| 9972 | 10.82 | 9.85 | 9.43 | 8.64 |
| 10113 | 10.81 | 9.81 | 9.40 | 8.62 |
| 10507 | 10.83 | 9.86 | 9.44 | 8.74 |
| 11600 | 10.88 | 9.88 | 9.47 | 8.61 |
| 11602 | 10.79 | 9.83 | 9.44 | 8.52 |
| MJD | ||||
|---|---|---|---|---|
| 4974 | 12.23 | 11.22 | 10.05 | 8.28 |
| 5042 | 12.28 | 11.16 | 10.05 | 8.13 |
| 6050 | 12.47 | 11.33 | 10.18 | 8.32 |
| 6118 | 12.43 | 11.33 | 10.18 | 8.40 |
| 6780 | 12.27 | 11.16 | 9.99 | 8.27 |
| 6925 | 12.25 | 11.12 | 9.99 | 8.26 |
| 7243 | 12.37 | 11.24 | 10.09 | 8.24 |
| 7347 | 12.34 | 11.15 | 10.05 | 8.27 |
| 7579 | 12.41 | 11.21 | 10.08 | 8.31 |
| 7580 | 12.41 | 11.21 | 10.09 | 8.22 |
| 7634 | 12.37 | 11.15 | 10.06 | 8.24 |
| 7839 | 12.39 | 11.21 | 10.06 | 8.18 |
| 7876 | 12.43 | 11.26 | 10.10 | 8.30 |
| 7967 | 12.49 | 11.30 | 10.18 | 8.24 |
| 8173 | 12.53 | 11.35 | 10.23 | 8.35 |
| 8576 | 12.39 | 11.23 | 10.13 | 8.38 |
| 8629 | 12.35 | 11.17 | 10.11 | 8.31 |
| 8633 | 12.29 | 11.17 | 10.11 | 8.37 |
| 8634 | 12.30 | 11.18 | 10.09 | 8.28 |
| 8734 | 12.29 | 11.10 | 10.04 | 8.27 |
| 8875 | 12.32 | 11.12 | 10.00 | 8.25 |
| 8902 | 12.27 | 11.13 | 9.98 | 8.26 |
| 9255 | 12.41 | 11.28 | 10.11 | 8.30 |
| 9615 | 12.48 | 11.36 | 10.23 | 8.37 |
| 9971 | 12.33 | 11.16 | 10.05 | 8.44 |
| 10053 | 12.21 | 11.11 | 10.01 | 8.25 |
| 10113 | 12.25 | 11.05 | 9.95 | 8.30 |
| 10116 | 12.21 | 11.05 | 9.96 | 8.30 |
| 10411 | 12.20 | 11.06 | 9.93 | 8.16 |
| 10509 | 12.18 | 11.05 | 9.93 | 8.10 |
| 10742 | 12.27 | 11.11 | 10.01 | 8.27 |
| 11115 | 12.24 | 11.03 | 9.86 | 8.14 |
| 11597 | 12.41 | 11.22 | 10.09 | 8.25 |
| MJD | |||||
|---|---|---|---|---|---|
| 5341 | 12.71 | 11.84 | 11.14 | ||
| 6923 | 12.71 | 11.81 | 11.15 | 9.89 | .17 |
| 7243 | 12.70 | 11.83 | 11.12 | 10.00 | .10 |
| 7581 | 12.71 | 11.83 | 11.16 | 10.03 | .07 |
| 7634 | 12.79 | 11.88 | 11.18 | ||
| 7967 | 12.73 | 11.88 | 11.17 | 10.34 | .16 |
| 8629 | 12.76 | 11.84 | 11.21 | 10.21 | .14 |
| 8734 | 12.68 | 11.78 | 11.12 | 10.22 | .12 |
| 10114 | 12.79 | 11.84 | 11.17 | 9.97 | .16 |
| 10116 | 12.74 | 11.84 | 11.17 | 10.16 | .18 |
| 10511 | 12.86 | 11.94 | 11.34 | 10.15 | .20 |
| 10868 | 12.75 | 11.86 | 11.23 | 10.15 | .13 |
| MJD | ||||
|---|---|---|---|---|
| 10114 | 11.71 | 10.61 | 9.46 | 7.90 |
| 10116 | 11.70 | 10.64 | 9.51 | 7.90 |
| 10213 | 11.68 | 10.60 | 9.50 | 7.93 |
| 10510 | 11.58 | 10.52 | 9.42 | 7.88 |
| 10867 | 11.75 | 10.37 | 9.25 | 7.72 |
| 10950 | 11.51 | 10.42 | 9.34 | 7.83 |
| 11597 | 11.74 | 10.57 | 9.39 | 7.90 |
| MJD | |||||
|---|---|---|---|---|---|
| 3596 | 11.02 | 10.06 | 9.40 | 8.30 | .15 |
| 3681 | 11.15 | 10.17 | 9.50 | 8.38 | .05 |
| 4318 | 11.16 | 10.16 | 9.63 | ||
| 4920 | 11.20 | 10.29 | 9.80 | ||
| 5082 | 11.07 | 10.15 | 9.60 | 8.42 | .28 |
| 5340 | 11.20 | 10.23 | 9.58 | 8.69 | .05 |
| 5740 | 11.18 | 10.16 | 9.63 | 8.60 | .07 |
| 5845 | 11.23 | 10.24 | 9.76 | 8.78 | .06 |
| 6117 | 11.19 | 10.21 | 9.68 | 8.55 | .05 |
| 6194 | 11.10 | 10.09 | 9.53 | 8.68 | .03 |
| 6476 | 11.18 | 10.20 | 9.69 | 8.84 | .07 |
| 6478 | 11.17 | 10.19 | 9.68 | 8.77 | .10 |
| 6581 | 11.16 | 10.19 | 9.69 | 8.94 | .08 |
| 6610 | 11.21 | 10.20 | 9.69 | 8.99 | .07 |
| 6846 | 11.20 | 10.24 | 9.78 | ||
| 6850 | 11.19 | 10.27 | 9.81 | 9.14 | .08 |
| 6923 | 11.15 | 10.19 | 9.73 | 9.03 | .04 |
| 6989 | 11.18 | 10.21 | 9.77 | ||
| 7163 | 11.23 | 10.35 | 9.43 | ||
| 7212 | 10.92 | 9.95 | 9.27 | ||
| 7243 | 11.00 | 09.93 | 9.21 | 8.16 | .05 |
| 7247 | 10.99 | 09.93 | 9.23 | 8.21 | .04 |
| 7248 | 11.00 | 09.94 | 9.25 | 8.22 | .05 |
| 7342 | 11.17 | 10.13 | 9.48 | 8.29 | .06 |
| 7343 | 11.17 | 10.14 | 9.50 | 8.41 | .03 |
| 7509 | 11.12 | 10.09 | 9.45 | 8.41 | .05 |
| 7580 | 11.21 | 10.17 | 9.58 | 8.53 | .04 |
| 7581 | 11.18 | 10.13 | 9.58 | 8.57 | .02 |
| 7629 | 11.13 | 10.13 | 9.55 | 8.51 | .07 |
| 7839 | 11.16 | 10.18 | 9.67 | ||
| 7964 | 11.18 | 10.17 | 9.63 | 8.64 | .04 |
| 8042 | 11.19 | 10.22 | 9.72 | 8.80 | .02 |
| 8576 | 11.22 | 10.21 | 9.74 | 8.99 | .06 |
| 8629 | 11.23 | 10.22 | 9.74 | 8.90 | .05 |
| 8633 | 11.20 | 10.20 | 9.74 | 8.86 | .05 |
| 8674 | 11.30 | 10.32 | 9.86 | 9.01 | .08 |
| 8731 | 11.21 | 10.19 | 9.76 | 9.08 | .06 |
| 8733 | 11.24 | 10.23 | 9.81 | ||
| 8734 | 11.19 | 10.21 | 9.78 | 9.14 | .07 |
| 8995 | 11.19 | 10.20 | 9.76 | 8.94 | .08 |
| 9890 | 11.24 | 10.24 | 9.80 | 9.34 | .05 |
| 10053 | 11.23 | 10.19 | 9.73 | 9.22 | .07 |
| 10113 | 11.20 | 10.21 | 9.75 | 9.11 | .07 |
| 10213 | 11.23 | 10.21 | 9.81 | 9.22 | .10 |
| 10411 | 11.21 | 10.22 | 9.75 | 9.14 | .08 |
| 10507 | 11.24 | 10.23 | 9.78 | 9.26 | .05 |
| 10509 | 11.21 | 10.22 | 9.76 | 9.13 | .08 |
| 10615 | 11.24 | 10.21 | 9.79 | 9.09 | .06 |
| 10863 | 11.15 | 10.23 | 9.79 | 9.21 | .09 |
| 10948 | 11.18 | 10.16 | 9.75 | 9.07 | .03 |
| 11599 | 11.19 | 10.19 | 9.65 | 8.87 | .11 |
| MJD | |||||
|---|---|---|---|---|---|
| 3887 | 11.48 | 10.52 | 9.86 | 8.40 | 0.12 |
| 4001 | 11.40 | 10.48 | 9.85 | 8.44 | 0.12 |
| 5046 | 11.29 | 10.45 | 9.88 | ||
| 6612 | 11.33 | 10.43 | 9.84 | 8.63 | 0.05 |
| 6886 | 11.39 | 10.53 | 10.03 | ||
| 6923 | 11.34 | 10.50 | 9.95 | 8.62 | 0.04 |
| 6985 | 11.45 | 10.56 | 10.05 | 8.89 | 0.05 |
| 7246 | 11.32 | 10.41 | 9.87 | 8.65 | 0.05 |
| 7343 | 11.45 | 10.49 | 9.93 | 8.88 | 0.07 |
| 7581 | 11.42 | 10.58 | 10.13 | 9.03 | 0.03 |
| 7634 | 11.44 | 10.55 | 10.11 | 9.06 | 0.04 |
| 7876 | 11.40 | 10.52 | 10.05 | 9.03 | 0.08 |
| 7968 | 11.41 | 10.55 | 10.10 | 9.09 | 0.06 |
| 8629 | 11.39 | 10.51 | 10.01 | 8.84 | 0.06 |
| 8634 | 11.40 | 10.51 | 10.02 | 8.88 | 0.04 |
| 8671 | 11.39 | 10.52 | 10.01 | 9.04 | 0.07 |
| 8731 | 11.38 | 10.54 | 10.09 | ||
| 8733 | 11.39 | 10.51 | 10.08 | 9.11 | 0.05 |
| 8734 | 11.39 | 10.50 | 10.08 | 8.95 | 0.06 |
| 10113 | 11.33 | 10.37 | 9.76 | 8.60 | 0.04 |
| 10213 | 11.32 | 10.40 | 9.82 | 8.65 | 0.03 |
| 10509 | 11.35 | 10.44 | 9.88 | 8.65 | 0.06 |
| 10866 | 11.35 | 10.40 | 9.81 | 8.45 | 0.04 |
| 10949 | 11.36 | 10.42 | 9.82 | 8.56 | 0.03 |
| 11597 | 11.35 | 10.46 | 9.90 | 8.84 | 0.08 |
| MJD | ||||
|---|---|---|---|---|
| 2225 | 9.55 | |||
| 2822 | 9.71 | 8.69 | ||
| 3322 | 11.41 | 10.54 | 9.60 | |
| 3511 | 9.82 | |||
| 3602 | 11.54 | 10.67 | 10.09 | |
| 3680 | 10.26 | |||
| 3888 | 10.00 | |||
| 4001 | 11.70 | 10.89 | 10.14 | 8.49 |
| 4266 | 11.38 | 10.45 | 9.71 | |
| 5081 | 11.17 | 10.21 | 9.40 | 8.05 |
| 5382 | 11.44 | 10.48 | 9.66 | |
| 5387 | 11.41 | 10.43 | 9.60 | |
| 5416 | 11.28 | 10.39 | 9.57 | 8.18 |
| 5687 | 11.39 | 10.48 | 9.69 | |
| 5740 | 11.45 | 10.57 | 9.80 | 8.41 |
| 5846 | 11.35 | 10.48 | 9.77 | 8.49 |
| 5886 | 11.36 | 10.45 | 9.75 | 8.52 |
| 5887 | 11.36 | 10.46 | 9.75 | 8.48 |
| 5889 | 11.32 | 10.43 | 9.72 | 8.34 |
| 6117 | 11.34 | 10.47 | 9.72 | 8.54 |
| 6122 | 11.33 | 10.49 | 9.78 | 8.46 |
| 6194 | 11.25 | 10.34 | 9.60 | 8.35 |
| 6195 | 11.33 | 10.34 | 9.60 | 8.32 |
| 6198 | 11.30 | 10.39 | 9.64 | 8.45 |
| 6199 | 11.28 | 10.36 | 9.60 | 8.34 |
| 6476 | 11.18 | 10.23 | 9.41 | 8.09 |
| 6477 | 11.21 | 10.24 | 9.41 | 8.06 |
| 6479 | 11.20 | 10.24 | 9.41 | 8.00 |
| 6580 | 11.25 | 10.28 | 9.47 | 8.23 |
| 6582 | 11.26 | 10.30 | 9.51 | 8.07 |
| 6607 | 11.31 | 10.34 | 9.52 | 8.18 |
| 6844 | 11.33 | 10.37 | 9.61 | 8.33 |
| 6845 | 11.30 | 10.36 | 9.58 | 8.33 |
| 6846 | 11.30 | 10.36 | 9.58 | 8.26 |
| 6848 | 11.29 | 10.37 | 9.58 | 8.27 |
| 6850 | 11.26 | 10.35 | 9.57 | 8.21 |
| 6886 | 11.25 | 10.35 | 9.57 | 8.27 |
| 6923 | 11.30 | 10.32 | 9.53 | 8.25 |
| 6984 | 11.39 | 10.45 | 9.61 | 8.26 |
| 6988 | 11.37 | 10.41 | 9.64 | 8.23 |
| 7243 | 11.33 | 10.43 | 9.67 | 8.29 |
| 7246 | 11.32 | 10.42 | 9.65 | 8.26 |
| 7247 | 11.32 | 10.42 | 9.66 | 8.31 |
| 7248 | 11.34 | 10.44 | 9.69 | 8.34 |
| 7342 | 11.42 | 10.56 | 9.87 | 8.49 |
| 7579 | 11.27 | 10.42 | 9.76 | 8.54 |
| 7580 | 11.27 | 10.44 | 9.78 | 8.60 |
| 7581 | 11.31 | 10.45 | 9.77 | 8.53 |
| 7584 | 11.26 | 10.43 | 9.73 | 8.45 |
| 7585 | 11.29 | 10.42 | 9.75 | 8.58 |
| 7628 | 11.16 | 10.28 | 9.55 | 8.30 |
| 7629 | 11.14 | 10.27 | 9.52 | 8.26 |
| 7634 | 11.14 | 10.27 | 9.54 | 8.27 |
| 7676 | 11.17 | 10.23 | 9.44 | 8.22 |
| 7748 | 11.21 | 10.28 | 9.49 | 8.18 |
| 7842 | 11.27 | 10.35 | 9.55 | 8.25 |
| 7876 | 11.28 | 10.35 | 9.56 | 8.22 |
| 7967 | 11.23 | 10.32 | 9.55 | 8.24 |
| 7968 | 11.23 | 10.30 | 9.53 | 8.23 |
| 8042 | 11.25 | 10.34 | 9.58 | 8.18 |
| 8227 | 11.10 | 10.17 | 9.36 | 7.99 |
| 8576 | 11.33 | 10.43 | 9.71 | 8.32 |
| 8593 | 11.41 | 10.52 | 9.76 | 8.37 |
| 8629 | 11.33 | 10.44 | 9.70 | 8.40 |
| 8630 | 11.37 | 10.44 | 9.71 | 8.35 |
| 8632 | 11.33 | 10.44 | 9.70 | 8.32 |
| 8633 | 11.35 | 10.43 | 9.70 | 8.34 |
| MJD | ||||
|---|---|---|---|---|
| 8634 | 11.34 | 10.45 | 9.71 | 8.37 |
| 8671 | 11.35 | 10.46 | 9.69 | 8.34 |
| 8674 | 11.32 | 10.42 | 9.67 | 8.29 |
| 8675 | 11.32 | 10.41 | 9.65 | 8.23 |
| 8700 | 11.40 | 10.45 | 9.70 | 8.39 |
| 8727 | 11.33 | 10.43 | 9.69 | 8.34 |
| 8731 | 11.34 | 10.45 | 9.72 | 8.31 |
| 8733 | 11.35 | 10.43 | 9.69 | 8.38 |
| 8734 | 11.33 | 10.45 | 9.70 | 8.39 |
| 8765 | 11.24 | 10.44 | 9.72 | 8.30 |
| 8768 | 11.28 | 10.47 | 9.72 | 8.36 |
| 8783 | 11.17 | 10.39 | 9.65 | 8.31 |
| 8786 | 11.09 | 10.27 | 9.62 | 8.32 |
| 8789 | 11.16 | 10.34 | 9.60 | 8.32 |
| 8790 | 11.07 | 10.27 | 9.58 | 8.24 |
| 8792 | 11.16 | 10.35 | 9.63 | 8.27 |
| 8804 | 11.13 | 10.29 | 9.59 | 8.22 |
| 8834 | 11.20 | 10.35 | 9.60 | 8.26 |
| 8993 | 11.22 | 10.21 | 9.36 | 8.00 |
| 9890 | 11.58 | 10.68 | 9.98 | 8.57 |
| 10113 | 11.48 | 10.53 | 9.82 | 8.45 |
| 10117 | 11.41 | 10.58 | 9.86 | 8.54 |
| 10214 | 11.46 | 10.59 | 9.93 | 8.58 |
| 10304 | 11.39 | 10.49 | 9.80 | 8.47 |
| 10411 | 11.33 | 10.44 | 9.75 | 8.53 |
| 10509 | 11.32 | 10.34 | 9.58 | 8.25 |
| 10615 | 11.35 | 10.36 | 9.55 | 8.16 |
| 10655 | 11.42 | 10.45 | 9.66 | 8.26 |
| 10657 | 11.42 | 10.45 | 9.64 | 8.19 |
| 10863 | 11.43 | 10.57 | 9.90 | 8.42 |
| 10948 | 11.40 | 10.48 | 9.79 | 8.38 |
| 11597 | 11.38 | 10.45 | 9.71 | 8.51 |
| 11600 | 11.31 | 10.46 | 9.94 | 8.46 |
| MJD | |||||
|---|---|---|---|---|---|
| 6611 | 12.84 | 12.00 | 11.33 | 10.33 | .10 |
| 6582 | 12.90 | 12.00 | 11.36 | ||
| 6847 | 11.35 | 10.43 | .19 | ||
| 7246 | 12.96 | 12.06 | 11.36 | ||
| 7581 | 12.91 | 12.10 | 11.41 | 10.36 | .07 |
| 7634 | 12.94 | 12.04 | 11.35 | 10.63 | .00 |
| 7967 | 13.00 | 12.15 | 11.42 | 10.14 | .11 |
| 7968 | 12.99 | 12.15 | 11.40 | 10.23 | .12 |
| 8042 | 12.87 | 12.12 | 11.38 | 10.27 | .09 |
| 8633 | 12.73 | 11.90 | 11.13 | 10.01 | .11 |
| 10114 | 13.43 | 12.47 | 11.77 | 10.44 | .23 |
| 10214 | 13.40 | 12.55 | 11.79 | ||
| 10510 | 13.13 | 12.34 | 11.64 | 10.72 | .17 |
| 10615 | 13.32 | 12.39 | 11.63 | ||
| 11599 | 13.10 | 12.19 | 11.54 | 10.00 | .16 |
| MJD | |||
|---|---|---|---|
| 5083 | 13.18 | 12.39 | 11.91 |
| 5741 | 13.16 | 12.48 | 11.92 |
| 5846 | 13.14 | 12.34 | 11.88 |
| 5887 | 13.14 | 12.36 | 11.96 |
| 6120 | 13.16 | 12.42 | 11.95 |
| 6477 | 13.06 | 12.26 | 11.80 |
| 6578 | 13.00 | 12.25 | 11.81 |
| 6610 | 13.06 | 12.23 | 11.81 |
| 6923 | 13.04 | 12.22 | 11.77 |
| 7246 | 13.00 | 12.25 | 11.78 |
| 7634 | 13.09 | 12.20 | 11.81 |
| 10116 | 13.07 | 12.24 | 11.81 |
| 10510 | 13.12 | 12.25 | 11.85 |
| MJD | ||||
|---|---|---|---|---|
| 5081 | 11.08 | 10.28 | 09.80 | |
| 5419 | 11.20 | 10.36 | 09.87 | 08.90 |
| 6116 | 11.14 | 10.24 | 09.69 | 08.69 |
| 6117 | 11.15 | 10.27 | 09.71 | 08.88 |
| 6120 | 11.12 | 10.26 | 09.75 | 08.75 |
| 6122 | 11.15 | 10.28 | 09.76 | 08.81 |
| 6111 | 11.12 | 10.22 | 09.63 | 08.71 |
| 6112 | 11.11 | 10.23 | 09.67 | 08.61 |
| 6114 | 11.14 | 10.26 | 09.70 | 08.78 |
| 6194 | 11.22 | 10.43 | 09.92 | 08.99 |
| 6195 | 11.19 | 10.33 | 09.78 | 08.90 |
| 6199 | 11.22 | 10.37 | 09.89 | 09.06 |
| 6477 | 11.11 | 10.26 | 09.73 | 08.88 |
| 6478 | 11.10 | 10.23 | 09.72 | 08.84 |
| 6479 | 11.12 | 10.25 | 09.74 | 08.88 |
| 6582 | 11.05 | 10.12 | 09.54 | 08.54 |
| 6609 | 11.06 | 10.16 | 09.56 | 08.73 |
| 6845 | 11.08 | 10.18 | 09.68 | 08.51 |
| 6923 | 11.11 | 10.24 | 09.68 | 08.61 |
| 6985 | 11.07 | 10.20 | 09.67 | 08.60 |
| 6988 | 11.08 | 10.24 | 09.69 | 08.71 |
| 7246 | 11.05 | 10.16 | 09.59 | 08.52 |
| 7584 | 11.21 | 10.33 | 09.87 | 08.95 |
| 7634 | 11.20 | 10.32 | 09.89 | 08.99 |
| 7967 | 11.21 | 10.35 | 09.93 | 09.03 |
| 7968 | 11.20 | 10.35 | 09.92 | 09.25 |
| 8042 | 11.22 | 10.33 | 09.91 | 09.14 |
| 8630 | 11.09 | 10.20 | 09.65 | 08.69 |
| 8634 | 11.10 | 10.18 | 09.64 | 08.78 |
| 8671 | 11.14 | 10.23 | 09.70 | 08.82 |
| 8674 | 11.18 | 10.22 | 09.70 | 08.79 |
| 8727 | 11.13 | 10.23 | 9.77 | 8.82 |
| 8731 | 11.10 | 10.22 | 9.72 | 8.83 |
| 8733 | 11.16 | 10.23 | 9.73 | 8.78 |
| 8734 | 11.10 | 10.22 | 9.73 | 8.86 |
| 9890 | 11.12 | 10.20 | 9.68 | 8.77 |
| 10114 | 11.11 | 10.17 | 9.62 | 8.57 |
| 10509 | 11.10 | 10.13 | 9.53 | 8.38 |
| 10615 | 11.05 | 10.15 | 9.65 | 8.58 |
| 10657 | 11.09 | 10.18 | 9.64 | 8.53 |
| 10948 | 11.10 | 10.19 | 9.63 | 8.59 |
| MJD | |||||
|---|---|---|---|---|---|
| 6194 | 12.05 | 11.25 | 10.76 | 10.15 | 0.21 |
| 6197 | 12.05 | 11.26 | 10.76 | 10.05 | 0.09 |
| 6923 | 12.16 | 11.36 | 10.98 | 10.37 | 0.12 |
| 6984 | 12.16 | 11.38 | 10.98 | 10.46 | 0.21 |
| 7246 | 12.12 | 11.35 | 10.91 | ||
| 7579 | 12.17 | 11.36 | 10.98 | ||
| 7580 | 12.17 | 11.39 | 11.02 | 10.54 | 0.14 |
| 7634 | 12.15 | 11.31 | 10.94 | 10.51 | 0.11 |
| 7967 | 12.20 | 11.35 | 10.99 | 11.44 | 0.11 |
| 8042 | 12.20 | 11.36 | 11.02 | 10.43 | 0.10 |
| 8674 | 12.21 | 11.39 | 11.03 | ||
| 8734 | 12.19 | 11.41 | 11.04 | 10.79 | 0.30 |
| 10115 | 12.21 | 11.37 | 11.02 | 10.60 | 0.26 |
| 10510 | 12.17 | 11.35 | 10.97 | 10.58 | 0.15 |
| MJD | |||||
|---|---|---|---|---|---|
| 6886 | 10.80 | 9.64 | 8.75 | 7.50 | |
| 6923 | 10.79 | 9.63 | 8.75 | 7.49 | |
| 6984 | 10.80 | 9.61 | 8.70 | 7.45 | |
| 6989 | 10.88 | 9.67 | 8.79 | 7.57 | |
| 7245 | 10.80 | 9.67 | 8.76 | 7.57 | |
| 7246 | 10.83 | 9.70 | 8.80 | 7.56 | |
| 7342 | 10.88 | 9.76 | 8.85 | 7.62 | |
| 7580 | 10.88 | 9.74 | 8.86 | 7.56 | |
| 7634 | 10.89 | 9.72 | 8.84 | 7.56 | |
| 7967 | 10.94 | 9.83 | 8.96 | 7.75 | |
| 8042 | 10.96 | 9.84 | 8.96 | 7.75 | |
| 8629 | 11.00 | 9.88 | 9.03 | 7.75 | |
| 8633 | 11.00 | 9.89 | 9.04 | 7.73 | |
| 8674 | 10.99 | 9.89 | 9.04 | 7.72 | |
| 8675 | 10.99 | 9.89 | 9.03 | 7.77 | |
| 8731 | 10.98 | 9.86 | 9.01 | 7.78 | |
| 8733 | 10.93 | 9.81 | 8.94 | 7.71 | |
| 8734 | 10.99 | 9.85 | 8.98 | 7.78 | |
| 9889 | 11.05 | 9.96 | 9.14 | 7.94 | |
| 10114 | 11.02 | 9.92 | 9.10 | 7.87 | |
| 10304 | 11.07 | 9.98 | 9.16 | 8.00 | |
| 10509 | 11.04 | 9.94 | 9.13 | 7.94 | |
| 10614 | 11.08 | 9.97 | 9.14 | 7.96 | |
| 10656 | 11.07 | 9.98 | 9.17 | 7.95 | |
| 10863 | 11.09 | 10.02 | 9.19 | 7.83 | |
| 10948 | 11.10 | 10.03 | 9.18 | 8.03 | |
| 11599 | 11.00 | 9.96 | 9.18 | 7.93 |
| MJD | |||||
|---|---|---|---|---|---|
| 3887 | 11.60 | 10.65 | 9.87 | 8.52 | .10 |
| 4318 | 11.42 | 10.50 | 9.75 | ||
| 4720 | 11.36 | 10.47 | 9.84 | ||
| 5849 | 11.50 | 10.62 | 9.97 | 8.64 | .05 |
| 5887 | 11.51 | 10.66 | 10.00 | 8.76 | .05 |
| 5889 | 11.53 | 10.66 | 9.98 | 8.78 | .07 |
| 6117 | 11.40 | 10.51 | 9.83 | 8.59 | .05 |
| 6194 | 11.42 | 10.55 | 9.87 | 8.71 | .04 |
| 6195 | 11.42 | 10.51 | 9.88 | 8.56 | .05 |
| 6476 | 11.46 | 10.53 | 9.82 | 8.50 | .06 |
| 6478 | 11.50 | 10.54 | 9.85 | 8.59 | .08 |
| 6582 | 11.37 | 10.52 | 9.90 | 8.60 | .03 |
| 6610 | 11.43 | 10.55 | 9.91 | 8.59 | .06 |
| 6845 | 11.51 | 10.61 | 9.95 | 8.72 | .05 |
| 6848 | 11.48 | 10.60 | 9.97 | 8.73 | .06 |
| 6923 | 11.45 | 10.60 | 9.97 | 8.74 | .05 |
| 6984 | 11.40 | 10.53 | 9.92 | 8.67 | .05 |
| 7243 | 11.43 | 10.50 | 9.84 | 8.60 | .03 |
| 7581 | 11.48 | 10.59 | 9.88 | 8.60 | .04 |
| 7967 | 11.44 | 10.56 | 9.87 | 8.60 | .04 |
| 8042 | 11.55 | 10.60 | 9.96 | 8.70 | .04 |
| 8731 | 11.51 | 10.55 | 9.91 | 8.73 | .04 |
| 10117 | 11.52 | 10.53 | 9.84 | 8.70 | .03 |
| 10510 | 11.48 | 10.50 | 9.85 | 8.65 | .04 |
| 10948 | 11.39 | 10.55 | 9.87 | 8.57 | .02 |
| MJD | |||||
|---|---|---|---|---|---|
| 3325 | 11.14 | 10.22 | 9.38 | 7.93 | |
| 3602 | 11.12 | 10.27 | 9.38 | 7.80 | |
| 3682 | 11.16 | 10.19 | 9.32 | 7.90 | |
| 4320 | 11.00 | 10.02 | 9.12 | ||
| 4323 | 9.29 | 7.57 | |||
| 4720 | 11.02 | 10.06 | 9.16 | ||
| 5849 | 10.94 | 9.97 | 9.09 | 7.64 | |
| 5887 | 10.93 | 9.94 | 9.04 | 7.59 | |
| 5889 | 10.94 | 9.95 | 9.05 | 7.65 | |
| 6194 | 11.06 | 10.00 | 9.10 | ||
| 6195 | 10.96 | 9.99 | 9.12 | 7.61 | |
| 6216 | 10.95 | 10.00 | 9.10 | 7.55 | |
| 6607 | 11.04 | 10.03 | 9.13 | 7.56 | |
| 6845 | 11.02 | 10.03 | 9.14 | 7.72 | |
| 6849 | 11.07 | 10.03 | 9.15 | 7.66 | |
| 6923 | 11.09 | 10.11 | 9.23 | 7.77 | |
| 6925 | 11.07 | 10.10 | 9.22 | 7.68 | |
| 6984 | 11.11 | 10.14 | 9.26 | 7.80 | |
| 7243 | 11.06 | 10.13 | 9.29 | 7.80 | |
| 7342 | 10.99 | 10.06 | 9.24 | 7.77 | |
| 7581 | 11.05 | 10.03 | 9.14 | 7.68 | |
| 7584 | 11.07 | 10.04 | 9.15 | 7.67 | |
| 7634 | 11.05 | 10.02 | 9.15 | 7.73 | |
| 7967 | 10.94 | 9.92 | 9.04 | 7.54 | |
| 8042 | 10.94 | 9.95 | 9.05 | 7.62 | |
| 8630 | 10.88 | 9.84 | 8.92 | 7.39 | |
| 8632 | 10.91 | 9.86 | 8.93 | 7.48 | |
| 8633 | 10.90 | 9.85 | 8.93 | 7.39 | |
| 8671 | 10.87 | 9.85 | 8.93 | 7.43 | |
| 8731 | 10.87 | 9.84 | 8.92 | 7.47 | |
| 8734 | 10.89 | 9.83 | 8.93 | 7.42 | |
| 9889 | 10.95 | 10.02 | 9.14 | 7.63 | |
| 10114 | 11.01 | 10.04 | 9.21 | 7.60 | |
| 10304 | 10.91 | 9.92 | 9.05 | 7.60 | |
| 10509 | 11.07 | 10.04 | 9.16 | 7.59 | |
| 10614 | 11.03 | 10.04 | 9.12 | 7.61 | |
| 10656 | 10.97 | 10.00 | 9.10 | 7.60 | |
| 10948 | 10.97 | 9.94 | 9.04 | 7.54 | |
| 11600 | 10.93 | 9.94 | 9.05 | 7.56 |
| MJD | |||||
|---|---|---|---|---|---|
| 3523 | 10.33 | 9.08 | 7.37 | ||
| 3525 | 11.69 | 10.30 | 9.06 | 7.35 | |
| 5104 | 11.51 | 9.99 | 8.68 | 7.13 | |
| 5846 | 11.67 | 10.23 | 8.97 | 7.26 | |
| 5886 | 11.64 | 10.19 | 8.96 | 7.33 | |
| 5890 | 11.62 | 10.21 | 8.96 | 7.32 | |
| 6116 | 11.42 | 9.89 | 8.62 | 7.05 | |
| 6117 | 11.43 | 9.92 | 8.66 | 7.08 | |
| 6122 | 11.45 | 9.92 | 8.68 | 7.06 | |
| 6107 | 11.34 | 9.81 | 8.56 | 7.05 | |
| 6110 | 11.39 | 9.87 | 8.62 | 7.17 | |
| 6112 | 11.40 | 9.87 | 8.64 | 7.10 | |
| 6198 | 11.47 | 9.99 | 8.76 | 7.17 | |
| 6477 | 11.41 | 9.87 | 8.62 | 7.08 | |
| 6582 | 11.49 | 9.99 | 8.70 | 7.12 | |
| 6609 | 11.47 | 9.98 | 8.72 | 7.13 | |
| 6845 | 11.32 | 9.71 | 8.38 | 6.86 | |
| 6846 | 11.33 | 9.72 | 8.40 | 6.82 | |
| 6847 | 11.35 | 9.75 | 8.44 | 6.91 | |
| 6850 | 11.32 | 9.71 | 8.39 | 6.88 | |
| 6923 | 11.46 | 9.90 | 8.56 | 6.96 | |
| 6925 | 11.49 | 9.90 | 8.57 | 7.02 | |
| 6984 | 11.46 | 9.93 | 8.60 | 7.05 | |
| 6989 | 11.47 | 9.89 | 8.59 | 6.96 | |
| 7243 | 11.43 | 9.89 | 8.58 | 6.99 | |
| 7581 | 11.55 | 9.88 | 8.55 | 7.01 | |
| 7584 | 11.50 | 9.86 | 8.55 | 6.92 | |
| 7628 | 11.47 | 9.86 | 8.56 | 6.94 | |
| 7634 | 11.46 | 9.87 | 8.55 | 6.94 | |
| 7967 | 11.50 | 9.97 | 8.67 | 7.02 | |
| 8042 | 11.44 | 10.00 | 8.67 | 7.09 | |
| 8671 | 11.56 | 10.03 | 8.77 | 7.13 | |
| 8674 | 11.53 | 10.01 | 8.74 | 7.15 | |
| 8733 | 11.59 | 9.99 | 8.72 | 7.15 | |
| 8734 | 11.50 | 9.95 | 8.69 | 7.12 | |
| 9890 | 11.51 | 10.14 | 8.83 | 7.23 | |
| 9891 | 11.64 | 10.15 | 8.86 | 7.18 | |
| 10117 | 11.61 | 10.12 | 8.82 | 7.16 | |
| 10213 | 11.58 | 10.10 | 8.80 | 7.13 | |
| 10509 | 11.59 | 10.17 | 8.93 | 7.33 | |
| 10615 | 11.62 | 10.17 | 8.94 | 7.26 | |
| 10657 | 11.63 | 10.14 | 8.89 | 7.29 | |
| 10949 | 11.65 | 10.18 | 8.97 | 7.32 | |
| 11599 | 11.46 | 9.96 | 8.74 | 7.22 |
| MJD | |||||
|---|---|---|---|---|---|
| 7243 | 11.62 | 10.81 | 10.10 | 8.91 | |
| 7246 | 11.62 | 10.83 | 10.10 | 8.83 | |
| 7241 | 11.61 | 10.79 | 10.08 | 8.67 | |
| 7248 | 11.59 | 10.78 | 10.08 | 8.74 | |
| 7342 | 11.66 | 10.80 | 10.06 | 8.65 | |
| 7581 | 11.67 | 10.81 | 10.06 | 8.79 | |
| 7584 | 11.69 | 10.76 | 10.02 | 8.89 | |
| 7628 | 11.59 | 10.71 | 9.99 | 8.65 | |
| 7634 | 11.63 | 10.71 | 9.98 | 8.84 | |
| 7748 | 11.67 | 10.71 | 9.94 | 8.56 | |
| 7967 | 11.81 | 10.88 | 10.13 | 8.77 | |
| 8042 | 11.79 | 10.96 | 10.29 | 9.00 |
| MJD | |||||
|---|---|---|---|---|---|
| 6194 | 12.62 | 11.61 | 10.75 | 9.40 | .07 |
| 6923 | 12.65 | 11.68 | 10.79 | 9.43 | .06 |
| 6984 | 12.75 | 11.81 | 10.86 | 9.42 | .06 |
| 7247 | 12.68 | 11.73 | 10.92 | 9.57 | .08 |
| 7585 | 12.77 | 11.82 | 11.02 | ||
| 7634 | 12.66 | 11.74 | 10.91 | 9.45 | .08 |
| 8733 | 12.74 | 11.68 | 10.78 | 9.42 | .09 |
| 9891 | 12.51 | 11.66 | 10.95 | 9.60 | .07 |
| 10509 | 12.58 | 11.57 | 10.75 | ||
| 10656 | 12.54 | 11.62 | 10.75 | 9.54 | .07 |
| MJD | |||||
|---|---|---|---|---|---|
| 4320 | 12.37 | 11.50 | 11.07 | ||
| 5844 | 12.22 | 11.43 | 11.03 | 9.73 | .11 |
| 6197 | 12.25 | 11.46 | 11.04 | 9.68 | .08 |
| 6608 | 12.25 | 11.47 | 11.09 | ||
| 6691 | 12.33 | 11.43 | 11.05 | 9.55 | .13 |
| 6923 | 12.25 | 11.43 | 11.03 | 9.70 | .09 |
| 6984 | 12.33 | 11.50 | 11.10 | 9.73 | .07 |
| 7243 | 12.26 | 11.40 | 11.05 | 9.75 | .13 |
| 7343 | 12.27 | 11.49 | 11.05 | 9.77 | .13 |
| 7433 | 12.30 | 11.44 | 11.06 | 9.78 | .05 |
| 7749 | 12.24 | 11.44 | 11.05 | 9.72 | .09 |
| 8042 | 12.25 | 11.43 | 11.02 | 9.73 | .09 |
| 8132 | 12.23 | 11.41 | 11.05 | 9.74 | .07 |
| 8167 | 12.24 | 11.43 | 11.06 | 9.66 | .05 |
| 8173 | 0.0 | 0.0 | 11.06 | 9.55 | .09 |
| 8528 | 12.25 | 11.45 | 11.07 | 9.88 | .13 |
| 8731 | 12.28 | 11.45 | 11.06 | 9.63 | .13 |
| 8733 | 12.31 | 11.44 | 11.08 | 9.73 | .08 |
| 9615 | 12.26 | 11.42 | 11.04 | 9.64 | .10 |
| 9889 | 12.21 | 11.42 | 11.02 | 9.75 | .10 |
| 9966 | 12.27 | 11.44 | 11.02 | 9.76 | .10 |
| 10212 | 12.27 | 11.42 | 11.05 | 9.76 | .11 |
| 10304 | 12.26 | 11.40 | 11.02 | 9.80 | .10 |
| 10615 | 12.30 | 11.42 | 11.03 | 9.79 | .10 |
| 10656 | 12.23 | 11.38 | 11.01 | 9.78 | .09 |
| 10948 | 12.27 | 11.43 | 11.05 | 9.63 | .06 |
| MJD | |||||
|---|---|---|---|---|---|
| 3029 | 12.01 | 10.88 | 9.92 | 8.45 | .09 |
| 4320 | 12.10 | 11.00 | 10.07 | ||
| 5595 | 12.02 | 11.00 | 10.20 | 8.70 | .03 |
| 5887 | 11.99 | 11.01 | 10.12 | 8.79 | .05 |
| 6923 | 12.04 | 11.09 | 10.29 | 8.95 | .06 |
| 6984 | 12.07 | 11.13 | 10.29 | 9.07 | .03 |
| 7243 | 12.00 | 11.08 | 10.26 | 8.97 | .07 |
| 7342 | 11.99 | 11.01 | 10.17 | 8.85 | .06 |
| 7343 | 11.98 | 10.99 | 10.22 | 8.81 | .05 |
| 7433 | 11.98 | 10.97 | 10.11 | 8.78 | .05 |
| 7749 | 11.94 | 10.90 | 10.04 | 8.68 | .03 |
| 7842 | 12.09 | 11.10 | 10.25 | 8.83 | .06 |
| 7967 | 11.88 | 10.81 | 9.96 | 8.63 | .06 |
| 8042 | 11.91 | 10.87 | 9.98 | 8.60 | .03 |
| 8132 | 11.95 | 10.88 | 10.01 | 8.65 | .03 |
| 8167 | 11.93 | 10.88 | 9.98 | 8.67 | .04 |
| 8528 | 11.95 | 10.92 | 10.06 | 8.72 | .05 |
| 8731 | 12.02 | 10.95 | 10.04 | 8.75 | .04 |
| 8733 | 11.97 | 10.92 | 10.03 | 8.71 | .04 |
| 8734 | 11.97 | 10.91 | 10.01 | 8.69 | .06 |
| 8875 | 12.00 | 10.99 | 10.14 | 8.84 | .03 |
| 9889 | 12.14 | 11.04 | 10.17 | 8.80 | .06 |
| 9966 | 12.17 | 11.14 | 10.26 | 8.75 | .05 |
| 9972 | 12.15 | 11.12 | 10.28 | 8.89 | .05 |
| 10213 | 12.06 | 10.99 | 10.16 | 8.80 | .05 |
| 10304 | 11.94 | 10.86 | 9.99 | 8.77 | .04 |
| 10614 | 11.94 | 10.90 | 10.06 | 8.74 | .04 |
| 10656 | 11.96 | 10.90 | 10.04 | 8.76 | .03 |
| 10948 | 12.01 | 10.93 | 10.01 | 8.66 | .03 |
| MJD | |||||
|---|---|---|---|---|---|
| 4320 | 12.00 | 10.98 | 10.05 | ||
| 5238 | 12.17 | 11.08 | 10.08 | ||
| 5596 | 12.42 | 11.42 | 10.42 | 8.94 | .04 |
| 5889 | 12.26 | 11.29 | 10.39 | 8.96 | .05 |
| 6197 | 12.18 | 11.21 | 10.27 | 8.92 | .02 |
| 6664 | 12.41 | 11.38 | 10.41 | 9.00 | .06 |
| 6694 | 12.38 | 11.41 | 10.47 | 9.15 | .12 |
| 6923 | 12.18 | 11.31 | 10.40 | 9.06 | .07 |
| 6984 | 12.27 | 11.26 | 10.36 | 8.97 | .04 |
| 7243 | 12.29 | 11.31 | 10.33 | 8.93 | .08 |
| 7342 | 12.55 | 11.51 | 10.52 | 9.01 | .07 |
| 7343 | 12.53 | 11.47 | 10.57 | 9.10 | .07 |
| 7433 | 12.43 | 11.53 | 10.62 | 9.08 | .03 |
| 7435 | 12.40 | 11.45 | 10.56 | 9.19 | .06 |
| 7748 | 12.21 | 11.37 | 10.50 | 9.16 | .05 |
| 7842 | 12.25 | 11.27 | 10.39 | 9.03 | .06 |
| 7967 | 12.36 | 11.36 | 10.43 | 9.15 | .07 |
| 8042 | 12.30 | 11.38 | 10.48 | 9.09 | .04 |
| 8132 | 12.30 | 11.33 | 10.46 | 9.15 | .04 |
| 8167 | 12.31 | 11.36 | 10.48 | 9.14 | .05 |
| 8528 | 12.35 | 11.36 | 10.44 | 9.04 | .07 |
| 8731 | 12.27 | 11.23 | 10.38 | 9.09 | .06 |
| 8734 | 12.23 | 11.25 | 10.35 | 9.01 | .07 |
| 8874 | 12.22 | 11.23 | 10.33 | 9.02 | .03 |
| 9255 | 12.25 | 11.33 | 10.45 | 9.06 | .06 |
| 9610 | 12.35 | 11.32 | 10.35 | 9.07 | .04 |
| 9889 | 12.59 | 11.56 | 10.64 | 9.15 | .07 |
| 9966 | 12.59 | 11.64 | 10.76 | 9.51 | .08 |
| 9972 | 12.53 | 11.63 | 10.75 | 9.21 | .05 |
| 10212 | 12.40 | 11.53 | 10.68 | 9.42 | .12 |
| 10302 | 12.45 | 11.46 | 10.63 | 9.39 | .06 |
| 10614 | 12.28 | 11.31 | 10.45 | 9.13 | .03 |
| 10655 | 12.19 | 11.27 | 10.44 | 9.17 | .07 |
| 10948 | 12.40 | 11.43 | 10.51 | 9.16 | .03 |
| MJD | |||||
|---|---|---|---|---|---|
| 3024 | 11.53 | 10.47 | 10.14 | ||
| 3683 | 11.53 | 10.71 | 10.32 | 9.80 | .25 |
| 5585 | 11.29 | 10.44 | 10.02 | 9.45 | .00 |
| 5888 | 11.37 | 10.47 | 10.06 | ||
| 6191 | 11.40 | 10.53 | 10.20 | 9.76 | .08 |
| 6287 | 11.44 | 10.58 | 10.25 | 9.73 | .13 |
| 6329 | 11.41 | 10.58 | 10.29 | 10.00 | .15 |
| 6984 | 11.41 | 10.58 | 10.31 | 10.01 | .09 |
| 7749 | 11.39 | 10.53 | 10.22 | 9.82 | .06 |
| 7968 | 11.40 | 10.54 | 10.20 | 9.85 | .14 |
| 8042 | 11.42 | 10.53 | 10.19 | 9.80 | .10 |
| 8132 | 11.45 | 10.54 | 10.20 | 9.89 | .07 |
| 8167 | 11.42 | 10.52 | 10.23 | 9.61 | .08 |
| 8172 | 10.21 | 9.80 | .07 | ||
| 8733 | 11.48 | 10.59 | 10.31 | 9.94 | .09 |
| 8876 | 11.43 | 10.55 | 10.29 | 9.98 | .06 |
| 9614 | 11.44 | 10.57 | 10.30 | 9.96 | .14 |
| 9889 | 11.39 | 10.52 | 10.19 | 9.91 | .12 |
| 9966 | 11.35 | 10.40 | 10.00 | 9.52 | .10 |
| 10059 | 10.15 | ||||
| 10213 | 11.41 | 10.54 | 10.28 | 10.27 | .18 |
| 10302 | 11.41 | 10.55 | 10.31 | 10.10 | .13 |
| 10614 | 11.40 | 10.52 | 10.25 | 9.89 | .09 |
| 10655 | 11.34 | 10.45 | 10.07 | 9.64 | .08 |
| 10742 | 11.41 | 10.54 | 10.16 | 9.61 | .22 |
| 10949 | 11.39 | 10.51 | 10.14 | 9.62 | .06 |
| MJD | ||||
|---|---|---|---|---|
| 5235 | 11.98 | 11.07 | 10.20 | |
| 5236 | 11.96 | 11.06 | 10.19 | |
| 5237 | 11.97 | 11.05 | 10.17 | |
| 5238 | 12.01 | 11.08 | 10.19 | |
| 5239 | 11.96 | 11.08 | 10.18 | |
| 5240 | 11.97 | 11.09 | 10.20 | |
| 5595 | 11.80 | 10.87 | 09.98 | 8.69 |
| 6195 | 11.91 | 10.92 | 09.96 | 8.58 |
| 6197 | 11.94 | 10.93 | 09.96 | |
| 6287 | 11.97 | 11.01 | 10.04 | 8.59 |
| 6663 | 11.92 | 11.02 | 10.11 | 8.63 |
| 6694 | 11.92 | 11.01 | 10.12 | 8.76 |
| 6985 | 11.93 | 10.99 | 10.11 | 8.78 |
| 7342 | 11.93 | 11.08 | 10.18 | 8.90 |
| 7436 | 12.10 | 11.03 | 10.13 | 8.78 |
| 7634 | 11.98 | 11.01 | 10.09 | |
| 7749 | 12.01 | 11.02 | 10.13 | 8.77 |
| 7840 | 12.07 | 11.10 | 10.19 | 8.71 |
| 7841 | 12.05 | 11.10 | 10.18 | 8.68 |
| 8042 | 11.89 | 11.00 | 10.11 | 8.74 |
| 8132 | 11.80 | 10.92 | 10.05 | 8.72 |
| 8167 | 11.85 | 10.89 | 10.04 | 8.78 |
| 8172 | 11.81 | 10.88 | 10.02 | 8.65 |
| 8572 | 12.15 | 11.23 | 10.37 | 8.88 |
| 8574 | 12.13 | 11.25 | 10.38 | 8.90 |
| 8576 | 12.09 | 11.25 | 10.37 | 8.86 |
| 8733 | 12.07 | 11.14 | 10.32 | 8.90 |
| 8734 | 12.05 | 11.17 | 10.32 | 8.87 |
| 8875 | 11.89 | 11.00 | 10.19 | 8.85 |
| 8876 | 11.83 | 10.98 | 10.19 | 8.92 |
| 8905 | 11.85 | 10.95 | 10.11 | |
| 9609 | 12.03 | 11.10 | 10.19 | 8.81 |
| 9614 | 12.08 | 11.10 | 10.18 | 8.80 |
| 9889 | 12.01 | 11.01 | 10.10 | 8.80 |
| 9891 | 11.97 | 11.01 | 10.10 | 8.80 |
| 9966 | 11.93 | 11.01 | 10.12 | 8.70 |
| 10212 | 11.94 | 11.04 | 10.14 | 8.68 |
| 10394 | 11.96 | 10.99 | 10.12 | 8.80 |
| 10614 | 12.24 | 11.27 | 10.37 | 8.97 |
| 10655 | 12.16 | 11.23 | 10.37 | 8.95 |
| 10720 | 12.06 | 11.19 | 10.33 | 8.89 |
| 10749 | 12.09 | 11.22 | 10.33 | |
| 10948 | 12.01 | 11.09 | 10.25 | 8.81 |
| 11117 | 11.99 | 11.00 | 10.10 | 8.87 |
| MJD | |||||
|---|---|---|---|---|---|
| 6696 | 12.38 | 11.42 | 10.54 | 9.36 | .09 |
| 7841 | 12.35 | 11.34 | 10.51 | 9.26 | .08 |
| 9971 | 12.40 | 11.44 | 10.55 | 9.14 | .07 |
| 10304 | 12.43 | 11.45 | 10.61 | 9.25 | .07 |
| 10656 | 12.51 | 11.64 | 10.81 | 9.46 | .06 |
| 10657 | 12.60 | 11.62 | 10.82 | ||
| 10948 | 12.64 | 11.61 | 10.84 | 9.45 | .03 |
| MJD | |||||
|---|---|---|---|---|---|
| 6691 | 13.34 | 12.31 | 11.43 | 9.95 | .09 |
| 8875 | 13.02 | 11.94 | 11.09 | 9.84 | .06 |
| 9615 | 13.51 | 12.60 | 11.81 | 10.26 | .12 |
| 10304 | 13.15 | 12.28 | 11.60 | 10.54 | .14 |
| 10658 | 13.28 | 12.33 | 11.48 | 10.28 | .13 |
| 10949 | 13.33 | 12.47 | 11.70 | 10.32 | .18 |
| MJD | ||||
|---|---|---|---|---|
| 3024 | 10.04 | 9.26 | 8.95 | |
| 4466 | 9.98 | 9.21 | 8.81 | |
| 5304 | 10.03 | 9.28 | 8.86 | 8.12 |
| 5305 | 10.05 | 9.29 | 8.85 | 8.15 |
| 5890 | 10.02 | 9.20 | 8.83 | 8.17 |
| 6197 | 10.06 | 9.24 | 8.87 | 8.20 |
| 6287 | 10.00 | 9.20 | 8.83 | 8.15 |
| 6582 | 10.02 | 9.20 | 8.80 | 8.11 |
| 6692 | 10.04 | 9.23 | 8.85 | 8.18 |
| 6780 | 10.07 | 9.23 | 8.84 | 8.18 |
| 6984 | 10.04 | 9.24 | 8.87 | 8.12 |
| 7342 | 10.05 | 9.25 | 8.85 | 8.10 |
| 7437 | 10.05 | 9.22 | 8.85 | 8.15 |
| 7749 | 10.03 | 9.21 | 8.82 | 8.06 |
| 7843 | 10.00 | 9.18 | 8.79 | 7.99 |
| 8173 | 10.06 | 9.18 | 8.79 | 7.99 |
| 8529 | 10.07 | 9.22 | 8.87 | 8.16 |
| 8575 | 10.07 | 9.25 | 8.88 | 8.17 |
| 8874 | 10.05 | 9.23 | 8.88 | 8.23 |
| 8905 | 10.08 | 9.25 | 8.92 | 8.27 |
| 9614 | 10.07 | 9.27 | 8.94 | 8.25 |
| 9890 | 10.09 | 9.27 | 8.96 | 8.45 |
| 9970 | 10.08 | 9.26 | 8.95 | 8.27 |
| 10213 | 10.07 | 9.24 | 8.95 | 8.32 |
| 10304 | 10.10 | 9.27 | 8.97 | 8.39 |
| 10658 | 10.06 | 9.26 | 8.93 | 8.38 |
| MJD | ||||
|---|---|---|---|---|
| 5279 | 9.28 | 8.21 | ||
| 5595 | 10.96 | 9.98 | 9.32 | 8.22 |
| 5887 | 10.91 | 9.94 | 9.22 | 8.10 |
| 5890 | 10.93 | 9.92 | 9.20 | 8.12 |
| 6197 | 10.97 | 9.98 | 9.26 | 8.13 |
| 6287 | 10.92 | 9.92 | 9.19 | 8.04 |
| 6663 | 11.00 | 10.01 | 9.33 | 8.18 |
| 6695 | 11.04 | 10.02 | 9.34 | 8.17 |
| 6778 | 10.99 | 10.05 | 9.36 | 8.26 |
| 6984 | 11.00 | 10.01 | 9.36 | 8.18 |
| 7342 | 11.00 | 10.05 | 9.43 | 8.18 |
| 7436 | 11.06 | 10.05 | 9.40 | 8.31 |
| 7753 | 11.12 | 10.22 | 9.72 | 8.85 |
| 7841 | 11.12 | 10.24 | 9.71 | 8.64 |
| 8132 | 11.00 | 10.01 | 9.35 | 8.28 |
| 8172 | 11.07 | 10.06 | 9.41 | 8.31 |
| 8529 | 10.95 | 9.94 | 9.21 | 8.04 |
| 8574 | 10.98 | 9.94 | 9.23 | 8.09 |
| 8874 | 10.95 | 9.95 | 9.27 | 8.08 |
| 8908 | 10.99 | 9.96 | 9.28 | 8.09 |
| 9614 | 11.05 | 10.02 | 9.35 | 8.20 |
| 9889 | 11.00 | 10.03 | 9.43 | 8.27 |
| 9966 | 10.98 | 10.00 | 9.30 | 8.14 |
| 10057 | 11.01 | 10.04 | 9.35 | 8.20 |
| 10212 | 10.95 | 9.98 | 9.28 | 8.19 |
| 10262 | 10.96 | 9.99 | 9.27 | 8.07 |
| 10302 | 11.00 | 10.01 | 9.36 | 8.18 |
| 10413 | 10.92 | 9.93 | 9.25 | 8.16 |
| 10614 | 10.93 | 9.92 | 9.22 | 8.06 |
| 10655 | 10.89 | 9.93 | 9.23 | 8.09 |
| 10721 | 10.81 | 9.83 | 9.11 | 7.97 |
| 10738 | 10.83 | 9.84 | 9.09 | 7.90 |
| 11114 | 10.91 | 9.86 | 9.09 | 7.97 |
| MJD | |||||
|---|---|---|---|---|---|
| 4484 | 12.45 | 11.45 | 10.54 | 9.10 | .09 |
| 4466 | 12.34 | 11.43 | 10.52 | ||
| 5887 | 12.08 | 11.16 | 10.32 | 9.08 | .06 |
| 5890 | 12.15 | 11.18 | 10.32 | 9.15 | .04 |
| 6197 | 12.11 | 11.12 | 10.20 | 8.99 | .05 |
| 6287 | 12.10 | 11.12 | 10.17 | 9.06 | .04 |
| 6664 | 12.20 | 11.24 | 10.25 | 8.99 | .08 |
| 6692 | 12.14 | 11.16 | 10.22 | 8.95 | .05 |
| 6778 | 12.34 | 11.24 | 10.29 | 8.81 | .05 |
| 6984 | 12.49 | 11.47 | 10.48 | 9.03 | .10 |
| 7142 | 12.62 | 11.64 | 10.72 | 9.22 | .08 |
| 7341 | 12.59 | 11.70 | 10.83 | 9.42 | .06 |
| 7342 | 12.72 | 11.73 | 10.91 | 9.35 | .09 |
| 7435 | 12.65 | 11.74 | 10.85 | 9.45 | .08 |
| 7346 | 12.63 | 11.73 | 10.87 | 9.43 | .10 |
| 7509 | 12.57 | 11.70 | 10.87 | 9.30 | .08 |
| 7748 | 12.76 | 11.84 | 10.99 | 9.63 | .11 |
| 7841 | 12.73 | 11.90 | 11.07 | 9.68 | .09 |
| 7843 | 12.80 | 11.85 | 11.09 | 9.76 | .12 |
| 7875 | 12.79 | 11.90 | 11.13 | 0.02 | .13 |
| 7876 | 12.78 | 11.88 | 11.12 | 9.45 | .10 |
| 8042 | 12.68 | 11.80 | 11.07 | 9.68 | .07 |
| 8132 | 12.64 | 11.72 | 10.93 | 9.61 | .06 |
| 8172 | 12.66 | 11.73 | 10.96 | 9.60 | .06 |
| 8173 | 12.66 | 11.76 | 10.94 | 9.63 | .07 |
| 8224 | 12.65 | 11.76 | 10.94 | 9.52 | .08 |
| 8529 | 12.49 | 11.57 | 10.69 | 9.33 | .03 |
| 8574 | 12.50 | 11.52 | 10.70 | 9.41 | .09 |
| 8576 | 12.52 | 11.54 | 10.69 | 9.55 | .09 |
| 8874 | 12.54 | 11.56 | 10.66 | 9.36 | .04 |
| 8876 | 12.58 | 11.54 | 10.68 | 9.37 | .05 |
| 8902 | 12.76 | 11.60 | 10.66 | 9.33 | .08 |
| 8906 | 12.63 | 11.60 | 10.74 | 9.48 | .06 |
| 8908 | 12.63 | 11.62 | 10.73 | 9.41 | .07 |
| 9258 | 12.88 | 11.90 | 11.12 | 9.51 | .15 |
| 9609 | 12.82 | 11.95 | 11.32 | 10.05 | .10 |
| 9615 | 12.95 | 11.95 | 11.26 | 9.97 | .13 |
| 9889 | 12.66 | 11.84 | 11.13 | 9.87 | .12 |
| 9966 | 12.78 | 11.88 | 11.17 | 9.89 | .01 |
| 10053 | 12.84 | 11.91 | 11.18 | 9.58 | .12 |
| 10214 | 12.86 | 11.88 | 11.23 | 10.20 | .13 |
| 10302 | 12.84 | 11.89 | 11.22 | 10.09 | .10 |
| 10410 | 12.88 | 11.92 | 11.28 | 9.98 | .12 |
| 10614 | 12.82 | 11.89 | 11.24 | 10.25 | .13 |
| 10655 | 12.79 | 11.87 | 11.26 | 10.16 | .09 |
| 10720 | 12.76 | 11.84 | 11.15 | 9.96 | .11 |
| 10741 | 12.88 | 11.81 | 11.15 | ||
| 10948 | 12.83 | 11.92 | 11.19 | 9.94 | .10 |
| 11115 | 12.81 | 11.93 | 11.34 | 10.25 | .10 |
| MJD | |||||
|---|---|---|---|---|---|
| 3719 | 11.90 | 11.15 | 10.76 | ||
| 5886 | 11.98 | 11.11 | 10.61 | ||
| 6049 | 11.87 | 10.99 | 10.42 | ||
| 6287 | 11.85 | 10.86 | 10.37 | 9.10 | .05 |
| 6663 | 11.90 | 11.06 | 10.51 | ||
| 6693 | 11.84 | 10.98 | 10.40 | 9.51 | .20 |
| 6984 | 11.94 | 11.03 | 10.43 | 9.50 | .08 |
| 7142 | 11.88 | 11.04 | 10.41 | 9.63 | .22 |
| 7437 | 12.01 | 11.10 | 10.59 | 9.66 | .12 |
| 7843 | 11.93 | 11.09 | 10.62 | 9.73 | .13 |
| 8132 | 12.00 | 11.08 | 10.53 | 9.62 | .04 |
| 8172 | 11.95 | 11.06 | 10.51 | 9.75 | .06 |
| 8529 | 11.88 | 11.01 | 10.43 | 9.47 | .07 |
| 8575 | 11.93 | 11.05 | 10.45 | 9.54 | .10 |
| 8874 | 11.88 | 10.99 | 10.48 | 9.46 | .04 |
| 9615 | 11.88 | 10.93 | 10.24 | 8.99 | .04 |
| 9889 | 11.89 | 10.97 | 10.46 | 9.47 | .09 |
| 9966 | 11.86 | 10.98 | 10.42 | 9.27 | .08 |
| 10058 | 11.70 | 10.85 | 10.26 | 9.07 | .07 |
| 10302 | 11.77 | 10.79 | 10.09 | 8.94 | .05 |
| 10413 | 11.82 | 10.86 | 10.14 | 8.94 | .05 |
| 10614 | 11.72 | 10.76 | 10.09 | 8.93 | .05 |
| 10655 | 11.72 | 10.81 | 10.10 | 8.88 | .05 |
| 10720 | 11.70 | 10.76 | 10.03 | 8.95 | .07 |
| 10738 | 11.72 | 10.78 | 10.04 | 8.79 | .10 |
| 11114 | 11.61 | 10.65 | 9.89 | 8.80 | .05 |