Spectral dating of high-redshift stellar populations
Abstract
Age derivation techniques for unresolved stellar populations at high redshifts are explored using the NUV spectrum of LBDS 53W091 () and LBDS 53W069 (). The photometry and morphology of these galaxies – which are weak radio sources – suggest they are early-type systems, a feature that makes them ideal test beds for the analysis of their ages and metallicities with the use of population synthesis models. In the analysis that is based on simple stellar population models, we find a significant degeneracy between the derived ages and metallicities both in optical+NIR photometric and NUV spectroscopic analyses. This degeneracy is not so strong for LBDS 53W069. However even in this case the stellar age cannot be constrained better than to a range roughly encompassing one third of the age of the Universe at (90% confidence level). We have explored several independent population synthesis models and consistently found similar results. Broadband photometry straddling the rest-frame 4000Å break is also subject to a strong age-metallicity degeneracy. The use of realistic chemical enrichment assumptions significantly helps in disentangling the degeneracy. Based on this method, we derive the average stellar age for both galaxies around Gyr with better constraints on the youngest possible ages ( Gyr at the 90% confidence level). The comparison with simple stellar population models suggest sub-solar metallicities (). A composite model using chemical enrichment gives slightly higher metallicities in both galaxies (). Given that the stellar component in galaxies forms over times which are larger than a typical chemical enrichment timescale, we conclude that composite stellar populations must be used in all photo-spectroscopic analyses of galaxies. From the observational point of view, the most efficient (and feasible) way to set limits on unresolved stellar populations comprises a combination of Balmer absorption lines along with either low SNR rest frame NUV spectroscopy or accurate optical and NIR photometry.
keywords:
galaxies: elliptical and lenticular, cD – galaxies: evolution – galaxies: formation – galaxies: individual (53W091, 53W069) – galaxies: stellar content1 Introduction
Estimating the age of the unresolved stellar populations observed in galaxies represents a major challenge in our understanding of galaxy formation. An ideal observation should allow us to infer the star formation history of galaxies from a set of various spectrophotometric observables. The light from a recent burst is dominated by the colour of OB stars, whereas the light from old stellar populations come predominantly from G- and K-type giants. Hence, as a zeroth order approximation, broadband colours track the stellar age. However, this stellar clock is not good enough because of the effect of metallicity on age estimates so that – within the observational uncertainties – the colours of galaxies, whose light is dominated by old and metal-poor stars, may be indistinguishable from galaxies mainly composed of young and metal-rich stars. Furthermore, this degeneracy cannot be simply overcome by a better spectral resolution as targeted spectral indices such as the Lick/IDS system (Worthey et al. 1994) suffer from an age-metallicity degeneracy similar to broadband photometry (Worthey 1994).
Accurate spectroscopic dating of stellar populations has been attempted over the past years (Stockton, Kellogg & Ridgway 1995; Dunlop et al. 1996; Spinrad et al. 1997; Yi et al. 2000) although a comprehensive analysis of the effect of metallicity has not been considered in detail until recently (Nolan et al. 2003; Ferreras, in preparation).
This paper focuses on LBDS 53W069 () and LBDS 53W091 (), two faint radio galaxies from the Leiden-Berkeley Deep Survey (hereafter LBDS; Windhorst et al. 1984a; 1984b). The search for optical counterparts to faint radio emission is a technique which should allow us to spot old stellar populations at high redshifts (Kron, Koo & Windhorst 1985). However, the light from many of these objects is dominated not by starlight but by the active nucleus. An attempt was made to target old stellar populations by searching in the LBDS catalog for weak radio sources with faint NIR magnitudes () and red opticalIR colors (). Among the reddest galaxies, LBDS 53W069 (; ) and LBDS 53W091 (; ) have been extensively studied (Dunlop et al. 1996; Spinrad et al. 1997; Dunlop 1999). Spinrad et al. (1997) presented the spectrum of 53W091 using Keck LRIS, which maps into its rest-frame NUV (Å ). Based on a comparison with their simple stellar populations (SSPs), they found a minimum age of Gyr, which imposed a significant constraint on cosmology. However, due to the substantial difference between SSP models (e.g., Yi et al. 2003) and the systematic effects in age derivation techniques, the subsequent analyses of Bruzual & Magris (1997), Heap et al. (1998) and of Yi et al. (2000) indicated significantly younger ages ( Gyr). The controversy has continued. Nolan et al. (2003) have recently performed a more detailed analysis exploring composite stellar populations (i.e. a mixture of metallicities) and found Gyr roughly confirming their first age estimate. The discrepancy between these two age estimates can be translated into a formation redshift. By adopting a CDM cosmology with and km s-1 Mpc-1 (Spergel et al. 2003), which is used in this paper hereafter, the literature suggests that the stellar component of LBDS 53W091 could have been formed at a redshift between (Yi et al. 2000) and (Nolan et al. 2003).
The controversy over the actual age of an allegedly simple case such as LBDS 53W091 shows that it is imperative to make a robust estimate of the underlying uncertainties. We will explore in this paper the uncertainties inherent to any age estimate using simple fitting techniques to the observed NUV spectra of LBDS 53W069 and 53W091. Given the importance of these estimates to cosmology as well as to galaxy formation, we believe the case study presented in this paper is a timely and relevant exercise which should be borne in mind when extracting ages from the integrated properties of stellar populations.
2 Stellar dating using SSPs
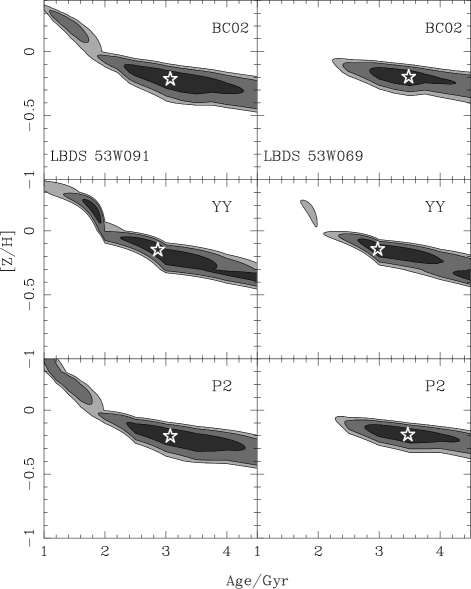
A first approach to this problem involves the assumption that all stars in a given galaxy have the same age and metallicity. These so-called simple stellar populations (SSPs) constitute the building blocks of population synthesis models, and they give good fits to globular cluster data (e.g., Bressan, Chiosi, & Fagotto 1994; Yi et al. 2001). Both galaxies targeted in this paper appear morphologically to be early-type galaxies with a de Vaucouleurs profile in rest-frame and bands (Waddington et al. 2002). Their optical colours hint at the presence of moderately old stars (Spinrad et al. 1997). We have performed a first test comparing the observed NUV spectrum with a grid of SSPs over a large range of ages ( t/Gyr ) and metallicities ( ). The age of the Universe at the redshift of these galaxies () is 4.35 Gyr with the cosmology adopted in this paper. Figure 1 shows the likelihood contours when performing a test, taking into account the observed flux and signal to noise ratio in the rest-frame range Å . The three shaded areas represent (from dark to light grey) the , and confidence levels. When computing the measurements, we normalised both the observed and model spectra by their integrated flux in the wavelength range specified above. Each panel corresponds to a comparison with different population synthesis models. From top to bottom: BC02 for the latest “pre-STELIB” Bruzual & Charlot (1993) models; YY for Yi and Yoon (in preparation) which is an updated version of the Yi, Demarque, & Oemler (1997) models, and P2 for Pégase 2 (Fioc & Rocca-Volmerange 1997). The stars give the position of the best fit for LBDS 53W091 (left) and 53W069 (right), also shown in Table 1, along with the best value of the reduced . The table gives the marginalized error bars for the age and metallicity estimates at the 90% confidence level. The final number of spectral data points in the analysis is (25Å resolution) in both galaxies. Figures 2 and 3 show the observed SEDs of LBDS 53W091 (Spinrad et al. 1997) and LBDS 53W069 (Dey et al. in preparation), respectively. Three characteristic () error bars are shown for reference. The inset gives the histogram of signal-to-noise ratios, with the median shown by an arrow.The dashed line is the synthetic SED from the SSP which corresponds to the best fit from the YY models. The bottom panel shows the residuals of the fit as a fraction of the noise level.

One can see that all models give similar results for both galaxies NUV spectral fittings. The figure shows that the confidence levels are too wide to pin down accurate age estimates; and, thus, the wide range of “best” ages and metallicities shown in Table 1 is to be expected. Hence, the most important conclusion one can extract from Figure 1 is that the NUV spectrum used for the test cannot give an accurate age estimate in a simple comparison with SSPs because of the age-metallicity degeneracy. This degeneracy is smaller for LBDS 53W069, giving a reasonable constraint on the stellar ages. However, notice that at the 90% confidence level, one cannot rule out ages which span roughly one third of the age of the Universe at the observed redshift.
| Galaxy | Model | Age/Gyr | ||
|---|---|---|---|---|
| LBDS 53W091 | BC02 | |||
| YYa | ||||
| P2 | ||||
| CSPb | ||||
| LBDS 53W069 | BC02 | |||
| YY | ||||
| P2 | ||||
| CSPb |
a Yi et al. (2000) found roughly 2 Gyr as the best fitting age assuming
the solar abundance. Here, we used the same models; but we get a larger
age because lower metallicities are allowed.
b Composite models assuming a consistent chemical enrichment history.
Mass-weighted ages and metallicities are shown. See §4 for details.
Figure 4 further illustrates this point. The inset shows a likelihood contour similar to those in Figure 1 for the YY models. Three (age, metallicity) pairs are chosen: #2 corresponds to the best fit, #1 and #3 are estimates along the “likelihood ridge”. The SEDs corresponding to the SSPs for these three points are shown in the figure as thin solid, dotted and dashed lines corresponding to points , and , respectively. The observed SED of LBDS 53W091 is shown as a thick line with three representative error bars. One can see the SEDs corresponding to all three points are nearly indistinguishable even though they span a large range of both age and metallicity.
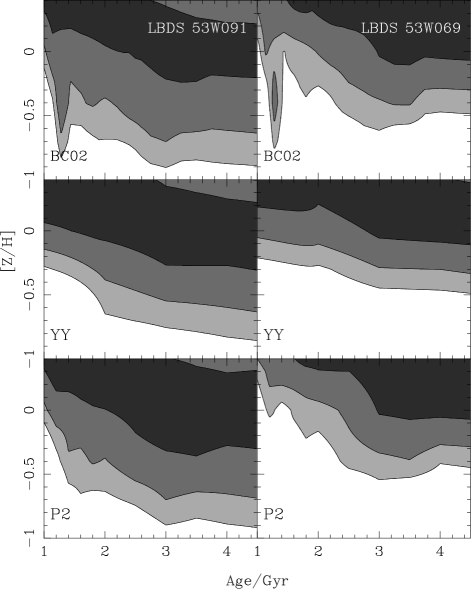
We have also explored the constraints one could set on a comparison with SSPs using the broadband photometric data from Waddington et al. (2000). Figure 5 shows likelihood contours in age and metallicity when performing a test with the , , and colours. We excluded the Gunn- data from the analysis because of its large error bars. Through this exercise, we also demonstrate the difference between the analysis on the low-SNR SED and the one on the broadband photometry with higher SNR. The shades (from dark to light grey) correspond to the , , and confidence levels for galaxies LBDS 53W091 (left) and 53W069 (right), respectively. One can see that the age-metallicity degeneracy is stronger than in the case of a comparison with the NUV SED.

Dust was not explored in this comparison. In this sense, these age estimates could be considered as upper limits, since the reddening from dust will make a stellar population appear older when analyzed by a dustless model. Yi et al. (2000) estimated that a modest amount of reddening – E()=0.04 mag – can reduce the age by about Gyr, reconciling their spectroscopic and photometric dating of LBDS 53W091. Furthermore, a small error in the flux calibration of the SED will change the overall shape of the spectrum, with a significant change in the age and metallicity obtained in this way. We want to emphasize here that an accurate spectral dating requires a very precise flux calibration. We conclude in this section that a comparison of the available data from LBDS 53W069 or 53W091 and SSPs over a wide range of ages and metallicities cannot give us an accurate value of the age unless an independent estimate of the metallicity is obtained. In the next section we explore on possible ways to improve the age dating of unresolved stellar populations at high redshift.

3 How to improve the age estimate
I. Rest-frame NUV spectroscopy at higher SNR
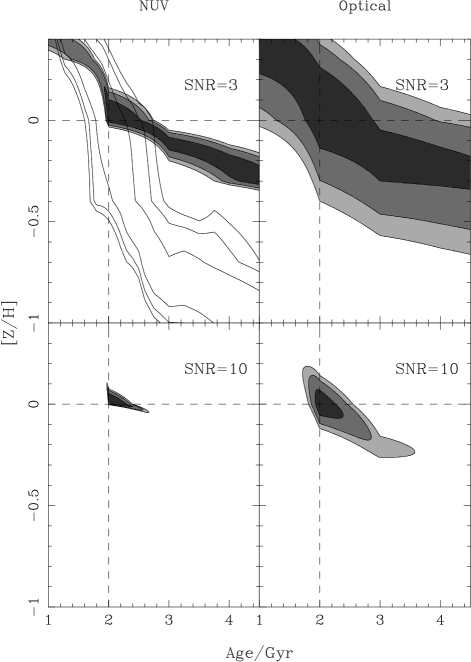
Obtaining spectra of high-redshift galaxies requires very long integration times on large telescopes. For instance, the rest-frame NUV SED of LBDS 53W091 shown in Figure 2 required an effective exposure time of s using LRIS at the 10 m W. M. Keck telescope (Spinrad et al. 1997). The spectrum has a median SNR per resolution element (25Å). We decided to explore the effect of a higher signal to noise ratio on the estimates of the age and metallicity. In the left panels of Figure 6 we generated a synthetic galaxy spectrum with the same spectral coverage and resolution as that of LBDS 53W091, at SNR (upper) and SNR (lower). The likelihood map was obtained for a set of 200 realizations of the spectrum corresponding to a SSP from the YY models for a Gyr and (these fiducial values are shown in the figure as a dashed line). The shaded contours – from dark to light gray – correspond to the , and confidence levels. Obviously, a more time-demanding spectrum at a higher SNR will reduce the width of the “likelihood ridge” although it could not break the age-metallicity degeneracy unless very high SNRs () are achieved – which would imply prohibitively long exposure times even for a 10 m-class telescope. Hence, for all practical purposes, the accuracy of the age would still hinge on an independent estimate of the metallicity.
II. Spectroscopy across 4000Å break
The strong age sensitivity of the 4000Å break along with its weaker dependence with metallicity for young stellar populations (see e.g. Kauffmann et al. 2003) suggests that a spectral coverage encompassing this break could be a good age indicator. Therefore, we decided to test if optical SEDs covering the 4000Å break lead to more refined age estimates than NUV SEDs. The right panels of Figure 6 explore this possibility. We generated 200 synthetic spectra corresponding to a SSP with Gyr and from the YY models. These SEDs were computed for SNR (top) and SNR (bottom). The spectral resolution was assumed to be the same as that for the observed rest-frame NUV SED (i.e. Å ) and the spectral coverage was chosen to straddle the 4000Å break: Å in the observer’s frame, which corresponds to Å in the rest-frame. The figure shows that one does not achieve a better age constraint at all by using the optical SED straddling the 4000Å break, compared to using the rest-frame NUV SED. However, the SNR=10 optical SED yields age estimates with markedly better accuracy compared to the SNR=3 rest-frame NUV SED. For 1–5 Gyr populations, rest-frame optical SEDs should take shorter exposures by an order of magnitude to achieve the same SNR and but require higher values of SNR. It is encouraging to find that high SNR rest-frame optical SEDs can be effective tools for deriving ages even at low spectral resolution (25Å).
III. Broadband photometry across 4000Å break
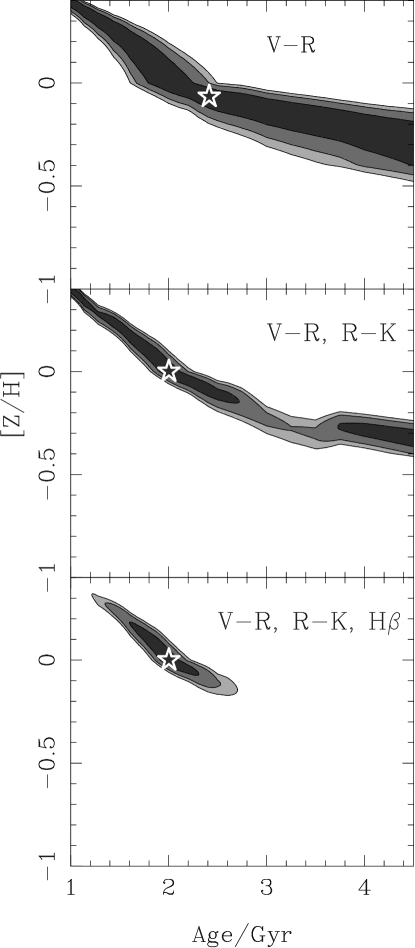
One alternative way of estimating the ages from the flux across the 4000Å break would be to perform broadband photometry. This is much less time-consuming than spectroscopy and it is questionable whether one can do better than shown in Figure 5 if a more accurate photometry is performed on these galaxies. Figure 7 shows the likelihood map using a synthetic SSP from the YY models for t Gyr and assuming a small photometric error in the colours (). We targeted and colours, which map into NUV and optical rest-frame colours, respectively. The shaded regions are – from dark to light grey – the , and confidence levels. The two upper panels show the analysis when photometry is used in the analysis: only colour (top), or when both colours ( and ) are considered (middle panel). This approach fares equally well compared to the more time-consuming continuum fitting at low SNRs. The age-metallicity degeneracy still persists.
IV. Narrow spectral indices
After exploring the various approaches discussed above, we are left with the option of targeting narrow spectral features. This is a technique often used in age estimates of early-type galaxies (e.g. Trager et al. 2000; Kuntschner 2000; Bernardi 2003). The key issue is to target line indices which have a significantly different dependence on age and metallicity. As a simple test, we have checked the likelihood maps one would get from a measurement of a Balmer index such as H. Balmer indices are very prominent in stellar atmospheres at K, which corresponds to main sequence A-type stars. Hence, Balmer absorption is especially strong in stellar populations over an age range Gyr, which is ideal for galaxies. Old, metal-poor stars can also contribute significantly to Balmer absorption lines (Lee, Yoon, & Lee 2000). However, high-redshift galaxies are immune to the complication because they are still too young to have developed such stars. The lines in the top-left panel of Figure 6 represent the , and confidence levels of a simulated measurement of Balmer absorption corresponding to HÅ in the rest frame. This is the value to be expected for the fiducial model targeted in the analysis throughout §3 (i.e. an age of 2 Gyr and solar metallicity). One can see that adding Balmer absorption to the analysis helps in constraining the ages. The contour levels in the bottom panel of Figure 7 show similar confidence levels for a combined measurement of broadband photometry (using colours and ) along with the same value of H as above. We assume a higher photometric accuracy mag than currently available, i.e. mag (Waddington et al. 2000). Notice that the use of accurate photometry imposes similar constraints on the age and metallicity as in the combined analysis of the NUV SED at low signal-to-noise ratios shown in the Figure 6 top-left panel. Hence, a combination of broadband photometry with moderate resolution spectroscopy targeting age-sensitive indices such as H is the best observational approach to an accurate estimate of the age of LBDS 53W091.
We have chosen H to illustrate the usefulness of Balmer line measurements, but higher order Balmer line indices may be preferred especially depending on the redshift of the target galaxy. The recent study of van Dokkum and Ellis (2003) presents a clear example of such successes.
4 The effect of chemical enrichment
So far, we have based our analysis of stellar ages and metallicities on simple stellar populations. Age estimates based on SSPs rely on the assumption that the stars have the same age and metallicity. Globular clusters are the best candidates for a realistic SSP, as inferred by numerous colour-magnitude diagram analyses. Various spectrophotometric properties of early-type galaxies hint at a very fast star formation process implying a rather small age range (e.g. Bower, Lucey & Ellis 1992; Kuntschner 2000). However, the radial colour gradients found in elliptical galaxies (e.g. Peletier et al. 1990) implies that the stellar component is distributed over a significant range of metallicities. Furthermore, low-mass ellipticals both nearby and at moderate redshifts display rest-frame NUV colours (Ferreras & Silk 2000a), Balmer absorption, and [Mg/Fe] abundance ratios (Trager et al. 2000), all of which are indicative of a more extended star formation history (Ferreras & Silk 2003). Hence, comparing early-type galaxies with SSPs may not be such a good approximation.
Furthermore, the morphological analysis of LBDS 53W091 performed on HST images using WFPC2 and NICMOS in the F814W, F110W and F160W passbands is suggestive of a two component system, comprising a compact de Vaucouleurs spheroid ( kpc) plus an extended exponential disk ( kpc), which only appears in the bluer passband (Waddington et al. 2002). This is suggestive of the presence of young stellar populations. The contamination in the rest-frame NUV from young stars is estimated to be up to 20% (Waddington et al. 2002).
Therefore, we perform a similar analysis as the one described in §2 using a chemical enrichment model which results in a (consistent) distribution of ages and metallicities. Let us briefly describe the parameters which determine the star formation history:
-
The star formation rate () is determined by a power law, with a star formation efficiency () which is fixed in this analysis. For simplicity, we decided to use a linear star formation law, namely: , where is the gas mass.
-
Infall of pre-enriched gas is assumed, at a metallicity . The infall rate follows a generic “delayed exponential” profile: , where , with being a “formation redshift”, and is the infall timescale.
-
Gas outflows are parametrized by , which defines the fraction of the gas returned from stars which is ejected from the galaxy.
The model tracks the stellar, gas and metal components in a single zone. The rest of the details follow standard assumptions about stellar evolution and chemical enrichment. We assume a Salpeter (1955) initial mass function in the mass range. The chemical enrichment model is described in detail elsewhere (see e.g. Ferreras & Silk 2000b). With this generic parametrization we ran for each galaxy a set of star formation histories encompassing a wide range of outflow fractions (); formation times (), and infall timescales (). The upper limit chosen for is motivated by the fact that longer infall timescales will result in a significant fraction of ongoing star formation at the observed redshift. Hence, models with Gyr have a strong NUV component from very young stars which is incompatible with the observed SEDs of our galaxies. The star formation efficiency was fixed at a high value ( Gyr-1) after checking that low star formation efficiencies were consistently giving higher values for . This value of the efficiency is consistent with similar models of star formation in elliptical galaxies (Ferreras & Silk 2000b).
Yi et al. (2000) and Nolan et al. (2003) already considered a simple analysis of stellar populations with mixed metallicities, although their models did not assume a consistent age-metallicity relation obtained by a proper treatment of chemical enrichment. Yi et al. (2000) adopted metallicity distributions from instant starburst models (and thus no age spread). Nolan et al. (2003) on the other hand randomly combined populations from seven metallicity bins from to . In our models, we consistently evolve the metallicity according to the prescriptions described above. It is important to note that our star formation history (age-metallicity relations) is consistent with the colour-magnitude relations (CMR) of early-type galaxies at the present epoch (Bower et al. 1992). In other words, our models are not randomly selected but instead calibrated to the local CMR information.

We have performed a test on these composite models compared to the observed (SNR) NUV SEDs of the two galaxies. Figure 8 shows the marginalized likelihood contours as a function of the average (mass-weighted) age and metallicity. The solid lines give the , and (thick) confidence levels. The best fits, uncertainties and reduced chi-squares for these composite models are also given in table 1 under CSP. One can see that the use of a chemically consistent model helps in constraining the mean metallicity effectively so that the age estimates can be better determined. The confidence level limits the average age between and Gyr, with an average (mass-weighted) metallicity around solar, with an uncertainty around dex. Our result is in agreement with the randomly mixed metallicity model used in Nolan et al. (2003), whose models give a stellar age around Gyr.
It is important to note that we achieve larger age estimates from the NUV spectral fitting analysis when we use models than when we use . The star and square in figure 8 give the position of the best fit for the analysis using composite and simple stellar populations, respectively. The SSP analysis lies at the limit of a more consistent approach using a mixture of ages and metallicities. Notice that the best fit for a composite model corresponds to an average age around 3.6 Gyr with 0.8Z⊙ (table 1), whereas the SSP-based analysis shown in figure 1 would require Gyr if the assume the same metallicity. This result is a consequence of the mixture of stellar populations with difference ages and metallicities, and illustrates the fact that composite stellar population should be used for these analyses. Furthermore, the best chemical enrichment model gives an average age and metallicity which would be readily ruled out in a naive approach using SSPs (see figure 1).
One effective way to achieve a more accurate age estimate lies again in the use of age-sensitive observables such as Balmer absorption. The dashed lines in Figure 8 give contours of the hypothetical H index measurements from Å – in the upper right corner – to Å (thick) in steps of Å . The chemical enrichment model predictions correspond to values of H between and Å . Hence, Balmer absorption can significantly reduce the uncertainties in the age estimate and check the validity of the chemical enrichment models. Furthermore, we must emphasize here that all age estimates based on spectral fittings over a wide range of wavelengths are heavily dependent on a precise calibration of the SED. The overall shape of the SED plays a crucial role in all model predictions presented in this paper. Therefore, it is very important to understand the uncertainties in the flux calibration of the spectra to avoid large systematic errors in the analysis. Hence, the analysis of Balmer absorption should be considered as a valuable cross-check in order to give an accurate answer for the stellar ages.
5 Conclusions
The observed rest-frame NUV SEDs of high redshift weak radio galaxies have been claimed to be robust estimators for the ages of old stellar populations at high redshifts, which in turn allow us to set constraints on the age of the Universe and on cosmological parameters (Spinrad et al. 1997). However, in this paper we show that the combined effect of age and metallicity results in large error bars which are shown to be independent of the population synthesis model used. This problem persists even if we use the spectral energy distribution over a wide range of wavelengths instead of a set of broadband filters. Only at SNR=10 or greater can the data disentangle the degeneracy. Unfortunately, this corresponds to prohibitively long exposure times on a 10 m-class telescope.
A comparison of synthetic SEDs built from SSPs, with noise mimicking that of the observed data, shows that signal to noise ratios close to those used in the analysis of LBDS 53W091 (i.e. SNR 3) are not high enough to yield age estimates with appreciable precision. Slightly higher SNR will help in reducing the error bar, but the age-metallicity degeneracy is still very strong unless one can achieve a SNR=10 in rest frame NUV spectroscopy or even higher in the optical spectral window. In principle, it may appear that the rest-frame NUV would be a desirable window to explore for these galaxies since it could pose stronger constraints on the allowed region of parameter space compared to a rest-frame optical SED. However, the weaker stellar continuum and the strong effect of dust in this spectral region along with our poorer knowledge of stellar emission in the NUV imply that it may be more feasible and useful to obtain high precision rest-frame optical photometry straddling the 4000Å break. Old stellar populations are much brighter redward of the break, which results in higher SNRs.
Dating unresolved stellar populations from their spectral energy distribution over a wide range of wavelengths is strongly dependent on the overall shape of the continuum. A small error in the flux calibration will distort this shape, thus altering the estimated ages and metallicities. Hence, we want to emphasize that this type of studies requires SEDs with a very accurate flux calibration. As has been widely known for a decade, the use of Balmer absorption lines, in combination with broadband photometry, largely solves the problem, and helps us in understanding a possible systematic effect derived from uncertainties in the flux calibration of the SED. As we discussed in §3, different concerns would lead observers to choose different Balmer indices. At indices such as H, H and H all appear in the NIR spectral window, complicating an accurate ground-based spectroscopic measurement.
Hoping to break the infamous age-metallicity degeneracy from a theoretical point of view, we have explored a large set of chemically consistent population models. Simply because no arbitrary metallicity is allowed in such a scheme, this approach helped us determine metallicities much better. We found a better constraint on the age estimates, giving a range of ages between and Gyr at the confidence level for both galaxies, with a metallicity around solar with a dex uncertainty. LBDS 53W069 seems to accept models with higher average metallicities. Our results – involving different sets of population synthesis models and a detailed chemical enrichment scenario – give similar results as the analysis of Nolan et al. (2003). Even though any model of chemical enrichment introduces further uncertainties in the modelling, galaxies should be considered composite models as the star formation takes place over times which are always longer than the characteristic chemical enrichment timescales. It is worth noticing that the best fits for a simple and a composite stellar population are marginally compatible (see figure 8). Hence, at the expense of adding further uncertainties to the modelling, we believe a proper mixture of stellar ages and metallicities should be considered in all photo-spectroscopic analyses of galaxies.
Acknowledgments
We would like to thank James Dunlop and Louisa Nolan for very useful comments and for sending us the SEDs of the galaxies explored in this paper. We also thank Steve Rawlings, Pieter van Dokkum, Eric Gawiser and Hugues Mathis for useful discussions. This research has been supported by PPARC Theoretical Cosmology Rolling Grant PPA/G/O/2001/00016.
References
- (1) Bernardi, M. et al., 2003, AJ, 125, 1882
- (2) Bower, R. G., Lucey, J. R., Ellis, R. S., 1992, MNRAS, 254, 589
- (3) Bressan, A., Chiosi, C., Fagotto, F., 1994, ApJS, 94, 63
- (4) Bruzual, A. G., Charlot, S., 1993, ApJ, 405, 538
- (5) Bruzual, A. G., Magris, G. C., 1997, in Waller W. H., ed, The Ultraviolet Universe at Low and High Redshift, AIP Conf. Proc. 408, 291
- (6) Dunlop, J., Peacock, J., Spinrad, H., Dey, A., Jimenez, R., Stern, D., Windhorst, R., 1996, Nature, 381, 581
- (7) Dunlop, J., 1999, in Bunker A. J., van Breugel, W. J. M., eds, The Hy-Redshift Universe: Galaxy Formation and Evolution at High Redshift. ASP Conf. Proc., 193, 133
- (8) Ferreras, I., Silk, J., 2000a, ApJ, 541, L37
- (9) Ferreras, I., Silk, J., 2000b, MNRAS, 316, 786
- (10) Ferreras, I., Silk, J., 2003, MNRAS, 344, 455
- (11) Fioc, M., Rocca-Volmerange, B., 1997, A&A, 326, 950
- (12) Heap, S. R., et al., 1998, ApJ, 492, L131
- (13) Kauffmann, G., et al. 2003, MNRAS, 341, 33
- (14) Kron, R. G., Koo, D. C. & Windhorst, R. A., 1985, A&A, 146, 38
- (15) Kuntschner, H., 2000, MNRAS, 315, 184
- (16) Lee H.-c., Yoon S.-J., & Lee Y.-W. 2000, AJ, 120, 998
- (17) Nolan, L. A., Dunlop, J. S., Jimenez, R. & Heavens, A. F., 2003, MNRAS, 341, 464
- (18) Peletier, R. F., Davies, R. L., Illingworth, G. D., Davis, L. E., Cawson, M., 1990, AJ, 100, 1091
- (19) Salpeter, E. E., 1955, ApJ, 121, 161
- (20) Spinrad, H., Dey, A., Stern, D., Dunlop, J., Peacock, J., Jimenez, R. & Windhorst, R., 1997, ApJ, 484, 581
- (21) Spergel, D., et al. 2003, astro-ph/0302209
- (22) Stockton, A., Kellogg, M. & Ridgway, S. E., 1995, ApJ, 443, L69
- (23) Trager, S. C., Faber, S. M., Worthey, G. & González, J. J., 2000, AJ, 119, 1645
- (24) Waddington, I., Windhorst, R. A., Dunlop, J. S., Koo, D. C. & Peacock, J. A., 2000, MNRAS, 317, 801
- (25) van Dokkum, P. G. & Ellis, R. S., 2003, ApJ, 592, L53
- (26) Waddington, I. et al., 2002, MNRAS, 336, 1342
- (27) Windhorst, R. A., Kron, R. G. & Koo, D. C., 1984a, A&AS, 58, 38
- (28) Windhorst, R. A., van Heerde, G. M. & Katgert, P., 1984b, A&A, 58, 1
- (29) Worthey, G., Faber, S. M., González, J. J. & Burstein, D., 1994, ApJS, 94, 687
- (30) Worthey, G., 1994, ApJS, 95, 107
- (31) Yi, S., Brown, T. M., Heap, S., Hubeny, I., Landsman, W., Lanz, T. & Sweigart, A., 2000, ApJ, 533, 670
- (32) Yi, S. K., Demarque, P., & Oemler, A., 1998, ApJ, 486, 201
- (33) Yi, S. K., Demarque, P., Kim, Y. C., Lee, Y. W., Ree, C., Lejeune, Th., & Oemler, A., 2001, ApJS, 136, 417