On the Evolutionary State of the Components of the YLW 15 Binary System
Abstract
We report centimeter continuum observations with the VLA and the VLBA as well as mid-infrared observations with COMICS/SUBARU toward the components of the YLW 15 very young binary system, VLA 1 and VLA 2. The centimeter emission of the two components traces partially thick free-free emission, likely due to collimated, ionized winds. VLA 1 is an embedded protostar, undetected in the near-IR, and possibly in the Class 0 to Class I transition and powering a Herbig-Haro outflow. Its mid-IR emission appears slightly resolved with a diameter of AU, possibly tracing circumstellar material from both the envelope and the disk. VLA 2 is a typical Class I object, unresolved in the mid-IR, and is the responsible of the strong X-ray emission associated with YLW 15. The expected centimeter ”peri-stellar” emission associated with the X-ray emission is not detected with the VLBA at 6 cm likely due to the high optical depth of the free-free emission. Strikingly, the near to mid-IR properties of YLW 15 suggest that VLA 1 is a more embedded YSO, or alternatively, less luminous than VLA 2, whereas orbital proper motions of this binary system indicate that VLA 1 is more massive than VLA 2. This result is apparently against the expected evolutionary scenario, where one expects that the more massive YSO in a binary system is the more evolved and luminous YSO. Finally, the nearby source YLW 16A is detected with the VLA, its position coincides with reported near-IR and X-ray sources.
1 Introduction
The Ophiuchi molecular cloud complex is one of the nearest star formation regions ( 120 pc: Knude & Hog 1998) and is also one of the best studied low mass star forming regions. YLW 15 (IRS 43) is a young stellar object (YSO) embedded in the Oph-F dense core, located in the southeastern region of the molecular cloud complex (e. g., Motte, André & Neri 1998). The near-IR to mid-IR (e. g., Wilking, Lada, & Young 1989), far-IR (e. g., Bontemps et al. 2001; Pezzuto et al. 2002; Nisini, Gianni & Lorenzetti 2002) and millimeter (e. g., André & Montmerle 1994; Bontemps et al. 1996) properties suggest that YLW 15 belongs to the Class I stage of evolution. The spectroscopic features in the near-IR show that YLW 15 is a YSO with K5 spectral type and with dwarf like surface gravity, i. e., a luminosity class IV/V, having a stellar mass of 0.5 (Greene & Lada 2002). It has been proposed that YLW 15 constitutes a wide-binary system with GY 263, located 6′′ (720 AU) northwest of YLW 15 (e. g., Allen et al. 2002). YLW 15 powers a compact molecular outflow (Bontemps et al. 1996) and a Herbig-Haro outflow (e. g., Grosso et al. 2001).
YLW 15 is one of the youngest low mass stars associated with X-ray emission. First detected by ROSAT (Casanova et al. 1995), the X-ray emission shows quasi-periodic flares (Tsuboi et al. 2000). A “super-flare” was observed during a few hours (Grosso et al. 1997). Grosso et al. (1997) suggested that the flare arises from a magnetically confined, low-density plasma bubble with a diameter of –0.3 AU around the young star. The quasi-periodic X-ray flares of YLW 15 were explained by Montmerle et al. (2000) as due to “fast rotation of the central star with respect to the accretion disk, which results in star-disk shearing of the magnetic lines, producing magnetic reconnection and mass loss, and eventually extremely high X-ray luminosities”, which is different from the “classical” quasi steady-state situation expected for the T Tauri stars.
Its radio continuum emission has been well studied at a moderate angular resolution () showing no variability (e. g., Leous et al. 1991). VLBI milliarcsecond angular resolution observations of YLW 15 show that the emission is resolved out at “peristellar” scales (i. e., its size is larger than cm), suggesting that the emission is thermal in origin and probably comes from circumstellar ionized winds (André et al. 1992). Sub-arcsecond angular resolution VLA observations revealed that the radio emission arises from a binary system, YLW 15 VLA 1 and YLW 15 VLA 2 (Girart, Rodríguez & Curiel 2000, Paper I). In these maps VLA 1 was clearly elongated with a position angle of PA. This elongation aligns well with HH 224NW1 and a chain of near-IR HH knots (Grosso et al. 2001). VLA 2 appeared unresolved down to scales of . In Paper I we suggested that the two radio sources trace a binary young stellar system with each component possibly having a different evolutionary status. Using a 12 year time baseline of subarcsecond angular resolution VLA observations, Curiel et al. (2003, Paper II) have measured absolute proper motions of 24 mas yr-1 in YLW 15. In addition, the VLA 1 and VLA 2 relative astrometry analysis done in Paper II reveals orbital proper motions that suggest a total mass of the binary system of 1.7 . These results show also that VLA 1 is likely more massive than VLA 2.
In this paper we present VLA sub-arcsecond angular resolution observations at 3.6 and 6 cm toward YLW 15, as well as VLBA 6 cm and COMICS/SUBARU 8.8 m observations. In § 2 and § 3 we give the details of the observations and results with the VLA, VLBA and SUBARU. In § 4 we discuss the nature of the radio emission and compare its properties with those obtained at other wavelengths in order to elucidate the nature of this interesting binary protostellar system.
2 Observations
2.1 VLA
The subarcsecond radio continuum observations were carried out with the Very Large Array (VLA) of the National Radio Astronomy Observatory111NRAO is a facility of the National Science Foundation operated under cooperative agreement by Associated Universities, Inc. between 2000 and 2002: 2000 December 27 (3.6 and 6 cm), 2002 February 10 (3.6 cm), 2002 March 5 (3.6 cm) and 2002 March 8 and 9 (6 cm). The absolute amplitude and phase calibrator were always 3C286 and 1626298, respectively. The phase center for all the observations was (J2000), (J2000). The data were edited and calibrated following the standard VLA procedures with the AIPS software package of NRAO. Maps were done using robust weighting of 0.0 and 0.5 for the 3.6 and 6 cm observations, respectively. The 3.6 cm flux measured for VLA 1 and VLA 2 were the same, within the uncertainties, in the 2002 February 10 and March 5 epochs. The same happened for the 6 cm fluxes in the 2002 March 8 and 9 epochs. Therefore, and given the proximity of the different observations in 2002, the February 10 and March 5 visibility data sets (3.6 cm) were combined in order to improve the sensitivity of the final maps. The same was done for the March 8 and 9 visibility data sets (6 cm). All the fluxes were corrected by the VLA antenna primary beam response. Table 1 shows the achieved synthesized beam and the rms noise achieved for the 2000 and 2002 epochs.
2.2 VLBA
The milliarcsecond radio continuum observations at 6 cm (4.96 GHz) were carried out using the 10 antennas of the Very Long Baseline Array (VLBA) of the National Radio Astronomy Observatory on two epochs, 2001 December 14 and 2002 March 22. The observations were done in the phase-referencing mode using one polarization. The phase center of the observations was (J2000), (J2000). Left-circular polarization was recorded using 2 bit sampling across bandwidths of 8 MHz at each frequency. The VLBA correlator produced 16 frequency channels across each 8 MHz bandwidth. Eight IFs were used, which give a total bandwidth of 64 MHz. Fringe fitting was performed observing the calibrator J16252527, located within a degree from YLW 15. The calibration and reduction of the data was performed following the standard VLBA procedures with AIPS (Ulvestad 1991). Maps were done using IMAGR with natural weighting in order to maximize the sensitivity. Table 2 shows the rms noise and the synthesized beam for each epoch.
2.3 COMICS/SUBARU
The mid-infrared imaging observations of YLW 15 at 8.8 m were carried out with the COMICS (COoled Mid-Infrared Camera and Spectrometer; Kataza et al. 2000) on the SUBARU Telescope on 2001 June 29 at a chopping frequency of 0.45 Hz. HD 14 5897 was also observed as a flux standard star. Total on-source integration time was 33.9 sec for the YLW 15 image. After standard reduction procedures, we employed the shift-and-add method to achieve the diffraction-limited image. The FWHM for the PSF star was . Aperture photometry was performed using the PHOT routine within IRAF. For the HD 14 5897 (the flux standard star) photometry an aperture of 6 pixels () was used. The flux adopted for HD 14 5897 at 8.8 m is 7.43 Jy. For the YLW 15 photometry, an aperture radius of 4 pixels () was used. In order to estimate the total flux of YLW 15 VLA 1 and VLA 2, we first did the aperture photometry for VLA 2, which has a peak intensity about 5 times stronger than VLA 1. The flux measured for VLA 2 is 1.49 Jy at 8.8 m. For VLA 1, we first suppressed the VLA 2 emission: this was done by rescaling and shifting the HD 14 5897 image to match it with the VLA 2 intensity and position. Second, the resulting image was subtracted from the YLW 15 image. The aperture photometry on VLA 1 was done on the YLW 15 image where VLA2 was suppressed. The flux measured for VLA 1 is 0.356 Jy.
3 Results
3.1 YLW 15
3.1.1 VLA
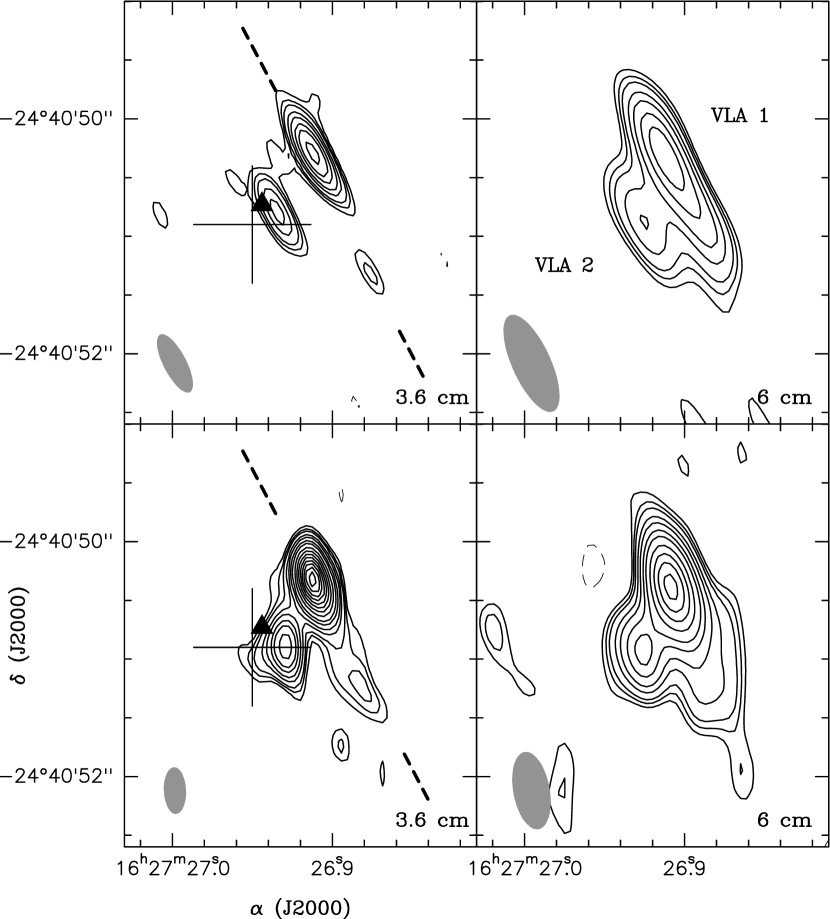
Figure 1 shows the 3.6 and 6 cm subarcsecond angular resolution maps of the two epochs, 2000 and 2002. Table 3 gives the positions, flux densities and the deconvolved sizes of VLA 1 and VLA 2.
VLA 1 appears elongated, in the two epochs and at the two wavelengths, in the SW-NE direction, with a position angle of , which is in agreement, within the uncertainties, with the previous measurements reported in Paper I. The 2002 epoch 3.6 cm map clearly shows weak emission (at 6 level) southwestern of VLA 1, i. e., in the same direction of the elongation of VLA 1, which forms an apparent one-sided lobe of VLA 1. The 2000 epoch 3.6 cm map detects this radio lobe only marginally (due to the lower sensitivity). The position angle of the VLA 1 one-sided lobe is , which is similar to the elongation of VLA 1. Remarkably, nearly aligned with the major axis of VLA 1 there are located to the south HH 224NW1 and to the north a chain of near-IR HH knots (Grosso et al. 2001). This coincidence lead Grosso et al. (2001) to suggest that VLA 1 is powering this HH outflow.
VLA 2 is also slightly extended, with a deconvolved size of , or 36 AU in projection. This result is consistent with the upper limit of obtained in Paper I. At 6 cm this source is not well separated from VLA 1, so the deconvolved size of VLA 2 may not be very accurate. Fig. 1 clearly shows that VLA 2 is associated with the near-IR source and the X-ray emission observed in this region (see § 3.1.4).
No radio emission down to 0.05 mJy (3- level) is detected toward GY 263, located 6′′ northwest of VLA 1 and VLA 2.
In order to derive the spectral index of VLA 1 and VLA 2, we first generate 3.6 cm maps using IMAGR and applying a Gaussian taper to the visibility data to obtain a synthesized beam similar to the 6 cm maps. Then, the 3.6 and 6 cm maps were convolved with a Gaussian, so the final resulting beam for the two wavelengths was the same. For the 2000 epoch, this beam was . For the 2002 epoch, this beam was . Table 4 gives the flux densities of the convolved maps and their spectral indices for the two epochs. The overall radio continuum emission of the YLW 15 region (obtained by measuring the flux within a box that included VLA 1, VLA 2 and the weak extended emission) has an spectral index of 0.50.1 and does not show signs of flux variability at roughly a 5% level. VLA 1 and VLA 2 have both positive spectral indices, 0.5 and 0.7, respectively. Because both sources have emission arising from a few tens of AU, their emission is likely optically partially thick free-free.
Figure 2 shows the slices of the VLA 1 emission and spectral indices along its major axis for the 2000 and 2002 epoch. Both epochs show that VLA 1 has a spectral index at the peak of . Interestingly, the southwestern weak lobe had in epoch 2000 a spectral index of , indicating non-thermal emission, while in the 2002 epoch its spectral index raised enough to be compatible with optically thin free-free emission ().
3.1.2 VLBA
No sources were detected from the two epochs of VLBA observations with an upper limit of about 0.3 mJy beam-1 (4- level). The parallax due to the Earth orbiting the Sun for Ophiuchi is about 8.3 mas. YLW 15 has moved 5.4 and -1.4 mas in right ascension and declination, respectively, between the two VLBA observations due to the parallax. Taking also into account the spatial displacement due to the absolute proper motions of VLA 2 measured in Paper II, the total displacement of VLA 2 is 3.0 and -9.4 mas in right ascension and declination, respectively. The visibility data of the first epoch was corrected for this shift. The maps of the combined visibility data were obtained using natural weighting, which yields an rms noise of 52 Jy. No emission was detected down to 0.21 mJy beam-1 (4- level). The same process was done taking into account the parallax and the VLA 1 absolute proper motion. No emission was detected either. This upper limit implies that at least an 84% and 64% of the radio emission of VLA 1 and VLA 2, respectively, arise from scales AU, which is in agreement with the VLA results that indicate that VLA 1 and VLA 2 are being partially resolved at scales of about 20 AU.
3.1.3 COMICS/SUBARU
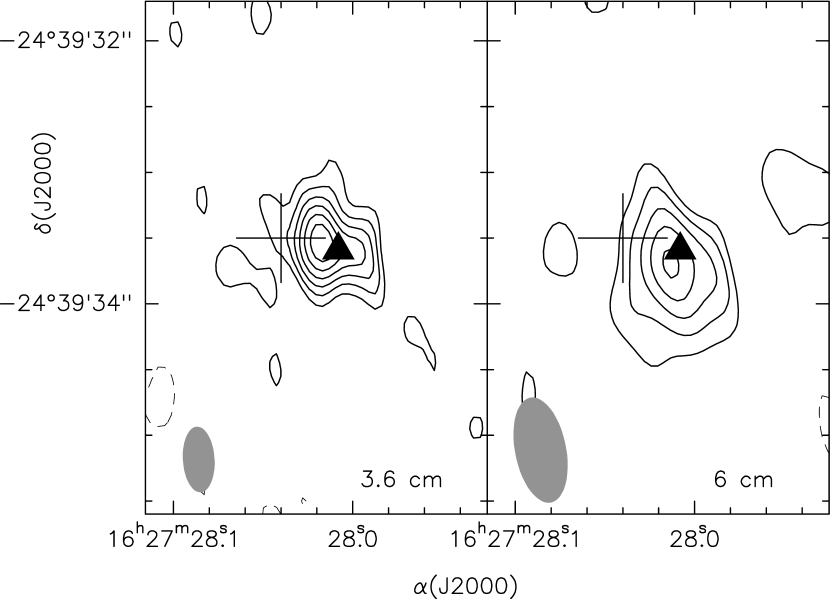
The left and right panels of Figure 3 show the image of YLW 15 and the standard HD 14 5897, respectively, at 8.8 m obtained with the COMICS camera of SUBARU. The two sources in YLW 15 are well separated in the image, with VLA 2 being significantly stronger than VLA 1. The separation between VLA 1 and VLA 2 is about with a PA of , which is in agreement with the values obtained from the VLA observations (see Table 3 from Paper II). There is extended emission observed up to a % level with respect to the peak value of the image around the two sources. It is clear from the HD 14 5897 image that there is also an extended ”halo” at a level of 14% level due to the PSF of the SUBARU telescope. Therefore the extended emission up to a % level in the YLW 15 image is possibly due to the SUBARU PSF. In order to confirm this possibility, we deconvolved the YLW 15 image using as a PSF model the HD 14 5897 image masked for levels below 2% (in order to avoid the noise to contribute into the deconvolution). Three different procedures were used for the deconvolution: the Lucy algorithm from the STSDAS package of IRAF, Maximum Entropy and CLEAN, these two from the MIRIAD package. The left panel of Figure 4 shows the resulting image of the Maximum Entropy deconvolution: the extended emission has disappeared down to a 2% level (a similar result is also obtained with the Lucy and CLEAN algorithms). Thus, it is clear that the extended halo around YLW 15 observed in the original image was due to the SUBARU PSF.
In order to check if VLA 1 and VLA 2 are resolved at 8.8 m we computed the radial profile of the annular averaged normalized flux of HD 14 5897, VLA 2 and VLA 1 (see the right panel of Figure 4). The half-width half-maximum (HWHM) of these profiles are , and for HD 14 5897, VLA 2 and VLA 1, respectively. HD 14 5897 should be unresolved (its size is mas: Cohen et al. 1999). The slightly higher width of HD 14 5897 with respect to VLA 2 could be due to a slightly higher seeing during the HD 14 5897 observations (taken 30 minutes after YLW 15). In any case, the profile of VLA 2 likely suggests that it is unresolved (). Assuming, that VLA 2 is unresolved, and that it traces the PSF, then the deconvolved HWHM of VLA 1 can be estimated from the observed HWHM of these two sources: . There are two sources of uncertainties in this estimation. First, the intrinsic uncertainty due to the angular resolution and the SNR of the source: (Condon 1997). Since the SNR for VLA 1 is and the angular resolution is , the uncertainty is . Second, the difference in the measured size of the reference star and VLA 2 can also be accounted as source of uncertainty: . The total uncertainty is . Thus, the FWHM size for VLA 1 of or AU. Finally, we note that despite the aforementioned deconvolution algorithms are not being very reliable to derive the YLW 15 sizes because of the small difference in size between VLA 2 and HD 14 5897, all of them produce an unresolved deconvolved object for VLA 2 (assuming that HD 14 5897 is a point source), whereas for VLA 1 they produce a resolved object with a FWHM size of –, in agreement with the previous radial profile analysis.
The slightly resolved VLA 1 mid-IR emission possibly traces matter in a non-disk 3-D distribution (i. e., from the envelope) which is falling onto (or perhaps is being flung off of) its circumstellar disk (e.g. Chick, Pollack, & Cassen 1996; Adams, Lada, & Shu 1987). Yet, for low inclination angles (nearly face-on) the circumstellar disk emission could also contribute to the mid-IR emission (Osorio et al. 2003; Osorio: Private communication). Indeed, CO outflow observations suggest that YLW 15 is nearly face-on (Bontemps et al. 1996). If this mid-IR emission comes partially from a circumstellar disk, then, it will trace only the inner-region of the disk which is warm enough to radiate in these wavelengths. Since the infalling envelope also contributes to the mid-IR emission, the size of the mid-IR emission does not correspond with the disk size directly. However, due to tidal truncation from the companion star (located at 72 AU in projection) its true size is probably not much larger (e. g., Rodríguez et al. 1998; Loinard et al. 2002). On the other hand, the mid-IR emission of VLA 2, unresolved, arises from a significantly smaller circumstellar structure.
3.1.4 Counterparts of the VLA sources
YLW 15 is detected in the 2MASS All Sky Survey in the J and K bands, and is cataloged as 2MASS 1627269-244050. The 2MASS (second incremental release) Point Source Catalog coordinates are given in Table 5. These near-IR data were obtained on 1998 July 9 (1998.52). In order to properly compare the positions of 2MASS 1627269-244050 with VLA 1 and VLA 2, we corrected the positions of these two radio sources to the values expected for the 1998.52 epoch taking into account the proper motions measured in Paper II. The difference between the positions of VLA 1 and VLA 2 for the 1998.52 epoch with respect to the 2MASS position are given in Table 5. From this table it is clear that the near-IR source is associated with VLA 2, as suggested by Greene & Lada (2002). Similarly, we compared the positions of the two VLA sources from the 2000 observations with the position of the X-ray source obtained with the CHANDRA satellite in 2000 (Imanishi, Koyama & Tsuboi 2001; Imanishi, private communication). Given the positions uncertainties, the X-ray emission is more likely associated with VLA 2.
High angular resolution, near-IR, observations with HST/NICMOS (Allen et al. 2002) and using lunar occultation techniques (Simon et al. 1995) show that YLW 15 has a companion 6′′ to the NW (720 AU): GY 263. Yet YLW 15 appears to be a single object at scales down to . Therefore, given the clear association of VLA 2 with the 2MASS 1627269-244050 source, VLA 2 is the only significant source of emission at near-IR wavelengths. Based on the near-IR spectroscopy, VLA 2 is a K5 IV/V YSO of 0.5 (Greene & Lada 2002). The mid-IR images at 8.8 m from COMICS with SUBARU (this paper) and at 10.8 m (Haisch et al. 2002) show two sources that correspond to VLA 1 and VLA 2. At these two wavelengths, VLA 2 is stronger than VLA 1, which suggests that VLA 1 is an embedded object or, alternatively, is less luminous (see § 4.3).
3.2 YLW 16A
3.2.1 VLA
This source is located 78′′ north of YLW 15, so it is far from the phase center of the VLA observations, but still within the primary beam of the 3.6 and 6 cm maps. This source was only detected in the 2002 epoch. Because this source is weak, in order to achieve a better SNR, the maps presented here were obtained using robust weighting of 0 and 1 at 3.6 and 6 cm, respectively. Figure 5 shows the 3.6 cm and 6 cm maps for YLW 16A. The 3.6 cm image shows that the emission is elongated to the west of the intensity peak. Because of the low SNR, it is not clear whether this elongation is due to a one side jet lobe (as it happens in YLW 15 VLA 1) or if it is due to a binary radio source separated by .
Because bandwidth smearing is important for YLW 16A at 3.6 cm ( in the north-south direction), only the integrated flux density was measured, using a box that included all the emission. Thus, the primary beam corrected flux density of YLW 16A is 0.430.04 and 0.270.05 mJy at 3.6 and 6 cm, respectively. These values imply an spectral index of the overall emission of 0.80.4, suggesting a thermal radio jet origin.
3.2.2 Counterparts of the VLA sources
Allen et al. (2002) detected with the HST/NICMOS3 camera two near-IR sources with their components separated by in the east-west direction. However, Allen et al. (2002) suggested that this apparent binary system is possibly tracing scattered light from the disk of a single YSO. In addition, lunar occultation observations by Simon et al. (1995) failed to detect a binary system. To compare the position of the near-IR and VLA emission, we used the position given by the 2MASS Point Source Catalog (source 2MASS 1627280-243933). Correcting the VLA position for proper motions (as we did in § 3.1.4), the difference between the VLA and near-IR emission, , , implies that both wavelength trace the same source. The CHANDRA X-ray source n. 57 (Imanishi, private communication) also coincides within its position uncertainty () with the VLA peak emission.
4 Discussion
4.1 The Radio Continuum properties
The jet-like morphology of VLA 1 (including its weak southwestern lobe) and its spectral index at centimeter wavelengths, , suggests that this source is a thermal radio jet (e. g., Anglada 1996; Rodríguez 1997). VLA 2 has a slightly higher spectral index, , and it is also partially resolved at similar scales as VLA 1. Yet, it does not have a clear elongation direction (see Table 3). Since VLA 1 and VLA 2 are very young stellar objects (see § 4.3) and that a significant fraction of their radio emission arises at scales of AU (§ 3.1.1), we can assume that their 3.6 and 6 cm emission arises from collimated, ionized winds. The radio emission of these winds was modeled by Reynolds (1986), which predicts that for a wind with constant velocity, temperature and ionization, a lower spectral index implies that the collimation of the jet increases with distance to the exciting star. Thus the radio continuum properties of the YLW 15 radio sources (VLA 1 has a lower spectral index and has a more clear jet-like morphology than VLA 2) are in agreement with the expected properties of collimated ionized winds. The higher 3.6 cm flux of VLA 1 with respect to VLA 2 implies that the momentum rate of the outflow material is higher in VLA 1 than in VLA 2. From the correlation between the molecular outflow momentum rate and the flux of the free-free emission estimated by Anglada et al. (1998), the momentum rate expected for the molecular outflow powered by VLA 1 and VLA 2 should be 510-5 and 210-5 yr-1 km s-1, respectively. On the other hand, the lack of emission for GY 263 gives an upper limit for the momentum rate of 110-6 yr-1 km s-1, more than an order of magnitude lower than that of VLA 2. This suggests that GY 263 is a more evolved YSO. Indeed, the near-IR to mid-IR spectral index of GY 263 is consistent with a Class II YSO (Haisch et al. 2002).
4.2 The Radio Continuum and X-ray Emissions
VLBA observations do not detect any compact emission in YLW 15 down to mJy beam-1. Since VLA 2 is associated with X-ray emission, it is expected to have milliarcsecond radio emission. Yet, the partially extended subarcsecond free-free emission associated with VLA 2 will significantly mask emission at milliarcsecond scales: the observed angular sizes at 6 cm suggest that the radio “photosphere” has dimensions 10 AU. Any emission processes taking place at 6 cm inside this photosphere will suffer from significant free-free absorption and will be very difficult to detect. In order to avoid the absorption of the extended free-free emission, and thus to be more sensitive to milliarcsecond emission, VLBA observations would be best done at 2 cm (where the radio photosphere will be about two times smaller and the optical depth will also be smaller) or at shorter wavelengths.
4.3 The evolutionary status of VLA 1 and VLA 2
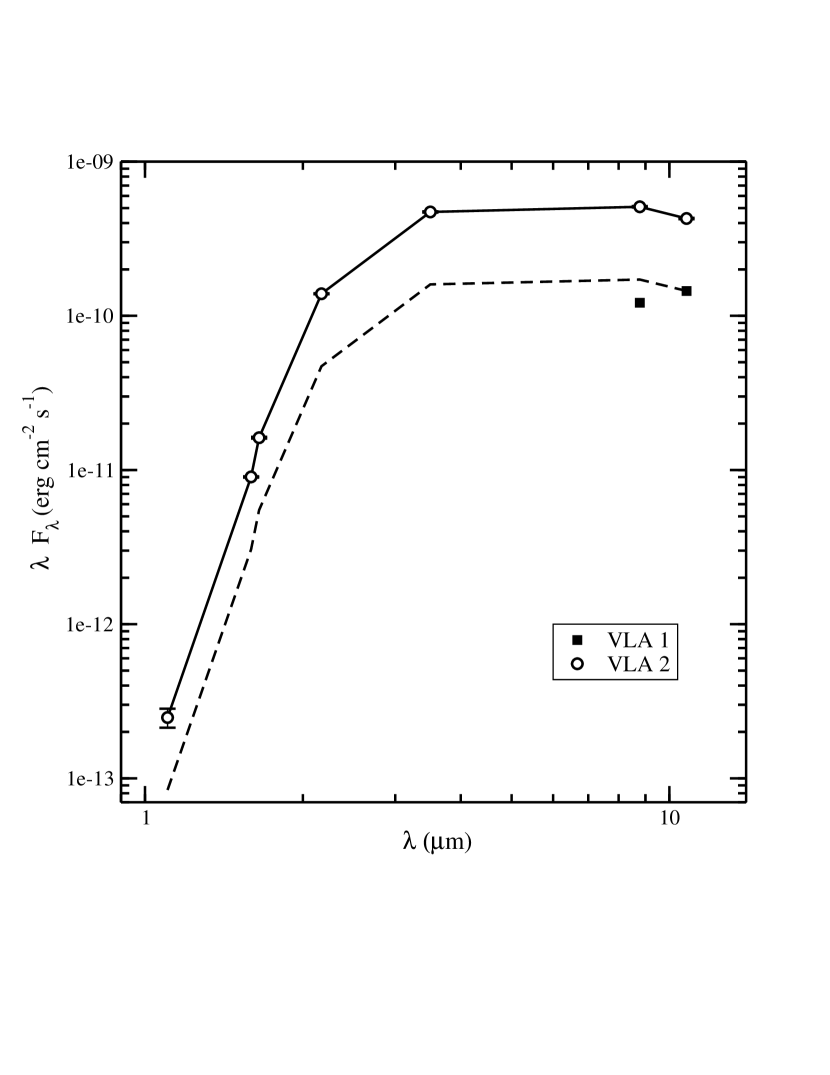
Greene & Lada (2002) and Haisch et al. (2002) argue that VLA 1 and its mid-IR counterpart is not a true star but instead has an outflow origin (i. e., it could be an HH knot). However, the VLA proper motions measured in VLA 1 and VLA 2 (Paper II) clearly shows that these two sources are gravitationally bounded, with VLA 1 being more massive. Therefore, it is clear that VLA 1 is a YSO. The properties of VLA 1 and VLA 2 can be derived from the near-IR through far-IR properties of YLW 15 available in the literature. Figure 6 shows the – plot for those observations in the near to mid-IR range with enough angular resolution to resolve spatially VLA 1 and VLA 2 (Allen et al. 2002; Haisch et al. 2002). It is clear from this plot that the luminosity in the near to mid-IR is clearly dominated by VLA 2. The dashed line shows the spectral energy distribution (SED) of VLA 2 scaled down, so the 10.8 m flux coincides with the VLA 1 flux at this wavelength. The 1.6 (Allen et al. 2002) and 2.2 m (Haisch et al. 2002) observations have enough angular resolution to resolve the binary system, but only VLA 2 is detected. The presence of significant scattered light around YLW 15 does not allow to obtain useful upper limits for VLA 1 (the 2.2 m upper limit for VLA 1 is only 0.2 mag higher than the VLA 2 magnitude, Haisch, private communication). In other words, all what we can say is that in the near to mid-IR wavelengths VLA 1 is less luminous than VLA 2.
The observed near-IR properties show that VLA 2 is a Class I YSO (Haisch et al. 2002; Greene & Lada 2002). In addition, the overall properties of YLW 15 from the far-IR through the mm wavelengths (see § 1) show they also are in agreement with those found in Class I objects. Yet, which is the evolutionary state of VLA 1? Taking into account the near-to-mid IR SED (Fig. 6), there are two possible scenarios for VLA 1: it is more embedded than VLA 2 (i.e., with a steeper SED), or, alternatively, VLA 1 has a similar SED but a lower bolometric luminosity than VLA 2. For this later scenario, the upper limit of the VLA 1 stellar luminosity would be 3 (the value for VLA 2: Greene & Lada 2002). In the first scenario, since the overall properties of YLW 15 are in agreement with those of Class I sources, VLA 1 cannot be much more embedded than VLA 2 (i. e., a Class 0 object). We suggest that VLA 1 is a very embedded YSO in the Class 0 to Class I transition, as it may also be L1448 IRS3(A) (Ciardi et al. 2003). In this scenario, VLA 1 probably dominates the millimeter dust emission and has a stronger outflow. Indeed, VLA 1 is the powering source of a HH system (Grosso et al. 2001) and its radio centimeter emission is stronger than in VLA 2. We speculate that being YLW 15 a binary young stellar system, the dynamical perturbation of the two YSO could diminish the circumstellar mass with respect to the expected values for isolated stars. In fact, the more evolved, Class II, T Tauri close binary stars (with separations in the 1-100 AU range) have less millimeter emission than single T Tauri stars (Jensen, Mathieu & Fuller 1996).
A conclusive test of which of the two sources is more luminous and which is the evolutionary status of VLA 1 as well as its dust properties will come from high angular resolution observations in the mm and sub-mm, as those that will be achieved in the future by the SMA, CARMA and ALMA, and at other wavelengths in the near to mid-IR range.
The most striking feature of the YLW 15 binary system is that VLA 1 appears to be a more massive and more embedded (thereby less evolved) or, alternatively, less luminous YSO than VLA 2. Interestingly, this result is apparently against the expected evolutionary scenario, where one expects that the more massive YSO in a binary system is the more evolved and luminous YSO. Simulations of the evolution of binary YSOs with circumstellar and circumbinary disks show that if one of the two YSO is less massive, the dynamical effects of the system can cause a larger accretion rate to the less massive star (that is expected to evolve more slowly), which will tend to equalize the masses (Lubow & Artymowicz 2000). But, this still does not explain that the more massive is apparently less evolved or less luminous. A plausible explanation is that the less massive component may indeed be more luminous because of its higher accretion rate, since (accretion) luminosity is proportional to accretion rate times stellar mass. GY 263, a Class II YSO and so clearly more evolved than the YLW 15 binary system, is only at 6′′ (720 AU in projection) from YLW 15. If it is truly so close to YLW 15, GY 263 could have had in the past a close approach to YLW 15 and altered significantly the star formation process of YLW 15, possibly reducing the accretion process to the circumbinary disk around YLW 15 (which may explain the low millimeter flux of YLW 15 and the low momentum flux of the CO outflow) and, therefore, altering somewhat the evolutionary scenario of the binary system.
5 Conclusions
We have carried out VLA and VLBA radio as well as COMICS/SUBARU mid-IR (8.8 m) observations of the YSO binary system in YLW 15 and carried out a study of the properties of YLW 15 from previous results available in the literature. The main conclusions are:
-
1.
The properties of the radio continuum emission of VLA 1 and VLA 2 show that these two sources have partially thick free-free emission, likely due to collimated, ionized winds, as it is the case of other Class I and 0 YSOs, with associated molecular and/or HH outflows.
-
2.
The centimeter VLA 1 emission has a jet-like morphology, with the axis coinciding in position angle with the HH outflow found by Grosso et al. (2001) and a jet length of or AU. Undetected in the near-IR, becomes ”visible” at 8.8 m. The 8.8 m emission is slightly resolved, with a deconvolved size of AU, suggesting that the emission arises from a compact circumstellar structure around the protostar.
-
3.
The centimeter VLA 2 emission is partially resolved at scales of 20 AU. Comparison with data taken at other wavelengths shows that VLA 2 is the responsible of the near-IR emission and it is the source of the strong X-ray emission. This source appears unresolved at 8.8 m, implying a small circumstellar structure.
-
4.
VLBA observations failed to detect continuum emission at 6 cm. The lack of ”peri-stellar” emission is likely due to a high optical depth of the free-free emission, that arises at larger scales. Shorter wavelengths should be used to detect the expected centimeter emission associated with the X-ray emission.
-
5.
The near to mid-IR properties of YLW 15 show that VLA 1 is less luminous than VLA 2 in this wavelength range. This could be due to a lower bolumetric luminosity of VLA 1 compared with VLA 2 or alternatively indicate that VLA 1 is a more embedded YSO, and thus, younger or less evolved, than VLA 2. VLA 2 has the SED properties of a typical Class I YSO. Therefore, VLA 1 could be either in the same evolutionary state than VLA 2 or either in the Class 0 to Class I transition.
-
6.
VLA 1 appears to be more massive but more embedded or, alternatively, less luminous than VLA 2. This result is apparently against the expected evolutionary scenario, where one expects that the more massive YSO in a binary system is also the more evolved and luminous YSO.
-
7.
YLW 16A is detected with the VLA. Its position coincides well with the near-IR and X-ray emission observed in the region.
References
- Adams et al. (1987) Adams, F. C., Lada, C. J., & Shu, F. H. 1987, ApJ, 312, 788
- Allen et al. (2002) Allen, L. E., Myers, P. C., Di Francesco, J., Mathieu, R., Chen, H., & Young, E. 2002, ApJ, 566, 993
- André et al. (1992) André, P., Deeney, B. D., Phillips, R. B., & Lestrade, J.–P. 1992, ApJ, 401, 667
- André & Montmerle (1994) André, P., & Montmerle, T. 1994, ApJ, 420, 837
- Anglada (1996) Anglada, G. 1996, in ASP Conf. Ser. 93, Radio Emission from Stars and the Sun, ed. A. R. Taylor & J. M. Paredes (San Francisco: ASP), 3
- Anglada et al. (1998) Anglada, G., Villuendas, E., Estalella, R., Beltrán, M. T., Rodríguez, L. F., Torrelles, J. M., & Curiel, S. 1998, AJ, 116, 2953
- Bontemps et al. (2001) Bontemps, S., et al. 2001, A&A, 372, 173
- Bontemps et al. (1996) Bontemps, S., André, P., Terebey, S., & Cabrit, S. 1996, A&A, 311, 858
- Casanova et al. (1995) Casanova, S., Montmerle, T., Feigelson, E. D., & André, P. 1995, ApJ, 439, 752
- Ciardi et al. (2003) Ciardi, D. R., Telesco, C. M., Williams, J. P., Fisher, R. S., Packham, C., Piña, R., & Radomski, J. 2003, ApJ, 585, 392
- Chick et al. (1996) Chick, K. M., Pollack, J. B., & Cassen, P. 1996, ApJ, 461, 956
- Cohen et al. (1999) Cohen, M., Walker, R. G., Carter, B., Hammersley, P., Kidger, M., & Noguchi, K. 1999, AJ, 117, 1864
- Condon (1997) Condon, J. J. 1997, PASP, 109, 166
- Curiel et al. (2003) Curiel, S., Girart, J. M., Rodríguez, L. F., & Cantó, J. 2003, ApJ, 582, L109 (Paper II)
- Girart et al. (2000) Girart, J. M., Rodríguez, L. F., & Curiel, S. 2000, ApJ, 544, L153 (Paper I)
- Greene & Lada (2002) Greene, T. P., & Lada, C. J. 2002, AJ, 124, 2185
- Grosso et al. (2001) Grosso, N., Alves, J., Neuhäuser, R., & Montmerle, T. 2001, A&A, 380, L1
- Grosso et al. (1997) Grosso, N., Montmerle, T., Feigelson, E. D., André, P., Casanova, S., & Gregorio-Hetem, J. 1997, Nature, 387, 56
- Haisch et al. (2002) Haisch, K. E. Jr., Barsony, M., Greene, T. P., & Ressler, M., E. 2002, AJ, 124, 284
- Imanishi et al. (2001) Imanishi, K., Koyama, K., & Tsuboi, Y. 2001, ApJ, 557, 747
- Jensen et al. (1996) Jensen, E. L. N., Mathieu, R. D., & Fuller, G. A. 1996, ApJ, 458, 312
- Kataza, et al. (2000) Kataza, H., Okamoto, Y., Takubo, S., Onaka, T., Sako, S., Nakamura, K., Miyata, T., & Yamashita, T. 2000, Proc. SPIE, 4008, 1144
- Knude & Hog (1998) Knude, J., & Hog, E. 1998, A&A, 338, 897
- Leous et al. (1991) Leous, J. A., Feigelson, E. D., André, P., & Montmerle, T. 1991, ApJ, 379, 683
- Loinard et al. (2002) Loinard, L., Rodríguez, L. F., D’Alessio, P., Wilner, D. J., & Ho, P. T. P. 2002, ApJ, 581, L109
- Lubow (2000) Lubow, S.H., & Artymowicz, P. 2000, in Protostars and Planets IV, eds. V. Mannings, A. P. Boss & S. S. Russell (Tucson: University of Arizona Press), 731
- Montmerle et al. (2000) Montmerle, T., Grosso, N., Tsuboi, Y., & Koyama, K. 2000, ApJ, 532, 1097
- Motte et al. (1998) Motte, F., Andre, P., & Neri, R. 1998, A&A, 336, 150
- Nisini, Giannini, & Lorenzetti (2002) Nisini, B., Giannini, T., & Lorenzetti, D. 2002, ApJ, 574, 246
- Osorio et al. (2003) Osorio, M., D’Alessio, P., Muzerolle, J., Calvet, N., & Hartmann, L. 2003, ApJ, 586, 1148
- Pezzuto et al. (2002) Pezzuto, S., et al. 2002, MNRAS, 330, 1034
- Reynolds (1986) Reynolds, S. P. 1986, ApJ, 304, 713
- Rodríguez (1997) Rodríguez, L. F. 1997, in IAU Symp. 182, Herbig-Haro Flows and the Birth of the Low Mass Stars, ed. B. Reipurth,& C. Bertout (Dordrecht: Kluwer), 83
- Rodríguez et al. (1998) Rodríguez, L. F., et al. 1998, Nature, 395, 355
- Simon et al. (1995) Simon, M., et al. 1995, ApJ, 443, 625
- Tsuboi et al. (2000) Tsuboi, Y., Imanishi, K., Koyama, K., Grosso, N., & Montmerle, T. 2000, ApJ, 532, 1089
- Ulvestad (2001) Ulvestad, J. 2001, VLBA Scientific Memo N. 25
- Wilking et al. (1989) Wilking, B. A., Lada, C. J., & Young, E. T. 1989, ApJ, 340, 823


| Synthesized | rms Noise | |||
|---|---|---|---|---|
| Beam | (Jy beam-1) | |||
| Epoch | ||||
| (yr) | 3.6 cm | 6 cm | 3.6 cm | 6 cm |
| (2000) | 055019,+27 | 090033,+25 | 50 | 59 |
| (2002) | 040019,+2 | 067031,+10 | 17 | 26 |
| Epoch | Phase | rms Noise | Synthesized |
|---|---|---|---|
| (yr) | Calibrator | (Jy beam-1) | Beam (mas) |
| (2001) | J1625-2527 | 71 | 6.12.2,-6 |
| (2002) | J1625-2527 | 74 | 4.91.9,-2 |
| (J2000) | (J2000) | 3.6 cm | 6 cm | ||||||
|---|---|---|---|---|---|---|---|---|---|
| Year | () | () | Sν (mJy) | Deconvolved Size | PA | Sν (mJy) | Deconvolved Size | PA | |
| YLW 15 VLA 1: | |||||||||
| 2000 | 26.91200.0004 | 50.2950.013 | 1.400.10 | 040(4) 007(2) | 304 | 1.410.13 | 079(9) 013(5) | 263 | |
| 2002 | 26.91250.0002 | 50.3310.005 | 1.510.04 | 032(1) | 353 | 1.380.06 | 051(3) 011(5) | 333 | |
| YLW 15 VLA 2: | |||||||||
| 2000 | 26.93420.0008 | 50.7950.027 | 0.780.11 | 035(8) 012(4) | 2612 | 0.740.13 | 056(15) | 6515 | |
| 2002 | 26.92940.0004 | 50.8990.012 | 0.640.04 | 026(3) 020(4) | 1130 | 0.550.05 | 027(4) | 421 | |
| YLW 16A: | |||||||||
| 2002 | 28.0130.005 | 33.690.07 | 0.550.05 | aaPossibly a binary source. See discussion in text. | 0.270.05 | aaPossibly a binary source. See discussion in text. | |||
| 2000 | 2002 | ||||||
|---|---|---|---|---|---|---|---|
| Source | S3.6cm | S6cm | S3.6cm | S6cm | |||
| VLA 1 | 1.880.10 | 1.380.12 | 0.560.18 | 1.660.03 | 1.270.05 | 0.480.08 | |
| VLA 2 | 0.880.10 | 0.540.11 | 0.880.41 | 0.840.04 | 0.570.05 | 0.700.18 | |
| Whole Region | 2.960.17 | 2.300.22 | 0.460.20 | 2.850.08 | 2.180.12 | 0.480.11 | |
| (J2000) | (J2000) | Offset Positions (,) | |||
|---|---|---|---|---|---|
| Object | Epoch | 16h27m | 40′ | wrt VLA 1aawrt: with respect to | wrt VLA 2aawrt: with respect to |
| 2MASS 1627269-244050 | 1998.52 | 26.9440.012 | 50.730.13 | 0.420.17,0.480.14 | 0.180.17,0.060.16 |
| CHANDRA no. 54 | 2000.28 | 26.9500.037 | 50.90.5 | 0.50.5,0.60.5 | 0.20.5,0.10.5 |