Free-Free Emission at Low Radio Frequencies
Abstract
We discuss free-free radio emission from ionized gas in the intergalactic medium. Because the emissivity is proportional to the square of the electron density, the mean background is strongly sensitive to the spatial clumping of free electrons. Using several existing models for the clumping of ionized gas, we find that the expected free-free distortion to the cosmic microwave background (CMB) blackbody spectrum is at a level detectable with upcoming experiments such as the Absolute Radiometer for Cosmology, Astrophysics, and Diffuse Emission (ARCADE). However, the dominant contribution to the distortion comes from clumpy gas at , and the integrated signal does not strongly constrain the epoch of reionization. In addition to the mean emission, we consider spatial fluctuations in the free-free background and the extent to which these anisotropies confuse the search for fluctuations in 21 cm line emission from neutral hydrogen during and prior to reionization. This background is smooth in frequency space and hence can be removed through frequency differencing, but only so long as the 21 cm signal and the free-free emission are uncorrelated. We show that, because the free-free background is generated primarily at low redshifts, the cross-correlation between the two fields is smaller than a few percent. Thus, multifrequency cleaning should be an effective way to eliminate the free-free confusion.
Subject headings:
cosmic microwave background — large scale structure of Universe — diffuse radiation1. Introduction
Plans for upcoming low-frequency radio experiments able to measure the 21 cm background associated with neutral hydrogen during, and prior to, reionization era (e.g., Scott & Rees 1990; Madau et al. 1997; Zaldarriaga et al 2003; Morales & Hewitt 2003) have motivated study of the foregrounds that may contaminate such measurements. Synchrotron emission from the Milky Way, low frequency radio sources (Di Matteo et al 2002), and free-free emission from free electrons in the intergalactic medium (Oh & Mack 2003) are now thought to be the chief sources of confusion.
While the free-free background contaminates 21 cm studies, the emission itself captures important physics of the ionized component of the intergalactic medium (IGM). In particular, because the emissivity is proportional to the square of the electron number density, free-free emission is strongly sensitive to whether electrons are spatially clumped or distributed smoothly in the IGM. Initial estimates of the free-free background suggest that gas clumping boosts the specific intensity by a factor from order unity at to over 100 at (Oh 1999).
Here, we consider the direct detection of free-free emission through the distortion it creates in the cosmic microwave background (CMB) blackbody spectrum at low radio frequencies (Loeb 1996; Oh 1999). We calculate the mean distortion temperature using a variety of both analytic and numeric clumping models already existing in the literature. While the expected brightness varies by factors of a few between the different models, we suggest that the distortion to the CMB is at a level detectable with the planned Absolute Radiometer for Cosmology, Astrophysics, and Diffuse Emission (ARCADE; Kogut 20003) experiment. A detection of the distortion could help to discriminate between existing clumping models and to constrain the integrated ionization history of the universe. We also show that ionized halos at dominate the background, with only a relatively insignificant contribution from the reionization era.
In addition to the mean background, we estimate the magnitude of spatial fluctuations in the free-free intensity that appear because the ionized clumps are a biased tracer of the dark matter density field. We find that the fluctuations are comparable to or greater than those from the 21 cm signal on the relevant scales. Fortunately, as shown by Zaldarriaga et al (2003), the smoothness of the free-free background in frequency space should allow one to clean these sources in 21 cm maps (see also Morales & Hewitt 2003); the cleaning is quite efficient but relies on the foreground and 21 cm signals being uncorrelated. In fact the two should be anticorrelated, because the free-free emission comes from ionized halos while the 21 cm signal comes from neutral regions. Here we show that, because nearly all of the free-free background arises at , the anti-correlation is at the level of few percent, suggesting that adequate cleaning is possible.
The discussion is organized as follows: in §2, we briefly discuss free-free emission from ionized halos and its potential detectability as a distortion to the CMB. In §3, we discuss the detectability of spatial fluctuations in the free-free background and the extent to which free-free emission contaminates 21 cm measurements. Throughout the paper, we make use of the WMAP-favored LCDM cosmological model (Spergel et al 2003).
2. The Mean Free-Free Signal
First, we write the free-free emission coefficient as
| (1) | |||||
where the Gaunt-factor can be approximated in the radio regime as (Lang 1999). The cumulative specific intensity is simply , where is the conformal time or lookback distance from the observer and with the observed frequency. The electron fraction captures the ionization history of the IGM. In our calculations, unless specified as part of the clumping description, we take a model for reionization based on the UV radiation from star formation (e.g., Haiman & Holder 2003; Chen et al 2003), with a cumulative optical depth to electron scattering of 0.14 (consistent with the recent measurements from CMB polarization data; Kogut et al 2003). We will quote results in terms of the brightness temperature (valid for the Rayleigh-Jeans part of the spectrum).
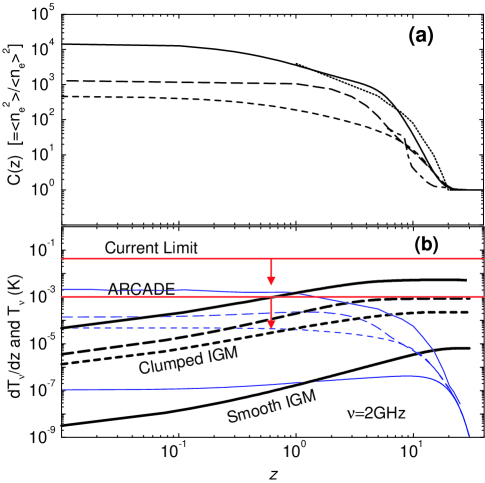
In Eq. (1), we have introduced , the clumping factor of the electron density field. As has been noted previously (Oh 1999), the free-free intensity depends strongly on this factor. Instead of choosing a specific prescription, we make use of a variety of published models for . One approach is to estimate the clumping from the large-scale matter distribution (by, for example, assuming that ionized electrons reside in virialized dark matter halos). Several such models are shown in Fig. 1(a), including estimates based on analytic (Haiman et al 2001), semi-analytic (Benson et al 2001), and numerical (Gnedin & Ostriker 1997) techniques. These clumping models differ in detail, especially around , because they include different aspects of the reionization process, such as the presence of partly ionized minihalos (Haiman et al 2001).
The second approach, taken by Oh (1999), is to construct a model for the production rate of ionizing photons and assume that, throughout the universe, ionization equilibrium is a good approximation. The quantity is then fixed through the relation , where is the recombination coefficient. We show the clumping factor estimated by Oh (1999) in Fig. 1(a) as a dotted line; at high redshifts it assumes that the ionizing photon production rate is proportional to the mass in halos with virial temperatures K (with ionizing photons per collapsed baryon, appropriate for a star formation efficiency of and Population II stars with a standard IMF). We also show a similar estimate using the analytical model of Hernquist & Springel (2003) for the star formation history of the universe, again assuming Population II stars with a standard IMF. While the star formation history is model dependent at high redshifts, this model fits observational measurements at (e.g., Somerville, Primack, & Faber 2001) reasonably well. The Oh (1999) approach predicts stronger clumping than models based on models of the IGM gas do, suggesting that the latter approach may underestimate the clumpiness of galaxies. However, all of the clumping models generally have similar evolutionary histories, with increasing to . We will find below that the detailed behavior at has little effect on the observable results.
As shown in Fig. 1(b), closely traces the redshift evolution of . In a smooth IGM, with , a wide range of redshifts contribute approximately equally to the free-free background, decreasing only around reionization ( in our model). Clumping increases the contribution to the free-free background by a factor at each redshift: because of the sharp increase in the clumping factor at , most of the free-free background arises at these low redshifts and not during the reionization epoch. Unfortunately, since one measures only the integrated background, the redshift evolution of the clumping factor is not directly observable. Note that the models considered give predictions that vary by a factor of a few. This suggests that these measurements may provide a discriminant between some of these models, especially between the two different approaches to clumping calculations. We also see that, independent of the detailed modeling, the predicted distortion to the CMB spectrum is at a level that can be detected with ongoing experiments, such as ARCADE (Kogut 2003). While such a detection would not allow us to extract with confidence a specific model for or to constrain the reionization history independently, a detection or upper limit of K at a frequency of 2 GHz would place useful limits on current models of the ionized gas distribution.
In these calculations, we have assumed K, consistent with measurements of the Ly forest at – (Zaldarriaga et al 2001). The free-free emission does not depend strongly on (, including the Gaunt factor), so allowing the temperature to vary as a function of density, halo mass, or redshift only leads to a reduction in the mean brightness by a few tens of percent or less. Thus, we do not expect uncertainties in the thermal history of the ionized gas to be a significant limitation in these estimates.
3. Angular Fluctuations from Free-free Emission
We now consider the observability of spatial fluctuations in the free-free intensity. In general, fluctuations in the brightness temperature of the free-free background arise from fluctuations in the electron density field. For simplicity, we will neglect anisotropies generated by fluctuations in the ionized fraction during reionization, as the fractional contribution to the mean intensity is dominated by ionized gas at .
We define the angular power spectrum of the free-free background to be , , where is the Fourier transform of free-free brightness temperature. Using the Limber approximation (Limber 1954), we can write the brightness temperature anisotropy power spectrum, observed at a frequency , as
where is the comoving angular diameter distance and is the three-dimensional power spectrum of the electron field. To calculate this quantity we make use of the halo approach to large scale structure clustering (Cooray & Sheth 2002). We assume that on the scales of interest (from degrees to arcminutes), we can describe fluctuations in the density field through the 2-halo part of the power spectrum, which includes the clustering of different ionized halos. Thus we write in terms of the linear power spectrum. We assume that the ionized patches exist in all halos with a minimum mass, that corresponds to K and calculate the bias factor of these halos with respect to the linear density field. Thus
| (3) |
where is the bias factor of the dark matter halos (Mo et al. 1997). Note the additional weighting, which takes into account the fact that the relevant bias factor is that of . Essentially, we assume that the free electrons are in the form of ionized clumps in each dark matter halo, and we assign a halo occupation number proportional to the dark matter halo mass (in analogy to the halo approach for galaxy biasing). With this weighting, exceeds the dark matter bias, although the difference is minor at redshifts of a few.
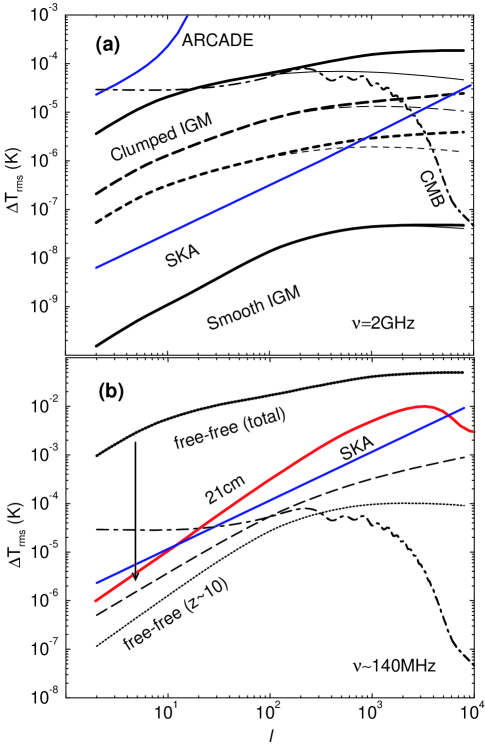
Our results for the angular fluctuations are summarized in Fig. 2(a). The typical fluctuations are K at 2 GHz, a few percent of the mean brightness. This is consistent with a mildly biased field that traces the large scale dark matter field and has its dominant contribution at redshifts of a few. Again the Oh (1999) model predicts substantially larger fluctuations than the other models, suggesting that measurements may distinguish between the two predictions (though without constraining the details of the large scale IGM clumping). For comparison, we also show the noise level, at each multipole, expected for the ARCADE experiment, if it attempts to make anisotropy measurements with a noise per beam size pixel of 100 K and a beam size of 16, and for the planned Square Kilometer Array (SKA). In calculating the SKA noise, we follow the approach of Zaldarriaga et al (2003) and assume a system temperature K at 2 GHz, a bandwidth of 10 MHz, and continuous observations over 4 weeks. We also show the anisotropy power spectrum of primordial CMB fluctuations. While the CMB fluctuations swamp those expected from the free-free background, the CMB contamination can be reduced through two methods: (1) because free-free fluctuations are dominated by point-like clumped regions in the IGM, which are likely to be associated with dark matter halos, one can filter the large scale fluctuations of CMB and concentrate on the remaining point-like emission, or (2) one can use existing cosmic-variance limited CMB maps at higher frequencies to clean the CMB contamination. We see that SKA can in principle detect free-free fluctuations on scales . The main source of confusion will be the uncertain contribution from extragalactic radio sources, such as radio galaxies (Di Matteo et al 2002). Because these sources are also point-like, separating them from free-free fluctuations will require frequency information.
To estimate the background for 21 cm measurements, we consider free-free fluctuations at MHz, corresponding to line emission from neutral hydrogen at . We summarize our results in Fig. 2(b). We also show the SKA noise power spectrum, where we have set K and the bandwidth to 0.2 MHz, because one wants narrow redshift slices in order to observe many independent regions for 21 cm fluctuations. The free-free fluctuations are comparable to or greater than the rms fluctuations in the 21 cm background, as estimated by Zaldarriaga et al (2003), while contamination by the CMB is negligible. As noted by Oh & Mack (2003), free-free fluctuations present a substantial foreground; however, the free-free spectrum is smooth in frequency space. while the 21 cm signal varies strongly over MHz. Thus multi-frequency differencing can efficiently remove the smooth background (Zaldarriaga et al 2003), but only so long as the two signals are uncorrelated. We expect this to be the case with free-free emission: halos with ionized gas will emit free-free radiation but not 21 cm radiation, so the two fields are strongly anti-correlated.
To test how important this effect is, we show the free-free emission from halos in the same redshift slice as the 21 cm signal (a window of 0.2 MHz about ) with the dotted line. To construct this curve we have used the Oh (1999) clumping model; this gives a mean ionizing rate roughly similar to the simulations on which the simple estimate of Zaldarriaga et al (2003) are based (Sokasian et al 2003). Note that and can thus be easily scaled for different clumping scenarios. In particular, in the Oh (1999) approach the free-free signal will just be proportional to . We then estimate the cross-power spectrum between the free-free and 21 cm signals by assuming that they are perfectly anti-correlated on large scales; the (absolute value of the) result is shown by the long-dashed line in the Figure. This curve is thus our estimate for the maximally cleaned 21 cm map; it shows that the two are correlated only on the percent level. Because it is smaller than the noise power spectrum for SKA observations, the free-free signal can be efficiently removed with multi-frequency data.
4. Conclusions
To summarize, we find that the cumulative specific intensity of the free-free background at low radio frequencies is strongly sensitive to the spatial clumping of free electrons in the IGM. Using a variety of existing models for the clumping of ionized gas and its redshift evolution, we find that the expected free-free distortion to the CMB blackbody spectrum, at frequencies of order a few GHz and below, is within the reach of upcoming experiments such as ARCADE. The dominant contribution to the background is from ionized gas at , because the clumping factor is generally large below this redshift. The free-free background varies across the sky at the level of a few to at most ten percent. These fluctuations can be detected with experiments such as the SKA, though a careful separation of CMB anisotropies and other low-frequency radio point sources will be required. At frequencies of order 200 MHz, where observations of 21 cm radiation from neutral hydrogen during and before the epoch of reionization are planned, angular fluctuations from free-free emission could become a significant source of confusion. However, we have shown that the cross-correlation between the 21 cm and free-free signals is small, suggesting that the free-free foreground can be removed to good accuracy.
References
- (1) Benson, A. J., Nusser, A., Sugiyama, N., & Lacey, C. G. 2001, MNRAS, 320, 153
- (2) Bersanelli, M., Bensadoun, M., De Amici, G. et al. 1994, ApJ, 424, 517
- (3) Chen, X., Cooray, A., Yoshida, N., & Sugiyama, N. 2003, MNRAS, 346, L31
- (4) Cooray, A. & Sheth, R. 2002, Phys. Rep., 372, 1 (astro-ph/02064508)
- (5) Di Matteo, T., Perna, R., Abel, T., & Rees, M. 2002, ApJ, 564, 576
- (6) Gnedin, N. Y. & Ostriker, J. P. 1997, ApJ, 486, 581
- (7) Haiman, Z., Abel, T., & Madau, P. 2001, ApJ, 551, 599
- (8) Haiman, Z., & Holder, G. P. 2003, ApJ, 595, 1
- (9) Hernquist, L. & Springel, V. 2003, MNRAS, 341, 1253
- (10) Kogut, A. 2003, New Astro. Rev. 47, 945
- (11) Kogut, A. et al. 2003, ApJ submitted (astro-ph/0302213)
- (12) Lang, K. R. 1999, Astrophysical Formulae Vol. I, Springer-Verlag.
- (13) Limber, D. 1954, ApJ, 119, 655
- (14) Loeb, A. 1996, ApJ, 459, L5
- (15) Madau, P., Meiksin, A., & Rees, M. J. 1997, ApJ, 475, 429
- (16) Mo, H. J., Jing, Y. P., White, S. D. M. 1997, MNRAS, 284, 189
- (17) Morales, M. F. & Hewitt, J. 2003, ApJ, submitted, astro-ph/0312437
- (18) Oh, S. P., & Mack, K. J. 2003, MNRAS, 346, 871
- (19) Oh, S. P. 1999, ApJ, 527, 16
- (20) Scott, D., & Rees, M. J. 1990, MNRAS, 247, 510
- (21) Smith, R. E., Peacock, J. A., Jenkins, A. et al. 2003, MNRAS, 341, 1311
- (22) Sokasian, A., Abel, T., Hernquist, L., & Springel, V. 2003, MNRAS, 344, 607
- (23) Somerville, R. S., Primack, J. R., & Faber, S. M. 2001, MNRAS, 320, 504
- (24) Spergel, D. N., et al. ApJS, 148, 175
- (25) Zaldarriaga, M., Hui, L., & Tegmark, M. 2001, ApJ, 557, 519
- (26) Zaldarriaga, M., Furlanetto, S. R., Hernquist, L. 2003, ApJ, submitted, astro-ph/0311514