Velocity and spatial biases in CDM subhalo distributions
Abstract
We present a statistical study of substructure within a sample of CDM clusters and galaxies simulated with up to 25 million particles. With thousands of subhalos per object we can accurately measure their spatial clustering and velocity distribution functions and compare these with observational data. The substructure properties of galactic halos closely resembles those of galaxy clusters with a small scatter in the mass and circular velocity functions. The velocity distribution function is non-Maxwellian and flat topped with a negative kurtosis of about -0.7. Within the virial radius the velocity bias , increasing to within the halo centers. Slow subhalos are much less common, due to physical disruption by gravitational tides early in the merging history. This leads to a spatially anti-biased subhalo distribution that is well fitted by a cored isothermal. Observations of cluster galaxies do not show such biases which we interpret as a limitation of pure dark matter simulations - we estimate that we are missing half of the halo population which has been destroyed by physical overmerging. High resolution hydrodynamical simulations are required to study these issues further. If CDM is correct then the cluster galaxies must survive the tidal field, perhaps due to baryonic inflow during elliptical galaxy formation. Spirals can never exist near the cluster centers and the elliptical galaxies there will have little remaining dark matter. This implies that the morphology-density relation is set before the cluster forms, rather than a subsequent transformation of disks to S0’s by virtue of the cluster environment.
keywords:
methods: N-body simulations – methods: numerical – dark matter — galaxies: haloes — galaxies: clusters: general1 Introduction
Early simulation work that attempted to follow the merging hierarchy produced a final dark matter structure that was nearly entirely smooth (White 1976; White et al. 1987; Carlberg 1994; Summers, Davis & Evrard 1995; Tormen, Bouchet & White 1997). The reason for this behaviour was debated in the literature as being due to physical or numerical overmerging (White & Rees 1978; Carlberg 1994; van Kampen 1995; Moore, Katz & Lake 1996). The development of fast algorithms to accurately integrate the orbits of millions of particles overcame this problem. The first halos simulated with sufficient resolution contained of the order a thousand substructure halos with properties that resembled galaxies within clusters (Moore et al., 1998). These simulations took many months using parallel gravity codes running on hundreds of processors.
Ongoing research in this area has given many interesting results and we list some of the main conclusions here (Ghigna et al. 1998; Okamoto & Habe 1999; Klypin et al. 1999a; Klypin et al. 1999b, Moore et al. 1999; Ghigna et al. 2000; Springel et al. 2001; De Lucia et al. 2004): (i) Subhalos make up a fraction of between 5 and 10% of the mass of virialised halos. (ii) Halos on all mass scales have similar substructure populations. (iii) The mass and circular velocity function of subhalos are power laws with slopes -1 and -3. (iv) Velocity bias between the subhalos and smooth dark matter background may be significant. (v) The radial number density profile of subhalos is shallower than the dark matter background. (vi) Subhalos are significantly rounder than field halos (vii) The orbits of subhalos are close to isotropic with apo:peri approximately 4:1. (viii) Subhalos suffer mass loss from tidal stripping which modifies their outer density profiles. (ix) The tidal radii of subhalos decreases with cluster-centric position. (x) Most of the surviving population of subhalos entered the parent halo late.
Several of these statements remain controversial and further work is necessary to clarify certain issues. In this paper we re-address conclusions (i)-(v) and attempt to answer some of the remaining questions, including: What is the scatter in the mass and circular velocity distributions? Is there a positive or negative velocity bias and if so what is its origin? Ghigna et al. (2000); Colin, Klypin, & Kravtsov (2000) claim a positive velocity bias whilst Springel et al. (2001) report a negative velocity bias. Have we converged in the properties of subhalos, including their radial distribution and mass functions? The inner regions ( 0.2 ) of clusters and galaxy dark matter simulations are nearly smooth but is numerical overmerging still occurring in these very high density regions? Does the spatial distribution of galaxies in clusters resemble that of the subhalos in simulations? On galaxy scales the observed distribution of satellites is more concentrated than the simulations. Theory can be reconciled with the observations if it is assumed that the visible satellites are a biased subset of the total population (Taylor, Silk, & Babul 2003; Kravtsov, Gnedin & Klypin 2004). On cluster scales we do not expect to find “dark galaxy halos” therefore it is interesting to compare the observed distribution of galaxies with the distribution of substructure.
In this paper we analyse a sample of six high resolution simulations of clusters containing between 5 and 25 million particles integrated with high force accuracy. We compare the mass functions with a sample of galactic mass halos with slightly lower resolution. These new simulations are presented in Section 2 and the general properties of the subhalos are given in Section 3.
2 Numerical Experiments
Table 1 gives an overview of the simulations we present in this paper. With up to particles inside the virial radius of one cluster they are among the highest resolution CDM simulations performed so far. They represent a major investment of computing time, the largest run was completed in about 5 CPU hours on the zBox supercomputer 111http://www-theorie.physik.unizh.ch/stadel/zBox/.
| Run | ||||||||||
|---|---|---|---|---|---|---|---|---|---|---|
| [kpc] | [kpc] | [km s1] | [kpc] | [kpc] | ||||||
| 2.4 | 24’987’606 | 2850 | 1428 | 1853 | 5114 | 0.07 | 126* | 1.10 | ||
| 4.8 | 11’400’727 | 2166 | 1120 | 1321 | 1940 | 0.12 | 162 | 1.12 | ||
| 2.4 | 9’729’082 | 2055 | 1090 | 904 | 1576 | 0.11 | 77* | 1.15 | ||
| 1.8 | 205’061 | 1704 | 944 | 834 | 36 | 0.03 | 260 | 1.11 | ||
| 1.8 | 1’756’313 | 1743 | 975 | 784 | 307 | 0.04 | 136 | 1.11 | ||
| 3.6 | 1’776’849 | 1749 | 981 | 840 | 322 | 0.05 | 227 | 1.13 | ||
| 2.4 | 6’046’638 | 1752 | 983 | 876 | 929 | 0.06 | 126 | 1.11 | ||
| 2.4 | 6’036’701 | 1752 | 984 | 841 | 912 | 0.05 | 183 | 1.11 | ||
| 1.8 | 14’066’458 | 1743 | 958 | 645 | 1847 | 0.06 | 136 | 1.11 | ||
| 2.4 | 5’005’907 | 1647 | 891 | 889 | 829 | 0.06 | 172 | 1.11 | ||
| 2.4 | 4’567’075 | 1598 | 897 | 655 | 721 | 0.06 | 176 | 1.08 | ||
| 2.4 | 4’566’800 | 1598 | 898 | 655 | 661 | 0.06 | 127 | 1.08 | ||
| 2.4 | 4’593’407 | 1601 | 905 | 464 | 706 | 0.06 | 161 | 1.07 | ||
| 0.27 | 1’725’907 | 260 | 160 | 52.2 | 144 | 0.03 | 16 | 1.05 | ||
| 0.27 | 1’905’113 | 268 | 162 | 51.3 | 189 | 0.04 | 20 | 1.03 | ||
| 0.27 | 3’768’008 | 337 | 190 | 94.5 | 462 | 0.04 | 21 | 1.10 | ||
| 0.27 | 2’626’202 | 299 | 180 | 45.1 | 314 | 0.03 | 28 | 1.12 |
2.1 N-body code and numerical parameters
The simulations were carried out using PKDGRAV written by Joachim Stadel and Thomas Quinn (Stadel, 2001). Individual time steps are chosen for each particle proportional to the square root of the softening length over the acceleration, . We use for most runs, only in run we used larger timesteps . The node-opening angle is set to initially and after to to speedup the runs. The code uses a spline softening length , forces are completely Newtonian at . In table 1 is the softening length at , is the maximal softening in comoving coordinates. In most runs the softening is constant in physical coordinates from to present and constant in comoving coordinates before, i.e. . In runs and the softening is constant in comoving coordinates for the entire run, in run the softening has a constant physical length for the entire run.
2.2 Initial conditions and cosmological parameters
We use a CDM cosmological model with parameters from the first year WMAP results: , , , (Spergel et al., 2003). The initial conditions are generated with the GRAFIC2 package (Bertschinger, 2001). Six clusters were selected from a parent simulation and resimulated with much higher mass and force resolution, details about the selection and the refinement are given in Diemand et al. (2004b). We label the six cluster (ordered by their mass) with letters to and with a number that gives the refinement factor in length relative to the in (300 Mpc)3 parent simulation, e.g. ’D12’ is the fourth most massive cluster in our sample, and the mass resolution corresponds to particles in a 300 Mpc cube simulation.
We also present results from four medium resolution galaxy mass halos which we label G0, G1, G2 and G3. These halos contain 2-4 million particles within their virial radii. The parent simulation is a Mpc cube resolved with particles initially. The four galaxies all lie within a volume of about 1000 cubic Mpc (at ) which was refined by a factor of 12 in length to reach the resolution given in Table 1.
2.3 Substructure Identification
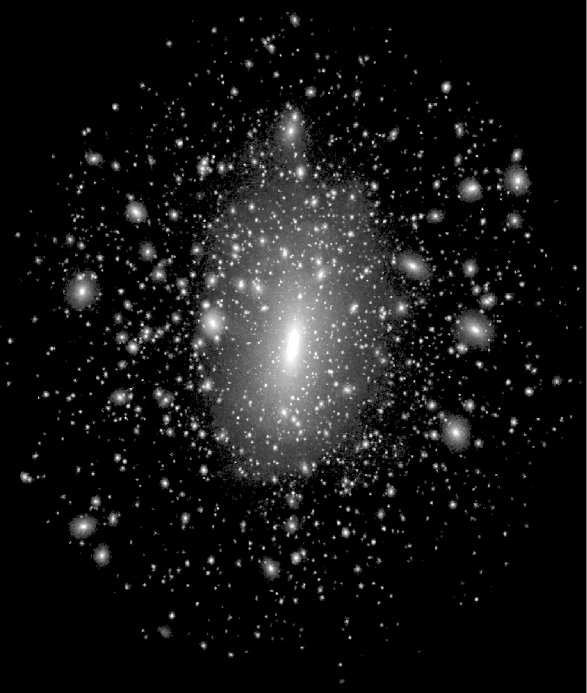
Within the virial radius of the high resolution CDM simulations we can resolve thousands of substructure halos, i.e. self-bound over-dense clusters of particles (See Figure 1). They span a wide range in mass, from the resolution limit of a few tens of particles up to few percent of the cluster mass, i.e. from to . Some of the subhalos even contain their own substructure. Therefore robust identification of subhalos a very difficult task, there is no general, parameter free method that is able to extract the entire hierarchy of halos.
We identify subhalos with SKID (Stadel, 2001) and with a new parallel adaptive Friends of Friends (’FoF’, see Davis et al. (1985)) group finder (’AdFoF’). SKID calculates local densities using an SPH kernel, then particles are moved along the density gradient until they oscillate around a point (i.e. move less than some length ). Then they are linked together using FoF with this as a linking length. AdFoF first calculates the background density of the cluster using spherical bins. The linking lengths for the particles are set to , is the particle mass, is the density contrast, the only free parameter of this method. Two nearby particles can now have different linking lengths, they are considered as friends if one of them considers the other one his friend, i.e. the maximum of the two linking lengths is used. Both the SKID and the AdFoF groups are checked for self-boundness and unbound particles are removed with the same iterative procedure.
We compared SKID results (using , and ) with the AdFof results and we also visually compared the identified groups with the density map of the cluster: SKID with adequately identifies the smallest subhalos and the centers of the largest subhalos. For the latter the calculated bound mass is underestimated. Using can be cure this, but then some of the small subhalos are missed. The AdFoF has the advantage that in principle it links together all particles in regions with a density contrast of against the background density. With AdFof finds the same groups as SKID, but the current version using the spherically averaged density for the background also finds some spurious groups since the background isodensity surfaces have triaxial shape in a CDM cluster. For example, particles on the long axis of a prolate halo can be linked together, since their density is higher than the spherical average. The subhalo catalogues we analyse in this paper are generated in two steps: First we use SKID with , this gives a complete catalogue of all the subhalo centers and also the correct subhalo properties for the smaller objects. Then we run AdFoF with and combine the resulting substructure catalogue with the SKID output to obtain the correct subhalo properties also for the larger objects: if AdFoF found a subhalo at the same position as SKID, the properties from the catalogue where this halo has a larger bound mass are used. The mass fraction bound to subhalos with N (the cluster centre is not considered a subhalo) is given in Table 1. Using the AdFoF or the SKID catalogue alone gives about 20 percent smaller values. Using SKID with underestimates the masses of the biggest subhalos which dominate the bound mass fraction, and the results are as much as a factor of two below the quoted values.
To check for systematic errors in the substructure catalogue constructed in this way, we confirmed that the substructure mass function and the number density profile of one cluster () remains the same when we construct the substructure catalogue in two alternative ways: The first alternative catalogue was constructed by combining three SKID outputs with and as in Ghigna et al. (2000), the second alternative was the combination of two SKID outputs with and and a one AdFoF output. We found that the SKID does not find additional structure, the contains all the small subhalos down to the minimum number of 10. By comparing the final halo catalogue of cluster D12 to regions of the density map of this cluster (Figure 1) we checked that no subhalos were missed and that no non-existent halos were included.
3 Cluster Substructure
We identified subhalos within the virial radii of our six clusters at redshift zero, the algorithms used are described in section 2.3. At the highest resolution we found over 5000 subhalos ( 32 particles) inside the virial radius of the most massive cluster.
3.1 Spatial Antibias and Convergence Tests
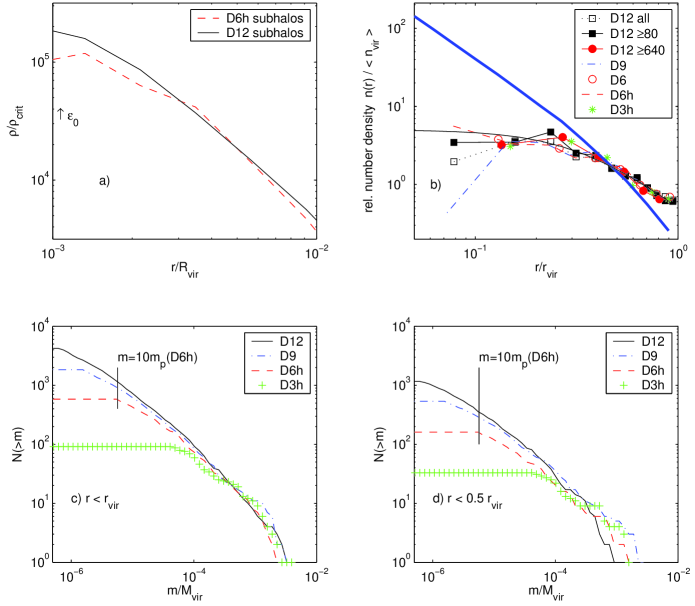
In this section we study the convergence of substructure properties, including density profiles, cumulative mass functions and relative number density profiles (Figure 2). First we check if these properties change with varying force and time resolution, i.e we compare and ; and ; , and . The only slight difference we found is in the relative number density profile: the better force resolution in leads to a few more surviving substructures near the center (4 subhalos within 10 percent of the virial radius), run has no subhalos within the same radius. Therefore the original numerical overmerging problem (Moore, Katz & Lake, 1996) due to insufficient force resolution is not the limiting factor anymore, except near the center of the halos ().
The amount of substructure that our simulations can resolve is mostly limited by mass resolution. Subhalos have very high phase space densities, i.e. relatively short relaxation times. Numerical two body relaxation due to finite mass resolution heats up their cores and makes them less dense (Diemand et al., 2004a). The difference in central density is about a factor of two between subhalos resolved with 500 and 4000 particles (see panel (a) of Figure 2 and also Kazantzidis et al. (2004) where subhalo profiles from clusters , and and their evolution are presented). Subhalos with even less particles show this effect more strongly and have much shallower density profiles. These are less resistant against tidal stripping and total disruption (Moore et al., 1996).
Figure 2 shows substructure properties of the same cluster, , simulated at different mass resolutions with = 205k, 1.7M, 6M and 14M. Panels (c) and (d) of Figure 2 show the cumulative mass function including all subhalos with more than 10 particles. Resolution clearly affects the numbers of subhalos at the limiting mass of 10 particle masses (), however the amount of surviving substructure converges at a mass of about 100 for the D6h run. In analogy with the convergence in density profiles (see Diemand et al. 2004b and references therein) we do not expect that this number is valid for a large range of mass resolutions and it is possible that the high resolution mass functions are only complete above a mass of a few hundred particle masses, especially in the inner region. We usually include all subhalos with at least 32 bound particles for the analysis presented in this paper, and we will always show how the results depend on this minimal number of particles (in most cases the influence is small).
Panel (b) of Figure 2 shows the number density of subhalos in spherical bins relative to the number density within the virial radius . The first bin is centered on the innermost subhalo (the cluster center is not considered as a subhalo), so the first data point also gives the radius of the subhalo closest to the center. The size of each bin is set to , so the first bin starts at and ends at . Tidal disruption is most effective near the cluster center which leads to an antibias in the density profile of substructure relative to the smooth background. This implies that if galaxies are associated with the subhalos, they do not trace the matter distribution of a cluster. Is this antibias real or just an effect of finite resolution? Runs , and have very similar relative number density profiles. If one only considers groups above the 10 particle limit of (i. e. above 80 in run ), run resolves about twice as many halos as (920 against 582, at the vertical line in Panel c) and it is interesting to see where these halos lie. They are not significantly more centrally concentrated, they have a very similar radial distribution as the halos that survived in run . Even the subhalo distribution of all subhalos in (N 10) is very similar to the one of the subhalos in in the same mass range (N 640) which are resolved with 64 times more particles. If the convergence scale depends only mildly on N, for example as in the case of the density profiles (see Diemand et al. 2004b and references therein), the wide range of resolutions presented here gives for the first time a robust confirmation of convergence in the radial distribution of subhalos. So the antibias in number density does not depend on the numerical resolution, but the higher resolution runs allow to measure the number density profiles closer to the center.
The relative number density of subhalos can be approximated by an isothermal profile with a core shown by the thin solid line in panel (b) of Figure 2
| (1) |
where is the relative number density at a subhalos scale radius . The average core radius of the distribution of cluster subhalos is , where is the radius where the circular velocity has its maximum, see Table (1).
3.2 Substructure abundance
Figure 3 shows the cumulative substructure mass functions and inner mass functions of the six clusters which are all well approximated by a simple power law . Here we include subhalos with a minimum of 32 particles, we found in the last section that the subhalo catalogues are complete only above a mass corresponding to about 100 particles. The apparent flattening of the slope towards this mass is due to finite resolution and does not indicate a shallower power law at lower masses. This can also be seen from the fact that around the larger halos and run (i.e. those with better relative mass resolution) have steeper slopes. If hierarchical merging should produce subhalo mass functions that do not depend on the mass of the parent halo (as shown in Moore et al. (1999), see also Section 3.5 of this paper) the natural outcome is an power law: If one simply adds two equal halos the amount of substructure above any fixed absolute mass doubles, the remnant has now twice the mass and it only has the same amount of substructure at a fixed relative mass if the mass function of the progenitors was . The mass function of isolated field halos is also close to a power law of slope (e.g. Jenkins et al. 2001; Reed et al. 2003). Thus tidal stripping acts to lose mass in such a way that the overall mass function slope does not change. The conspiracy is such that stripped halos move down the M versus plane such that they follow the line for field halos (Ghigna et al., 1998).
The cumulative substructure velocity functions (see Figure 3, Panel (c)) gives the number of subhalos with maximum circular velocities above a given value. The virial theorem leads to a simple scaling for field halos. This relation is also a good approximation for subhalos, even if they lost most of their mass due to tidal stripping (Ghigna et al. 1998; Kravtsov et al. 2004). Since the cumulative mass function goes like , we expect the cumulative mass functions to follow a power law. This is true in a wide range of velocities. Towards the resolution limit the velocity functions also become shallower, but this is due to the same numerical effect as in the case of the mass functions. The scatter in the substructure abundance is large at the high mass end (a factor three) where the mass functions depend on a small number of massive objects. At intermediate and small subhalo masses () the scatter is within a factor of 1.7.
3.3 Subhalo velocity distribution
3.3.1 Velocity bias
Figure 3, panel (d) shows the 3D velocity dispersion of the smooth particle background and subhalos. We measured the dispersion profile for each individual cluster, then we averaged the values in each bin over all six clusters. The subhalos dispersions are not weighted by mass, each subhalo has equal weight. In a radial range from 0.1 to 0.4 the substructure halos have a higher 3D velocity dispersion than the background: is . The velocity bias of all subhalos within the virial radius is . The plotted and quoted errors are the scatter in our sample of six clusters and they are much larger than the Poisson noise in the estimated values of .
A negative velocity bias was first considered by Carlberg & Couchman (1989) as a possible way of reconciling low cluster masses with a high matter density universe. Hints for positive bias () were found by Ghigna et al. (1998) and also Colin, Klypin, & Kravtsov (2000) who combined 12 clusters containing 33 - 246 resolved subhalos to obtain a sufficiently large subhalo sample. The first simulation with sufficient resolution (about 5 million particles within the virial radius) to construct a reliable subhalo velocity dispersion profile from one object was analysed in Ghigna et al. (2000). They found in their innermost bin, which goes from 0 to 0.25 , and a small () positive bias for the entire cluster.
The bias is independent of subhalo mass, for example including only halos above (979 subhalos or about 8 percent of the subhalos with ) also gives . And for halos above (only 474 halos or 4 percent) . The velocity bias does not depend on resolution: In the radial range from 0.1 to 0.4 the values lie within and for all simulations of cluster and there is no clear trend with resolution.
3.3.2 Anisotropy of subhalo velocities
In the radial and tangential velocity dispersions the bias is very similar as in the three dimensional dispersion. This can also be seen from the anisotropy parameter , (Panel (d) in Figure 3): The anisotropy is very similar for subhalos and background particles, only in the inner region the subhalo velocities are slightly more isotropic than those of the particle background. From to the anisotropy grows roughly linear with radius: . For the average particle anisotropy seems to fit the data better.
3.3.3 Subhalo dynamics
Here we investigate if the spatial and velocity distribution can be a steady-state solution of the collisionless Boltzmann equation (CBE) or if a supply of infalling structures is needed to maintain the state of the system observed at . We neglect the small anisotropy and assume spherical symmetry, then the integral of the second moment of the CBE, the Jeans Equation (Binney & Tremaine, 1987), reads
| (2) |
where gives the size of the system, and are the density and the one- dimensional dispersion of the subhalos and is the cumulative total mass. A similar equation for the dark matter background is obtained by using density and dispersion of the dark matter instead.
The six clusters can be approximated as NFW profiles (Navarro et al., 1996) with a mean concentration of about (see Diemand et al. 2004b). Using this average dark matter density profile the from Equation (2) fit the measured values (Figure 3) very well. For the radial density profile of the subhalos we use Equation (1), with , the mean of is about 0.57 . The expected bias is
| (3) |
We use a cut off at , at this radius the slopes of and become similar and the bias should vanish. Figure 4 shows the predicted and measured velocity bias and simple power law fit to the measured average velocity bias: . is very close to the measured velocity bias, just in the inner region is too large. This means that the subhalo-background system is close to a steady-state equilibrium configuration.
Therefore we expect the non-equilibrium processes to be subdominant. The net infall of subhalos can be quantified from the asymmetry of the radial velocity distribution of subhalos near the virial radius: The distributions are symmetric in the inner and outer part of the clusters and there is no net infall of subhalos at z=0. Another non-equilibrium process is the disruption of subhalos. The fraction of subhalos that are disrupted is small (see also Section 3.4), about 0.02 Gyr-1 for subhalos with N . In the inner 40 percent of the halo the fraction is bigger, about 0.13 Gyr-1. This could be the reason why the steady-state solution over-predicts the velocity bias near the center.
3.3.4 Higher moments of the velocity distribution
In the last subsection we found that the second moment of the subhalo velocity distribution is consistent with a steady-state solution, where the subhalos have a spatial antibias. Now we consider the next higher moments of the velocity distributions of subhalos and particle background. In the radial range where the velocity bias is large (0.1 to 0.4 ) the shapes of these velocity distributions are very different (Figure 5). There are many less subhalos with small velocities (top panel), also the fraction of subhalos with low velocity components is smaller for the particles (bottom panel). While the particle velocity distribution is close to a Maxwellian, this is not true for the subhalos. The subhalo velocity histogram is flat-topped, it has smaller fourth moment than the Maxwell distribution, i.e. a negative kurtosis . We also calculated the first two non-trivial, even222 The odd moments are zero for symmetric functions. Gauss-Hermite moments , (Gerhard, 1993). In this radial range (0.1 - 0.4 ) we get and . The advantage of Gauss-Hermite moments over simple higher order moments is that they are not very sensitive to the wings of the distribution. In galaxy clusters these outer parts of the distribution are hard to determine exactly due to interlopers (van der Marel et al., 2000).
In Figure 6 we plot the velocity histogram further out (0.5 to ). Now the second moments of the particle and subhalo velocities are much closer (), but the shapes of the velocity distributions of subhalos and particles are still different: , and . For all subhalos within we find , , and .
Both the inner (Figure 5) and outer (Figure 6) subhalos show an excess of high-velocity substructures between and 1.5 . Many of these high-velocity subhalos are on very radial orbits. When we exclude subhalos with absolute values of the radial velocity component larger than the excess disappears and the speed distribution follows the Maxwellian distribution of the background particles above . The large fraction of subhalos with very high radial velocities is also evident in the radial velocity distribution (not shown): both in the inner and outer part of the clusters the distribution has a very negative kurtosis of . Also note that the radial velocity distributions are symmetric, there is not net infall of subhalos at z=0.
The shape parameters depend weakly on the lower mass threshold, including subhalos above instead of 32 yields: , , and . There are 979 subhalos above this threshold in our six clusters, which is only of the subhalo sample, but this is still enough to determine the shape of the velocity distribution. All of these subhalos have bound masses of more than .
3.4 The origin of the subhalo biases
The physical mechanism that generates the differences in the spatial and velocity distributions of particles and subhalos is most likely the tidal destruction of subhalos in dense environments. The efficency of tidal stripping and tidal disruption depends mostly on the orbital energy of the subhalos (Ghigna et al. 1998; Taffoni et al. 2003; Kravtsov et al. 2004). Therefore it offers a natural explanation for the lack of slow subhalos; at a fixed radius the orbital energy is proportional to the square of the velocity and tidal disruption could remove a large fraction of the slow subhalos producing a distribution like the one given in the top panel of Figure 5.
The tidal disruption of subhalos must occur very early in the evolution of the cluster. Ghigna et al. (2000) are able to identify the remnants of 60 to 70 percent of all cluster progenitor halos ( at z=3) with subhalos at z=0. 333The fraction of subhalos that merge with the central object (i.e., end up within an assumed radius of about 0.015 ) are always below 5 percent and can be neglected in this context. But it is an important fraction if one considers the most massive progenitors only (Ghigna et al., 2000).. From the halos identified at an even larger fraction survives (more than 80 percent). For run we performed the same test and get very similar numbers. We link progenitor halos with a halo at if at least four particles of the progenitor are bound to the subhalo at and find descendents for 83 percent of the progenitor halos identified at z=2.
However a significant fraction of subhalos may have been destroyed prior to this epoch. From the halos with identified in the high resolution region of run at z=7.2 and z=4.3, we can associate only about 60 percent with subhalos. At this early stage tidal disruption seems to act as a physical selection process which allows only halos with high enough orbital energies to survive as todays subhalos. This causes the spatial antibias and the positive velocity bias of substructure.
Note that it is important to have a larger minimum number of bound particles in the early subhalo sample () than in the final subhalo catalogue () if one wants to quantify disruption: If we would use the same N at both times then we would get a much higher ’disruption rate’, but we would mostly measure the amount of subhalos that were tidally stripped below this threshold number of bound particles but not necessarily disrupted. This caveat would have a big influence since about half of the considered subhalos have a bound mass between N and 2N.
3.5 Comparison with galaxy size halos
The four galaxies in our sample are resolved with 1.7 to 3.8 million particles, so the relative mass resolution is lower than for the clusters. However, there is enough resolved substructure to compare its abundance and the radial distribution to the results from the cluster runs. We make the comparison with cluster which has similar relative mass and force resolution as the galaxies. We also give the results for the same cluster with eight times better mass resolution (run ) to get an impression how the results might change if we also had higher resolution for the galaxy halos. There may be a hint that the galaxies have slightly less substructure than the clusters, but we need to increase the resolution in the galaxy simulations in order to verify this result.
Galaxy G2 had a recent major merger at , at this merger is finished, the core has no more visible signs of dynamical activity. The concentration of this galaxy is lower , probably due to the later formation in this recent merger. The other three galaxies had no more major mergers since at least and their are between 5 and 6.5.
3.5.1 Substructure abundance
Despite the fact that clusters form much later than galaxies in hierarchical structure formation, they have very similar subhalo mass function. Moore et al. (1999) showed this by comparing two SCDM halos. De Lucia et al. (2004) confirmed this recently for several CDM halos, but at a resolution of less than a million particles inside the virial radius. Figure 7 shows the subhalo abundance in the four galaxies and in the cluster . The velocity functions (Panel a), mass functions (Panel c) and inner mass functions (Panel d) are all quite close to those of the reference cluster run .
The substructure abundance is largest in galaxy , it is as high as in run . This halo formed recently in a major merger at , which is a typical formation history for cluster size halos rather than for galaxies. The other three galaxies have about 30 percent less substructure than and . Therefore the amount of substructure depends weakly on the mass of the parent halo, but the difference appears to be comparable to the scatter within parent halos of a fixed mass.
3.5.2 Radial distribution
The relative number density profiles (Panel (b) of Figure 7) of the galaxy subhalos are more centrally concentrated than those of cluster subhalos (De Lucia et al., 2004). Smaller halos have higher concentrations (Navarro et al., 1996) and are therefore more resistant against tidal disruption. However the subhalo number density also shows a clear antibias with respect to the dark matter density.
The density profile that fits the cluster subhalos distribution (Equation 1) is a good approximation also for the galaxy subhalo number density profile. Now the core radius is a smaller fraction of the virial radius ( ) because galaxy subhalos are more centrally concentrated. Note that is again about two thirds of the radius where the circular velocity is maximal, this is the same fraction as for the cluster subhalos. Therefore scaled to galaxy and cluster subhalos number density profiles are the same.
4 Comparison with observations
4.1 Substructure abundance
Desai et al. (2004) measured galaxy circular velocity function in 34 low-redshift clusters and found that these functions can be approximated by a power-law . In CDM cluster simulations they found a logarithmic slope of . Our higher resolution simulations show that these slopes are rather on the steep side of the given range, Figure (3) shows that the cumulative velocity function has a slope of about , where we expect the sample to be complete. For the differential circular velocity function this gives a slope of , which is not consistent with the observed slope of . Accounting for the effects of the baryons could reconcile CDM simulations with the observations, see e.g. Springel et al. (2001) and Desai et al. (2004). Realistic gas-dynamical cluster simulations will eventually resolve this issue.
The same problem is more severe when the host halo is a galaxy and not a cluster. The steep circular velocity function of CDM halos predicts over 100 subhalos with circular velocities above 5 percent of the parent halo circular velocity, i.e. above 10 km/s for a Milky Way size halo. Our highest resolution cluster has over 300 subhalos above this velocity. But the number of Milky Way satellites with is only 10 (Moore et al., 1999). Various solutions to this issue have been proposed in the literature (e.g. Stoehr et. al 2002, Kravtsov et al. 2004).
4.2 Spatial distribution
For comparison with observed spatial and velocity distributions of galaxies in clusters we ‘observe’ the six simulated clusters along three different line of sights (LOS) (the x, y and z axis) and average over these LOS. We then take the sample averages to get mean values and an estimate of the scatter. The results are shown in Figure 8 and 9.
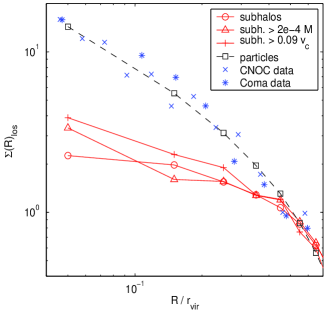
The number surface density is plotted at the midpoints of equal bins in projected distance from the densest region of the cluster. The innermost bin starts at and therefore always one additional subhalo, i.e. the core is counted as the cD galaxy of the cluster. The projected number density is flat near the center, just like the 3D number density in Figure 2. The total sample contains 12’027 subhalos with at least 32 bound particles from the 6 high resolution clusters. In the Coma cluster a number density profile for a comparable number of galaxies (985) can be measured (Lokas & Mamon, 2003), this profile (plotted with stars in Figure 8) is steeper than the subhalo profile and follows rather closely the expected dark matter profile of a CDM cluster. Carlberg et al. (1997) give the surface density profile of a sample of galaxies combined from 14 clusters observed in the CNOC cluster survey. The sample contains 1150 galaxies, including background and goes out to , i.e., per cluster there are about 50 galaxies. Therefore this magnitude limited sample should be comparable to the most massive 300 subhalos in our sample.
We selected the subhalos with and get a sample of 238 halos, their surface density profile is plotted with triangles in Figure 2. The profile does not change much, just in the innermost bin the values rise, due to the relative importance of the ’cD galaxy’. Selecting subhalos by peak circular velocity gives a sample of 291 halos with a similar surface density profile.
The observed number surface density profiles from Carlberg et al. (1997) and Lokas & Mamon (2003) (and also Beers & Tonry (1986) and Merrifield & Ken (1989)) are significantly steeper than in the CDM clusters. To correct the subhalo number density in the inner four bins upwards to match the observed values one needs to add a number of subhalos similar to the total number within the virial radius of each cluster, but preferentially more subhalos closer to the cluster center. We discuss the implications of this result in the conclusions.
4.3 Subhalo velocities
The velocity bias would lead to dynamical cluster mass estimates that are about 20 percent too high if cluster galaxies reside in CDM subhalos. By comparing with cluster mass estimates from gravitational lensing it could be noted the dynamical estimated are too high, but it is very difficult to obtain estimates with small enough uncertainties with both methods. Such a comparison was performed by Cypriano et al. (2001), finding that dynamical masses are indeed biased by in a sample of 14 clusters, but the effect only comes from the massive clusters ( km/s), which show large mass differences , while the smaller clusters show no bias.
Figure 9 shows the projected moments of the CDM subhalo velocity distributions and the inner and outer distribution of line of sight velocities averaged. The ploted values are averages over the six cluster halos and over three different projections. The velocity moments for the dark matter background are also plotted for comparison, a similar analysis was presented by Sanchis, Lokas & Mamon (2004).
In contrast to the spatial distribution the velocity distribution of CDM subhalos agrees surprisingly well with current observations of cluster galaxies. In the grand total velocity distribution of the CNOC survey a negative was found (van der Marel et al., 2000) and . We get , and using all subhalos with bound mass larger than . There are 1152 subhalos above this threshold in our six clusters. This agreement between simulations and observations may be fortuitous since the spatial distribution of galaxies is different and probably due to destruction of low energy central subhalos. Also, in the Coma cluster the velocity distribution seems to be more flat topped compared to a Gaussian: The kurtosis is negative in most radial bins, the values scatter around (see Figure 3 in Lokas & Mamon (2003)). The uncertainties in the measurement of velocity moment profiles are still quite large and a comparison with the projected moments from Figure 9 of the CDM subhalo velocities is not feasible yet.
5 Conclusions
We analyse the substructure within six very high resolution cold dark matter simulations of galaxy clusters and four simulations of galaxies. We have addressed several open issues raised in the introduction regarding the results of high resolution simulations of individual halos within the concordance CDM model. Our conclusions can be summarised as follows:
-
1.
The spatial distribution of subhalos in cold dark matter simulations of galaxies and clusters is antibiased with respect to the mass. Although this behavior was found by other groups, we demonstrate that this result is robust and does not change as we increase the resolution. We show that this antibias most likely results from a population of early halos that are tidally destroyed in the dense protocluster environment and within the central regions of the final cluster.
-
2.
The surviving population of subhalos have a positive velocity bias that increases towards the center of the halos. The subhalo velocity distribution functions are non-Gaussian, they are ’flat topped’, especially in the inner region: There the kurtosis is and the fourth Gauss-Hermite coefficient .
-
3.
The spatial anti-bias and the positive velocity bias of the subhalos are consistent with a steady-state solution of the Jeans equation. Subhalos are a hot, more extended component in equilibrium with the potential generated by the smooth particle background.
-
4.
The mass and circular velocity distributions of subhalos in our highest resolution simulation show the same power law slopes as in lower resolution versions, but are steeper at the low mass end. It is not clear that convergence in the number of subhalos has been reached below a scale of a few hundred particle masses.
-
5.
Cluster and galaxy mass halos simulated at the same resolution have similar substructure abundances. The scatter in the circular velocity and mass functions is a factor of three at the high mass end, but falls to just 1.7 at lower masses.
-
6.
An observational comparison with CNOC cluster data and the Coma cluster shows that the galaxy population traces the smooth dark matter background, but not the predicted halo population. This is most likely due to overmerging in the central region of the simulations and we are probably missing a factor of two in the subhalo population. The baryonic cores of these disrupted subhalos may survive intact if dissipational processes increase their densities sufficiently. Also a greatly truncated dark matter halo may survive in this case.
This latter statement is the most profound conclusion of this work. The spatial distribution of cluster galaxies is significantly different from the distribution of subhalos in dark matter simulations. Either the model is incorrect or we have reached a fundamental limit to this type of pure dark matter simulation. Here we explore the latter possibility and the implications for the morphology density relation.
It is likely that disk galaxies do not significantly modify the overall potential provided by the baryons and dark matter. Whereas a disk-disk merger would funnel gas to the central region, forming an elliptical galaxy with a significantly deeper potential and a effective rotation curve that is at least isothermal, or possibly Keplerian in the center (Romanowsky et al., 2003). Thus we expect that an elliptical galaxy would most likely survive at any position within the cluster, albeit with a greatly truncated dark matter halo. Late type spiral galaxies are unlikely to survive within the central regions of clusters (or their progenitors) and will become physically overmerged to form the cD halo of diffuse light.
If the CDM paradigm is correct then we are missing close to a factor of two of the ‘galaxy’ population as associated with subhalos, increasing to a factor of five within the inner 10% of the cluster. It is possible that simulations with more than particles per system may resolve more central subhalos and calculations this large will be possible in the future. In this case, the velocity bias should decrease as we resolve more halos/galaxies in the central regions. However, from our convergence study we find very few new halos in the central cluster regions as we increase the resolution by a factor of ten. This implies that we have reached a physical limit to DM-only simulations and that any loss of subhalos in current simulations is due to physical overmerging (White & Rees 1978; Moore et al. 1996). In this case progress in this area can only be made by including a realistic treatment of hydrodynamics and star-formation such that realistic disks and elliptical galaxies can be followed within the appropriate cosmological context.
The survival or disruption of a galaxy depends on an intricate balance between the progenitors dark halo structure and the effects of dissipation. Sa-Sb galaxies must lie on the borderline between survival and disruption in the cluster environment. The morphology-density relation may simply reflect the fact that the disks are preferentially destroyed in the central regions of clusters. However if the CDM model is correct one needs to preferentially form ellipticals in high density regions before the cluster forms. The fact that the observed galaxy distribution follows the dark matter distribution implies that no overmerging of galaxies has taken place. It is insufficient to take disks and destroy them in the cluster cores since this would give rise to a cored galaxy distribution.
The fact that 40% of halos identified at z=7 can not be associated with a subhalo at z=0, or have not merged with the central cD, implies that they have merged into the smooth particle background. If these objects can be associated with surviving galaxies, it implies a strong age-radius dependence for galaxies within clusters. At the cluster centres over 80% of the galaxies must have formed prior to z=7.
Acknowledgments
We thank the referee for many insightful comments and suggestions. We are grateful to Ewa Lokas for kindly providing the galaxy number density data for the Coma cluster and to Frank van den Bosch, Chiara Mastropietro, Peder Norberg and Jeremiah Ostriker for useful discussions. We thank the Swiss Center for Scientific Computing in Manno for computing time, we generated the initial conditions there. The simulations were performed on the zBox 444http://www-theorie.physik.unizh.ch/stadel/zBox/ supercomputer at the University of Zurich. J. D. is supported by the Swiss National Science Foundation.
References
- Bertschinger (2001) Bertschinger E., 2001, ApJSS, 137, 1
- Binney & Tremaine (1987) Binney J., Tremaine S., 1987, Galactic Dynamics. Princeton Univ. Press, Princeton
- Beers & Tonry (1986) Beers T. C. , Tonry J. L., 1986, ApJ, 300, 557
- Carlberg & Couchman (1989) Carlberg R. G., Couchman H. M. P., 1989, ApJ, 340, 47
- Carlberg (1994) Carlberg, R. G., 1994, ApJ, 433, 468
- Carlberg et al. (1997) Carlberg R. G., Yee H. K. C., Ellingson E., 1997, ApJ, 478, 462
- Colin, Klypin, & Kravtsov (2000) Colin P., Klypin A. A., Kravtsov A. V., 2000, ApJ, 539, 561
- Cypriano et al. (2001) Cypriano E. S., Sodré L. J., Campusano L. E., Kneib J., Giovanelli R., Haynes M. P., Dale D. A., Hardy E., 2001, AJ, 121, 10
- Davis et al. (1985) Davis M., Efstathiou G., Frenk C. S., White S.D.M., 1985, ApJ, 292, 371
- Desai et al. (2004) Desai V., Dalcanton J. J., Mayer L., Reed D., Quinn T., Governato F., 2004, preprint , astro-ph/0311511
- De Lucia et al. (2004) De Lucia G., Kauffmann G., Springel V., White S. D. M., Lanzoni B., Stoehr F., Tormen G., Yoshida N., 2004, MNRAS, 348, 333
- Diemand et al. (2004a) Diemand J., Moore B., Stadel J., Kazantzidis S., 2004a, MNRAS, 348, 977
- Diemand et al. (2004b) Diemand J., Moore B., Stadel J., 2004b, preprint, astro-ph/0402267
- Frenk et al. (1996) Frenk, C. S., Evrard A. E. , White S. D. M., Summers F. J.,1996, ApJ, 472, 460
- Gerhard (1993) Gerhard O. E., 1993, MNRAS, 265, 213
- Ghigna et al. (1998) Ghigna S., Moore B., Governato F., Lake G., Quinn T., Stadel J., 1998, MNRAS, 300, 146
- Ghigna et al. (2000) Ghigna S., Moore B., Governato F., Lake G., Quinn T., Stadel J., 2000, ApJ, 544, 616
- Jenkins et al. (2001) Jenkins A., Frenk C. S., White S. D. M., Colberg J. M., Cole S., Evrard A. E., Couchman H. M. P., Yoshida N., 2001, MNRAS, 321, 372
- Kazantzidis et al. (2004) Kazantzidis S., Mayer L., Mastropietro C., Diemand J., Stadel J., Moore B., 2004, ApJ in press, astro-ph/0312194
- Klypin et al. (1999a) Klypin A., Gottlöber S., Kravtsov A. V., Khokhlov A. M., 1999, ApJ, 516, 530
- Klypin et al. (1999b) Klypin A., Kravtsov A. V., Valenzuela O., Prada F., 1999, ApJ, 522, 82
- Kravtsov et al. (2004) Kravtsov A. V. , Gnedin O. Y., Klypin A. A., 2004, ApJ in press, astro-ph/0401088
- Lokas & Mamon (2003) Lokas E. L., Mamon G. A., 2003, MNRAS, 343, 401
- Merrifield & Ken (1989) Merrifield M. R. , Kent S. M., 1989, AJ, 98, 351
- Moore et al. (1996) Moore B., Katz N., Lake G., 1996, ApJ, 457, 455
- Moore et al. (1998) Moore B., Governato F., Quinn T., Stadel J., Lake G., 1998, ApJ, 499, L5
- Moore et al. (1999) Moore B., Ghigna S., Governato F., Lake G., Quinn T., Stadel J., Tozzi P., 1999, ApJ, 524, L19
- Navarro et al. (1996) Navarro J. F., Frenk C. S., White S. D. M., 1996, ApJ, 462, 563
- Okamoto & Habe (1999) Okamoto T., Habe A., 1999, ApJ, 516, 591
- Reed et al. (2003) Reed D., Gardner J., Quinn T., Stadel J., Fardal M., Lake G., Governato F., 2003, MNRAS, 346, 565
- Romanowsky et al. (2003) Romanowsky A. J., Douglas N. G., Arnaboldi M., Kuijken K., Merrifield M. R., Napolitano N. R., Capaccioli M., Freeman K. C., 2003, Sci, 301, 1696
- Sanchis, Lokas & Mamon (2004) Sanchis T., Lokas E. L., Mamon G. A., 2004, MNRAS, 347, 1198
- Spergel et al. (2003) Spergel D. N. et al., 2003, ApJSS, 148, 175
- Springel et al. (2001) Springel V., White S. D. M., Tormen G., Kauffmann G., 2001, MNRAS, 328, 726
- Stadel (2001) Stadel J., 2001, PhD thesis, U. Washington
- Stoehr et. al (2002) Stoehr F., White S. D., Tormen G., Springel V., 2002, MNRAS, 335, L84
- Summers et al. (1995) Summers, F. J., M. Davis, A. E. Evrard 1995, ApJ, 454, 1
- Taffoni et al. (2003) Taffoni G., Mayer L., Colpi M., Governato F., 2003, MNRAS, 341, 434
- Taylor (2003) Taylor J. E., Silk J., Babul A., 2003, IAUS, 220, astro-ph/0312086
- Tormen (1997) Tormen G., Bouchet F. R., White S. D. M., 1997, MNRAS, 286, 865
- van der Marel et al. (2000) van der Marel R. P., Magorrian J., Carlberg R. G., Yee H. K. C., Ellingson E., 2000, AJ, 119, 2038
- van Kampen (1995) van Kampen E.,1995, MNRAS, 273, 295
- White (1976) White, S. D. M., 1976, MNRAS, 177, 717
- White & Rees (1978) White, S. D. M., Rees M. J., 1978, MNRAS, 183, 341
- White et al. (1987) White, S. D. M., M. Davis, G. Efstathiou, and C. S. Frenk, 1987, Nature, 330, 45