Testing White Dwarf Crystallization Theory with Asteroseismology
of the Massive Pulsating DA Star BPM 37093
Abstract
It was predicted more than 40 years ago that the cores of the coolest white dwarf stars should eventually crystallize. This effect is one of the largest sources of uncertainty in white dwarf cooling models, which are now routinely used to estimate the ages of stellar populations in both the Galactic disk and the halo. We are attempting to minimize this source of uncertainty by calibrating the models, using observations of pulsating white dwarfs. In a typical mass white dwarf model, crystallization does not begin until the surface temperature reaches 6000-8000 K. In more massive white dwarf models the effect begins at higher surface temperatures, where pulsations are observed in the ZZ Ceti (DAV) stars. We use the observed pulsation periods of BPM 37093 (catalog ), the most massive DAV white dwarf presently known, to probe the interior and determine the size of the crystallized core empirically. Our initial exploration of the models strongly suggests the presence of a solid core containing about 90% of the stellar mass, which is consistent with our theoretical expectations.
Subject headings:
stars: evolution—stars: individual (BPM 37093)—stars: interiors—stars: oscillations—white dwarfs1. MOTIVATION
More than four decades have passed since Abrikosov (1960), Kirzhnitz (1960) and Salpeter (1961) predicted that the cores of white dwarf stars should crystallize as they cool down over time. There has never been a direct empirical test of this theory. The discovery of pulsations in the massive hydrogen-atmosphere (DA) white dwarf BPM 37093 (catalog ) (Kanaan et al., 1992) provided the first opportunity to search for the observational signature of crystallization in an individual star. Theoretical calculations by Winget et al. (1997) and Montgomery & Winget (1999) suggested that the core of this star might be up to 90% crystallized, depending on its mass and internal composition.
In addition to providing the first test of the theory of crystallization in a dense stellar plasma, knowing whether and to what degree this star is crystallized has implications for a more fundamental question. Recent Hubble Space Telescope observations of the faintest white dwarfs in the globular cluster M4 (Hansen et al., 2002) have led to a resurgence of interest in using these stars to provide independent constraints on the ages of stellar populations. The largest potential sources of error in this method arise from uncertainties about the composition and structure of white dwarf interiors. Fortunately, all of the major uncertainties can be minimized through detailed observation and modeling of pulsating white dwarfs, providing a crucial method to probe the stellar interiors and calibrate the cooling models.
The crystallization process leads to one of the largest sources of uncertainty in the ages of cool white dwarfs (Segretain et al., 1994). When a typical mass white dwarf star (, Napiwotzki, Green, & Saffer, 1999) cools down to -8000 K (depending on the core composition), the high-density core will undergo a phase transition from liquid to solid. An associated latent heat of crystallization will be released, providing a new source of thermal energy that introduces a delay in the gradual cooling of the star (for a recent review, see Hansen & Liebert, 2003). In mixed C/O cores, phase separation of the ions during crystallization can provide an additional source of energy, delaying the cooling even further.
Early attempts to determine the crystallized mass fraction in BPM 37093 (catalog ) were plagued by difficulties with uniqueness (Montgomery & Winget, 1999). Recent improvements in our ability to match the observed pulsation periods in white dwarf stars with theoretical models have been driven by the development of an optimization method based on a parallel genetic algorithm (Metcalfe & Charbonneau, 2003). This method allows the objective global exploration of the defining parameters, which is essential to ensure a unique solution. In this Letter, we present the initial application of this method to fit the observed pulsation periods of BPM 37093 (catalog ) with asteroseismological models.
2. OBSERVATIONS
BPM 37093 (catalog ) has been the target of two multi-site observing campaigns of the Whole Earth Telescope (WET; Nather et al., 1990). Preliminary results from these campaigns were published by Kanaan et al. (2000). The 1998 observations (xcov16) revealed a set of regularly spaced pulsation frequencies in the range 1500–2000 Hz, which Nitta (2000) identified as six different radial overtones (), possibly having the same spherical degree (). The 1999 observations (xcov17) revealed a total of four independent modes, including two new modes and two which had been seen in the previous campaign. We obtained new single-site observations of BPM 37093 (catalog ) from the Magellan 6.5-m telescope on three nights in February 2003. These data showed evidence of five independent modes, all of which had been detected in the two previous multi-site campaigns.
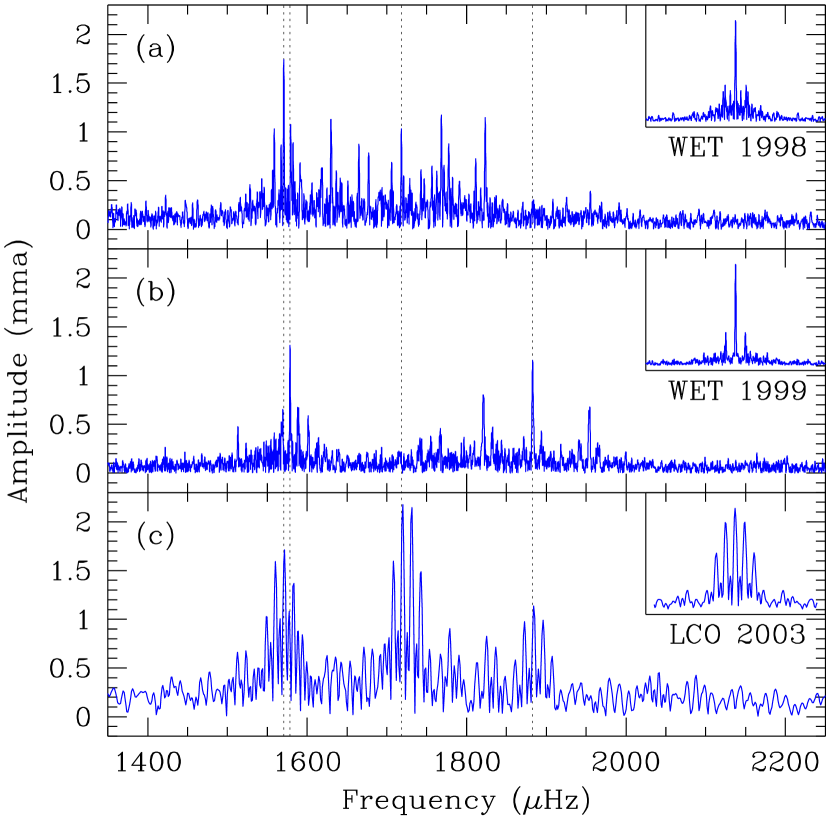
The Fourier Transforms (FTs) of the two WET campaigns and our new single-site observations are shown in Fig. 1. Taken together, these data support the hypothesis—originally proposed by Kleinman et al. (1998)—that each set of observations can provide a subset of the full spectrum of modes that are actually excited in the star. For reasons that are not well understood, the amplitudes of many of the pulsation modes observed in cool DAV stars are highly variable, even though the frequencies appear to be relatively stable. For example, the three FTs shown in Fig. 1 all contain the two closely-spaced modes near 1575 Hz. However, the mode near 1720 Hz in Fig. 1a was not detected the following year in Fig. 1b, but returned with the same frequency in Fig. 1c. Likewise, no mode is detected near 1875 Hz in Fig. 1a, while it is clearly present in both Figs. 1b and 1c.
We adopt the full set of 8 independent modes proposed by Nitta (2000) for model-fitting. We assume that each single mode has an azimuthal order (see Metcalfe, 2003a). For the three modes consisting of two closely-spaced frequencies, we use the average of the two. The adopted list of observed periods is shown in Table 1, along with the periods of two models from our fitting procedure, which we describe in §3.
3. MODEL FITTING
We applied the parallel genetic-algorithm-based fitting method described in Metcalfe & Charbonneau (2003) to match our white dwarf models to the observed periods of BPM 37093 (catalog ) listed in Table 1. The extension of this method from DBV stars to DAV stars primarily involved redefining the temperature range, and adding an adjustable parameter for the H layer mass. This led to a significant increase in computing time, since our code quasi-statically evolves hot polytropic starter models down to the temperature range of interest—and the DAVs are considerably cooler (10,000 K) than the DBVs (25,000 K). To make the problem computationally tractable, our initial exploration of DAV models is necessarily limited compared to recent work on DBVs (Metcalfe, 2003b).
| Pobs | 1.10 (Pure C) | 1.10 (Pure O) | ||||||||
|---|---|---|---|---|---|---|---|---|---|---|
| Pcalc | Pcalc | |||||||||
| 511.7 | 28 | 2 | 511.58 | 0.12 | 27 | 2 | 512.50 | 0.80 | ||
| 531.1 | 29 | 2 | 530.07 | 1.03 | 28 | 2 | 530.00 | 1.10 | ||
| 548.4 | 30 | 2 | 547.18 | 1.22 | 29 | 2 | 547.32 | 1.08 | ||
| 564.1 | 31 | 2 | 563.71 | 0.39 | 30 | 2 | 564.89 | 0.79 | ||
| 582.0 | 32 | 2 | 581.62 | 0.38 | 17 | 1 | 582.27 | 0.27 | ||
| 600.7 | 33 | 2 | 600.53 | 0.17 | 32 | 2 | 600.33 | 0.37 | ||
| 613.5 | 19 | 1 | 615.23 | 1.73 | 18 | 1 | 612.61 | 0.89 | ||
| 635.1 | 35 | 2 | 636.28 | 1.18 | 34 | 2 | 636.22 | 1.12 | ||
3.1. Defining the Parameter-Space
The genetic algorithm explored a range of effective temperatures () between with a resolution of 100 K. This easily encompasses the empirical DAV instability strip (Bergeron et al., 2004), and allows for any possible shifts in the temperature scale of our models due to differences in the constitutive physics (e.g., see Metcalfe, Montgomery, & Kawaler, 2003). Following the recommendation of Bergeron et al. (1995), we fix the convective efficiency to the ML2/=0.6 prescription.
Recent evolutionary calculations suggest that the He and H layer masses for massive white dwarfs like BPM 37093 (catalog ) should be near and respectively (Althaus et al., 2003). We allowed the genetic algorithm to fit for He layer masses between with a resolution of 0.02 dex. Helium layers with would theoretically initiate nuclear burning at the base of the layer. This would likely result in models that are too luminous to be consistent with the observations of BPM 37093 (catalog ), so we do not consider such thick layers.
A similar consideration leads us to exclude H layer masses with . Our search covers the range with a resolution of 0.04 dex, and subject to the constraint that the H layer be at least two orders of magnitude thinner than the He layer. This avoids difficulties with overlapping transition zones (see Bradley, 1996).
Crystallization provides a new energy source for a cooling white dwarf: the latent heat of crystallization. This supplements the thermal energy of the ions and delays the cooling, so it primarily affects the ages of models at a given . Although the star cools more slowly, the thermal structure at a given temperature is nearly identical to what it would be in the absence of crystallization. The change in density due to the transition from liquid to solid is only a few parts per thousand (Lamb & Van Horn, 1975), so the global mechanical structure of the star is also relatively unperturbed. While these evolutionary effects of crystallization have only a minor influence on the pulsations, the presence of a solid core can greatly affect the pulsations. The non-radial -modes are unable to penetrate the solid-liquid interface because the non-zero shear modulus of the solid effectively excludes their shear motions, and the oscillations are confined to the fluid regions (Montgomery & Winget, 1999).
Since we are only interested in fitting the pulsation periods, we can treat the degree of crystallization as an adjustable parameter for a given equilibrium model. We simply modify the inner boundary condition of the pulsational analysis for a given degree of crystallization. This procedure is an order of magnitude less computationally expensive than the evolution part of the problem, so we can afford to repeat it several times. For each evolved model requested by the genetic algorithm, we calculated the pulsation periods for ten values of the crystallized mass fraction between and returned the root-mean-square (rms) differences between the observed and calculated periods for the value of that minimized the residuals. The spherical degree () of the modes was also considered to be unknown, so we calculated all of the and modes between 450 and 700 s for each model. Since there are always more modes for a given model, we required them to be closer to the observed period by a factor to be considered a better match. In effect, we optimized both and the mode identification internally for each model evaluation, while the genetic algorithm optimized the values of the other three parameters.
In this initial study, we performed fits for three fixed values of the stellar mass () corresponding to several published estimates. Bergeron et al. (1995) fit Balmer line profiles to obtain the highest mass estimate (, according to a recent reanalysis by Bergeron et al., 2004). The lowest mass estimate () was based on photometric observations and the trigonometric parallax (Bergeron, Leggett, & Ruiz, 2001). An intermediate value () was obtained by Koester & Allard (2000), who used a combination of UV spectra, photometry, and the parallax.
For each of these three masses we performed fits using models with pure C and pure O cores, which extended to 0.98 in fractional mass. By considering only pure core compositions, we do not have to consider the effect of phase separation of C and O during crystallization, or the subsequent mixing of the remaining fluid layers (e.g., see Salaris et al., 1997). Although these effects could be important, they are expected to have less impact for large degrees of crystallization, as we discuss in §4.
3.2. Hare & Hound Exercises
Before fitting the observed periods of BPM 37093 (catalog ), we performed three ‘Hare & Hound’ exercises to determine what systematic errors might arise due to our limited exploration of , and from fixing the mass and the core composition. We constructed a standard C-core model with K, , , and . We then produced three new models that each differed from this standard model slightly. Model ‘X’ had , model ‘M’ had a mass of , and model ‘C’ had a uniform core of 50% C and 50% O. Next, we calculated the periods of each of these modified models and tried to match them using the genetic algorithm with the mass fixed at and C-core models.
In each case, the genetic algorithm found an optimal model with parameters that were shifted slightly from their input values. The optimal match for model ‘X’ had , but , and the He and H layer masses were offset by (100 K, 0.06 dex, 0.04 dex) respectively. This suggests that our coarse sampling of may lead to small systematic errors in the other three parameters. The best match for model ‘C’ had the same as the input model, but the He and H layer masses and were offset by (0.02 dex, 0.32 dex, 0.2) respectively. This implies that by performing fits only with pure C and pure O cores, we may underestimate the actual value of and the layer masses. The largest offsets came from the fit to model ‘M’, which overestimated the values by (100 K, 0.72 dex, 0.40 dex, 0.2) for , the He and H layer masses, and respectively. By fitting for only a few masses, we might find a spuriously high value of and determine the layer masses only to within a factor of five. The above results for models ‘X’ and ‘M’ can be understood in terms of the calculations of Montgomery & Winget (1999, their §7.4 and Eq. 7), who showed that the average period spacing is much more sensitive to changes in than .
| Parameter | 1.00 | 1.03 | 1.10 | |||||
|---|---|---|---|---|---|---|---|---|
| Pure C | Pure O | Pure C | Pure O | Pure C | Pure O | |||
| (K) | 13,700 | 14,500 | 11,100 | 11,300 | 10,500 | 11,500 | ||
| 2.20 | 2.00 | 2.12 | 2.26 | 2.60 | 2.22 | |||
| 4.40 | 5.00 | 4.28 | 4.36 | 4.60 | 5.64 | |||
| 0.90 | 0.90 | 0.90 | 0.90 | 0.90 | 0.90 | |||
| (s) | 1.24 | 1.04 | 1.08 | 1.14 | 0.95 | 0.86 | ||
3.3. Application to BPM 37093
With these limitations firmly in mind, we applied our fitting method to the observed pulsation periods of BPM 37093 (catalog ). As mentioned in §3.1 we repeated the fitting procedure six times: using pure C and pure O cores for each of three fixed masses. The results of these fits are shown in Table 2. In every case, the genetic algorithm found a model that led to rms differences between the observed and calculated periods () near 1 s, which is comparable to the level of accuracy we achieved with our DBV models (Metcalfe, 2003b).
One of the most striking features of the model-fits in Table 2 is that they all have a crystallized mass fraction of 0.9 within the resolution of the search (). This suggests that the imprint of a large value of on the pulsation periods is sufficiently strong to favor a large value of in the fits regardless of the mass and composition. The best fits are achieved for the highest mass models we consider (1.10 ). The calculated periods and mode identifications for these two models appear with the observed periods in Table 1. Note that an alternative identification for the pure O fit to the 582 s period is a () mode at 582.57 s, degrading the fit to s.
The values of derived from spectral line profile fitting can provide an independent check of the asteroseismological model-fits listed in Table 2. The three mass estimates cited in §3.1 also produced temperature estimates of: K (for ; Bergeron, Leggett, & Ruiz, 2001), K (for ; Koester & Allard, 2000), and K (for ; Bergeron et al., 2004; Fontaine et al., 2003). The temperatures of the lowest mass model-fits are both significantly (4-6) higher than the spectroscopic estimate, while the higher mass model-fits are mostly consistent with the independent measures. Our ‘Hare & Hound’ exercises led us to expect some small temperature shifts in the fits, primarily from fixing the mass and having a limited resolution in .
4. DISCUSSION & FUTURE WORK
We have conducted the first large-scale exploration of models to fit the observed pulsation periods of the potentially crystallized white dwarf BPM 37093 (catalog ). We have limited this initial study to consider several fixed values of the stellar mass and the core composition to keep the problem computationally tractable. Even so, the results shown here represent more than 6 GHz-CPU-years of calculation, which was only practical because of the dedicated parallel computers available to this project (Metcalfe & Nather, 2000).
All of our optimal models lead to . Our ‘Hare & Hound’ exercises suggest that we might be overestimating for individual fits by fixing the mass, but also imply that fixing the core composition could cause us to underestimate by a comparable amount. The best of our six fits is the 1.10 O-core model, which has an rms period difference of only s relative to the observed periods of BPM 37093 (catalog ). The theoretical value of at the temperature, mass, and composition of this model is , suggesting that major revisions to the existing theory may not be required.
With a significant increase in computing resources, we should be able to extend this model-fitting method to treat a range of masses spanning the spectroscopic values. This would have the advantage of eliminating the potential systematic errors in our fit parameters from fixing the mass. As was shown by Montgomery & Winget (1999), the periods of the modes are sensitive to very small changes in , suggesting that a more thorough exploration of this parameter () would also be fruitful—allowing us to test crystallization theory with an unprecedented precision.
Realistic stellar models do not predict pure compositions, but rather a C/O mixture that varies as a function of radius (e.g., Segretain & Chabrier, 1993; Salaris et al., 2000). However, for the large degrees of crystallization which we have found (), the liquid mantle above the crystallized core is expected to be fully mixed and significantly enriched in carbon due to phase separation. As a result, the original C/O profile in the liquid portion of the core will have been erased, removing any mode trapping properties which this region would have had on the the pulsation modes. In this case, the mode trapping would be primarily due to the envelope transition zones of H and He, simplifying the problem. Thus, in future fits it might make sense to treat the liquid C/O mantle above the crystallized core as a uniform mixture of C and O, and to fit for the relative abundances of these two elements—providing additional insights about phase separation.
In the near future we expect that the Sloan Digital Sky Survey will uncover several new massive hydrogen-atmosphere pulsators (Mukadam et al., 2004), and each additional object will offer the opportunity to place independent constraints on crystallization theory. By sampling various masses and temperatures, we may eventually probe the equations of state of carbon and oxygen over a broad range of otherwise inaccessible physical conditions.
References
- Abrikosov (1960) Abrikosov, A. 1960, Zh. Eksp. Teor. Fiz., 39, 1798
- Althaus et al. (2003) Althaus, L. G. et al. 2003, A&A, 404, 593
- Bergeron et al. (1995) Bergeron, P. et al. 1995, ApJ, 449, 258
- Bergeron, Leggett, & Ruiz (2001) Bergeron, P., Leggett, S. K., & Ruiz, M. T. 2001, ApJS, 133, 413
- Bergeron et al. (2004) Bergeron, P. et al. 2004, ApJ, 600, 404
- Bradley (1996) Bradley, P. A. 1996, ApJ, 468, 350
- Fontaine et al. (2003) Fontaine, G., Bergeron, P., Billères, M., & Charpinet, S. 2003, ApJ, 591, 1184
- Hansen & Liebert (2003) Hansen, B. M. S. & Liebert, J. 2003, ARA&A, 41, 465
- Hansen et al. (2002) Hansen, B. M. S. et al. 2002, ApJ, 574, L155
- Kanaan et al. (1992) Kanaan, A., Kepler, S. O., Giovannini, O., & Diaz, M. 1992, ApJ, 390, L89
- Kanaan et al. (2000) Kanaan, A. et al. 2000, Baltic Astronomy, 9, 87
- Kirzhnitz (1960) Kirzhnitz, D. A. 1960, Soviet Phys.—JETP, 11, 365
- Kleinman et al. (1998) Kleinman, S. J. et al. 1998, ApJ, 495, 424
- Koester & Allard (2000) Koester, D. & Allard, N. F. 2000, Baltic Astronomy, 9, 119
- Lamb & Van Horn (1975) Lamb, D. Q. & Van Horn, H. M. 1975, ApJ, 200, 306
- Metcalfe (2003a) Metcalfe, T. S. 2003a, Baltic Astronomy, 12, 247
- Metcalfe (2003b) Metcalfe, T. S. 2003b, ApJ, 587, L43
- Metcalfe & Charbonneau (2003) Metcalfe T. S., & Charbonneau P. 2003, J. Comput. Phys., 185, 176
- Metcalfe, Montgomery, & Kawaler (2003) Metcalfe, T. S., Montgomery, M. H., & Kawaler, S. D. 2003, MNRAS, 344, L88
- Metcalfe & Nather (2000) Metcalfe, T. S. & Nather, R. E. 2000, Baltic Astronomy, 9, 479
- Montgomery & Winget (1999) Montgomery, M. H. & Winget, D. E. 1999, ApJ, 526, 976
- Mukadam et al. (2004) Mukadam, A. et al. 2004, ApJ, submitted
- Napiwotzki, Green, & Saffer (1999) Napiwotzki, R., Green, P. J. & Saffer, R. A. 1999, ApJ, 517, 399
- Nather et al. (1990) Nather, R. E. et al. 1990, ApJ, 361, 309
- Nitta (2000) Nitta, A. 2000, Ph.D. Thesis, The University of Texas at Austin
- Salaris et al. (2000) Salaris, M. et al. 2000, ApJ, 544, 1036
- Salaris et al. (1997) Salaris, M. et al. 1997, ApJ, 486, 413
- Salpeter (1961) Salpeter, E. E. 1961, ApJ, 134, 669
- Segretain & Chabrier (1993) Segretain, L. & Chabrier, G. 1993, A&A, 271, L13
- Segretain et al. (1994) Segretain, L. et al. 1994, ApJ, 434, 641
- Winget et al. (1997) Winget, D. E. et al. 1997, ApJ, 487, L191
- Wood (1992) Wood, M. A. 1992, ApJ, 386, 539