Chemical abundances in QSO host galaxies and environments from narrow absorption line systems††thanks: Based on material collected with the European Southern Observatory Very Large Telescope operated on Cerro Paranal (Chile). Proposal 116.A-0106, 65.O-0299, 67.A-0078 and 69.A-0204
Abstract
We determined C, N and -element relative abundances in the gas surrounding six QSOs at an average redshift of , by studying six narrow associated absorption systems in UVES high-resolution spectra. We found five systems with a metallicity (measured by C/H) consistent or above the solar value. The ionization structure observed in the associated systems is clearly different from that of the intervening ones, indicating that the associated systems are influenced by the strong UV flux from the QSO. There is a possible correlation (anticorrelation) between [N/C] ([Si/C]) and [C/H] of the studied associated systems, and [N/C] when [C/H] . We have compared these observational results with the predictions of a model simulating the joint evolution of QSOs and their spheroidal hosts. The agreement turns out to be very good, in particular, the case envisaging massive haloes and high star-formation rates recovers both the correlation between [N/C] and [C/H] and the anticorrelation for [Si/C] vs. [C/H]. Narrow associated absorption systems prove to be powerful tracers of the chemical abundances in gas belonging to high redshift spheroidal galaxies. The outflow of this same gas, triggered by the QSO feedback, is probably going to contribute to the early enrichment of the surrounding intergalactic medium. A larger statistics, possibly increasing the number of ionisation stages, chemical elements and the redshift range, would allow us to put firm constraints on detailed chemical evolution models of galaxies at high redshifts.
keywords:
galaxies: abundances - galaxies: active - galaxies:elliptical and lenticular, cD - galaxies: evolution - QSOs: absorption lines1 Introduction
In this work, we want to address the star formation history and the evolution of massive early-type galaxies at high redshifts by measuring in a reliable way the metallicity and the chemical abundances of gas belonging to host galaxies and environments of QSOs.
Once considered rare and exotic objects, QSOs could instead represent a necessary phase in the evolution of massive early-type galaxies. This interpretation is supported by several pieces of evidence: Massive Dark Objects (MDOs, generally interpreted as dormant black holes) with masses in the range - M☉ are present in essentially all local galaxies with a substantial spheroidal component (see Kormendy & Gebhardt, 2001, for a review), on the other hand the host galaxies of low redshift powerful AGN (radio-loud and radio-quiet QSOs and radio galaxies) are, in all the studied cases, luminous elliptical galaxies with (Dunlop et al., 2003).
The observational properties inferred for cluster and field elliptical galaxies up to redshift imply a high uniformity and synchronization in the galaxy formation process (e.g. Ellis et al., 1997; Bernardi et al., 1998). The evolution with redshift of their optical-IR colours (Stanford et al., 1998) is consistent with the passive evolution of an old stellar population formed at and the measured positive [Mg/Fe] elemental ratio can be explained by a short and intense star formation burst (e.g. Worthey, Faber & González, 1992; Matteucci, 1994).
In the standard framework of the hierarchical evolution of structures in a cold dark matter (CDM) universe large objects form by a sequence of mergers of smaller proto-galaxies. In particular, massive ellipticals are generated at low redshifts () from the merger of two large disk galaxies which formed stars at a constant moderate rate up to that moment (e.g. Baugh, Cole & Frenk, 1996; Kauffmann & Charlot, 1998). In the merging event, the black holes (BHs) pre-existing in the progenitor galaxies coalesce and a fraction of the cold gas is accreted by the new BH which activates as a QSO, the rest of the cold gas is transformed into stars in a sudden burst (Wang & Biermann, 1998; Kauffmann & Haehnelt, 2000; Volonteri, Haardt & Madau, 2003; Menci et al., 2003).
A different prescription in the framework of the hierarchical scenario is the anti-hierarchical baryon collapse where the formation of stars and of the central BH takes place on shorter time-scales within more massive dark matter haloes (Monaco, Salucci & Danese, 2000; Granato et al., 2001; Archibald et al., 2002; Granato et al., 2004). Supernova heating and QSO feedback are the physical processes that reverse the order of formation of galaxies compared to that of DM haloes because they slow down star formation most effectively in shallow potential wells. In the more massive DM haloes star formation goes on rapidly causing at the same time the growth of the central BH which accretes the cold gas slowed down by the radiation drag. When the QSO activates, strong winds originate sweeping the interstellar medium and halting both the star formation and the BH growth. The time delay between the star formation onset and the peak of the QSO activity is again shorter for larger haloes. For the most massive galaxies () virializing at , this time is Gyr, implying that the bulk of star formation may be completed before type Ia supernovae have the time to significantly enrich the interstellar medium with iron. A detailed analysis of the chemical evolution expected for this model is reported in Romano et al. (2002).
The two above described scenarii predict different chemical abundances, in particular at redshifts larger than . The metallicity and the elemental abundances of high redshift galaxies are hard to measure; on the other hand, high and intermediate resolution spectra of QSOs at redshifts as large as can be easily obtained with the present instrumentation.
We studied associated narrow111The adjective “narrow” is used to distinguish this class of absorptions from the Broad Absorption Lines characterised by FWHM km s-1 and arising in gas ejected by the QSO at large velocities (see also Sections 2 and 7) absorption lines exploiting high resolution, high signal-to-noise ratio spectra of QSOs obtained with the UVES spectrograph and a model for the photoionisation of the gas to derive chemical abundances in the QSO environments. Our results suggest that at these redshifts the gas associated with the QSO and with its host galaxy has already been enriched by the products of an intense star formation episode.
Section 2 introduces the diagnostics that we used to determine the chemical abundances in QSO environments and reports previous results. In Section 3 we describe the selection criteria and the characteristics of our sample of associated narrow absorption line systems; the adopted photoionisation model and the methodology are reported in Section 4. Section 5 is devoted to the description of our results, which are compared with model predictions in Section 6. In Section 7, we summarise the results on QSO chemical abundances obtained using other methods. We draw our conclusions in Section 8.
2 Chemical abundances in the vicinity of QSOs measured with associated narrow absorption lines
The “narrow” absorption lines (NALs) are the most numerous in QSO spectra. A practical way to define them is that they have to be narrow enough that important UV doublets are not blended, i.e. to have FWHM to 300 km s-1.
Here we are concerned only with the NALs falling within km s-1 of the systemic redshift: the so called “associated” systems (AALs). In particular, since we are interested in determining the metal abundances and the physical conditions in the gaseous environments close to QSOs, we would like to identify which of these systems are also “intrinsic”, that is physically associated with the QSO. The intrinsic nature of individual AALs can be inferred from various indicators, for example (1) time variability in the absorption lines requiring dense, compact regions and thus intense radiation fields near the QSO for photoionisation, (2) high space densities measured directly from excited-state fine-structure lines, (3) partial coverage of the emission source measured via resolved, optically thick lines with too-shallow absorption troughs, (4) spectropolarimetry that reveals an unabsorbed or less absorbed spectrum in polarized light, (5) smooth and relatively broad absorption line profiles that are unlike intervening absorbers, and (6) higher ionisation states than intervening absorbers.
Previous studies on AALs have found that in general these systems have solar or supersolar metallicities (e.g. Wampler, Bergeron & Petitjean, 1993; Møller, Jakobsen & Perryman, 1994; Petitjean, Rauch & Carswell, 1994; Hamann et al., 1997; Petitjean & Srianand, 1999; Srianand & Petitjean, 2000). In a few cases moderately subsolar metallicities are observed, but they are still significantly higher than those found in intervening systems at the same redshifts (Savaglio et al., 1997). Besides, a marked change in the metallicity of QSO absorption systems from values smaller than 1/10 solar to solar or larger values is observed at a blueshift of km s-1 relative to the QSO emission lines (Petitjean et al., 1994; Franceschini & Gratton, 1997).
In order to derive reliable metallicities and chemical abundances we had to carefully select our AALs. The adopted criteria and the sample are described in the following section.
3 The sample
3.1 Selection criteria and data analysis
We have considered the 16 QSO spectra of the ESO Large Programme “The Cosmic Evolution of the Intergalactic Medium” (116.A-0106A, P.I. J. Bergeron) available to the public and the 6 QSO spectra of our pair archive described in D’Odorico, Petitjean & Cristiani (2002). All of them were obtained with the UVES spectrograph at the Kueyen unit of the ESO VLT (Cerro Paranal, Chile) with a resolution and a wavelength coverage nm. The signal to noise ratio (S/N) of the Large Programme spectra is S/N , while in our spectra it is varying between S/N and depending on the brightness of the observed QSO. We used the Large Programme spectra reduced with the automatised, refined version of the UVES pipeline (Ballester et al., 2000) devised by Bastien Aracil (see Aracil et al., 2004). The normalisation has been carried out by manually selecting spectral regions not affected by evident absorption and by interpolating them with a spline function of 3rd degree.
In these spectra we looked for C iv and N v doublets within km s-1 from the emission redshift of the QSO. If both absorptions were detected at the same redshift we considered the system as a candidate intrinsic absorber and we looked for other associated ions (like C ii, C iii, N iii, Si ii, Si iii, Si iv, Mg ii, etc).
Among the 22 QSOs in the sample, 16 showed associated C iv doublets summing up to a total of 34 systems of which 15 had detectable N v lines too. In 11 of the 19 systems without N v, the rest equivalent width of the C iv absorption line was lower than Å. Since in general the N v/C iv equivalent width ratio is lower than one, the N v transition even if present could be under our detection limit. Four of the 8 systems with stronger C iv doublets, have C iii/C iv equivalent width ratios larger than one. As we will discuss in Section 5 this is a characteristic of intervening systems while the contrary is true for associated ones. The remaining 4 systems do not show hints of intrinsic nature by any of the six properties listed in the previous section, except one for which an effect of partial coverage is detected.
In order to constrain the photoionisation model (see Section 4) and to get reliable results for the metallicity and the element relative abundances we required also that at least two ionisation states of the same chemical element were detected and that the corresponding absorption lines were not saturated. This requirement reduced the number of viable systems to 6.
The systems excluded from the sample by our defining criteria can be divided into two groups: the first one is formed by those systems for which we did not observe enough ionic transitions to constrain the photoionisation model, for the majority of them only a weak C iv doublet was detected. In some cases, more lines could be observed extending the spectral wavelength coverage with new observations. The second group is made by a few strong systems where most of the lines are saturated not allowing the determination of reliable column densities.
| Ion | Rest wavel. | Osc. strength |
| (Å) | ||
| C iv | 1548.204(2)1 | 0.1908 |
| 1550.781(2)1 | 0.09522 | |
| Mg ii | 2796.3543(2)2 | 0.6123 |
| 2803.5315(2)2 | 0.3050 | |
| Al ii | 1670.7886(1)1 | 1.833 |
| Si ii | 1304.3702 | 0.0863 |
| 1526.70698(2)1 | 0.1103 | |
| 1808.01288(1)1 | 0.00224 | |
| Si iv | 1393.76018(4)1 | 0.5140 |
| 1402.77291(4)1 | 0.2553 |
1 Griesmann & Kling (2000); 2 Pickering et al. (2000; 2002); 3 Spitzer & Fitzpatrick (1993); 4 Bergeson & Lawler (1993)
We fitted the observed absorption lines with Voigt profiles in the LYMAN context of the MIDAS reduction package (Fontana & Ballester, 1995). Adopted atomic parameters differing from those reported in Morton (1991) are given in Table 1.
In the following we will describe in detail the selected systems. The properties of the background QSOs are reported in Table 2.
| QSO Name | Magnitude | Abs. Mag. | |
|---|---|---|---|
| UM680 | 2.1439 | V=18.6 | -27.5 |
| UM681 | 2.1219 | BJ = 18.8 | -27.3 |
| HE1158-1843 | 2.453 | V=16.93 | -29.4 |
| Q2343+1232 | 2.549 | V=17.0 | -29.7 |
| Q0453-423 | 2.661 | V=17.06 | -29.2 |
| PKS0329-255 | 2.685 | V=17.51 | -29.2 |
3.2 Individual systems

| Ion | Redshift | log N | b |
|---|---|---|---|
| (cm-2) | (km s-1) | ||
| H i | |||
| 2.12302(f)1 | 15.22 | 20(f) | |
| C ii | 2.12295(f) | ||
| 2.1231(f) | |||
| N ii | |||
| N v | |||
| 3(f) | |||
| Mg ii | |||
| Al ii | |||
| Si ii | |||
| Si iv | |||
| S iv |
1 We indicate with an (f) those parameters that were assumed and
not determined by the fitting process
2 For the uncertainty on this determination see the discussion in
the text
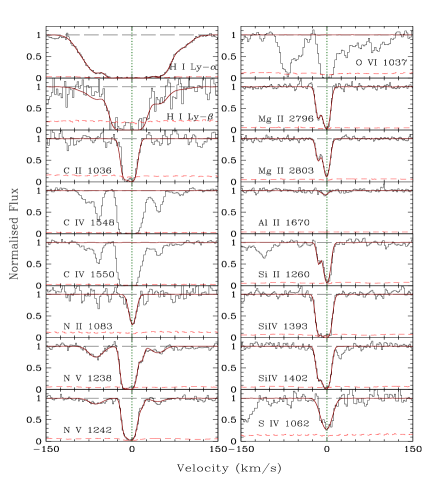
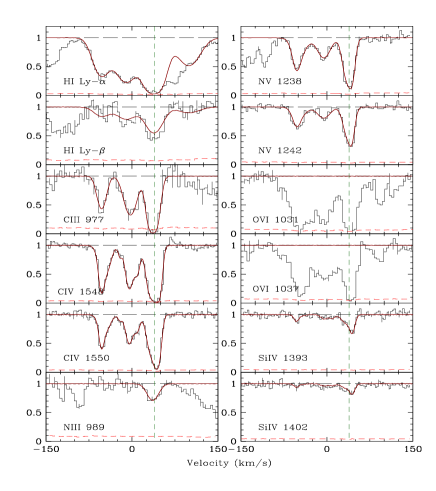
System at towards UM680
The system at ( km s-1) has strong C iv, N v, O vi and Si iv lines. Also C ii, N ii, Mg ii, Al ii, Si ii and S iv are observed. The central components of C iv are too heavily saturated and for O vi the signal-to-noise ratio is too low to determine reliable column densities. Also the H i Ly- line is saturated. In order to obtain an estimate of the H i column density for the velocity component corresponding to the metal absorptions, we fixed its redshift as the average of the two Si ii and Si iv component redshifts. The velocity profiles of the Ly- and Ly- transitions are not constraining the fitting process which does not converge to a unique result. We had then to adopt a Doppler parameter for the central component, while leaving the other component parameters free. For a typical value km s-1 observed for Ly- lines at redshift around 2.1 (see Kim et al., 2001) a H i is derived. To estimate the uncertainty on this determination, we determined the H i column densities for two limit values of the Doppler parameter: km s-1 (consistent with the lower limit observed in the -distribution of the Lyman forest) and km s-1 (the maximum value allowed by the Ly- velocity profile). They turned out to be H i and H i respectively. In the following computation of chemical abundance ratios for this velocity component we will adopt as the error on the H i column density 0.6 dex to take into account this uncertainty on its determination.
All the measured column densities are reported in Table 3 and the ionic transitions are shown in Fig. 1.
The fine-structure transition absorptions C ii∗ corresponding to the strong absorption lines due to C ii are absent. Besides, we did not observe the Si ii∗ fine-structure line associated with the Si ii absorption. The upper limits on the Si ii∗/Si ii column density ratio for the two observed components are and . The corresponding upper limits on the temperature derived from the Doppler parameters are and respectively. Following Srianand & Petitjean (2000) we determined an upper limit on the electron density of cm-3 applying the average values of the previously reported limits to the formula of pure collisional excitation (Fitzpatrick & Spitzer, 1997, and references therein, note that excitation by hydrogen atoms is unimportant):
| (1) |
where X is either silicon or carbon, are the collision excitation and de-excitation rates, and is the radiative decay rate (see Fig. 2). Since the gas is optically thin it is reasonable to assume .
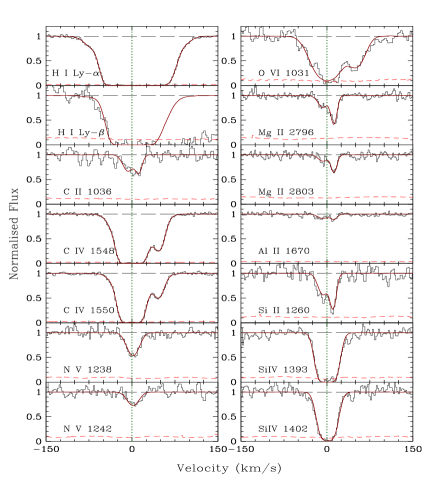
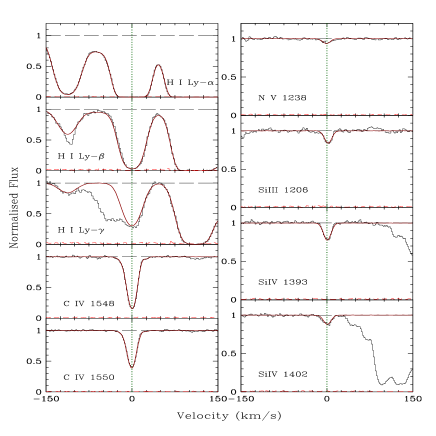
System at towards UM681
An absorption system at ( km s-1) is detected with lines due to C iv, N v, O vi and Si iv. The low ionisation transitions of C ii, N ii, Si ii, Al ii and Mg ii are present too (see Fig. 3). The H i Ly- absorption is saturated and the Ly- line is partially blended. To measure the H i column density we fixed the redshift of the main component as the average of the two components observed in the low-ionisation transitions. We used only the Ly- line to determine the fitting parameters and verified the consistency of the result with the blue wing of the Ly- velocity profile which looks free from major blending. All the measured column densities are reported in Table 4.
| Ion | Redshift | log N | b |
|---|---|---|---|
| (cm-2) | (km s-1) | ||
| H i | |||
| 2.122015(f) | |||
| C ii | |||
| C iv | |||
| 2.122016(f) | 13.5(f) | ||
| N v | |||
| O vi | |||
| Mg ii | |||
| Al ii | 2.121932(f) | 11(f) | |
| 2.122128(f) | 6(f) | ||
| Si ii | |||
| Si iv |
Also for this absorption system we did not detect the fine-structure transition lines of C ii and Si ii. We obtained the upper limits on the column density ratio C ii∗ over C ii and on the gas temperature for the two components of the system: C ii∗/C ii and , and C ii∗/C ii and respectively. In Fig. 2, we plot the curves of the C ii ratio as a function of temperature for constant as given by eq. 1. The observed limits are consistent with an electron density of cm-3.
Note that this absorption system and the one along the line of sight to UM680 are less than km s-1 apart in redshift and that the two lines of sight are separated by kpc proper distance at this redshift.
| Ion | Redshift | log N | b |
|---|---|---|---|
| (cm-2) | (km s-1) | ||
| H i | 20 (f) | ||
| 2.442263 (f) | |||
| 2.442616 (f) | |||
| 2.443143 (f) | |||
| 2.443506 (f) | |||
| 2.444044 (f) | |||
| C iii | |||
| C iv | |||
| 2.444378 (f) | 10 (f) | ||
| N v | 2.440400 (f) | 5 (f) | |
| 10 (f) | |||
| 2.444680 (f) | 8 (f) |
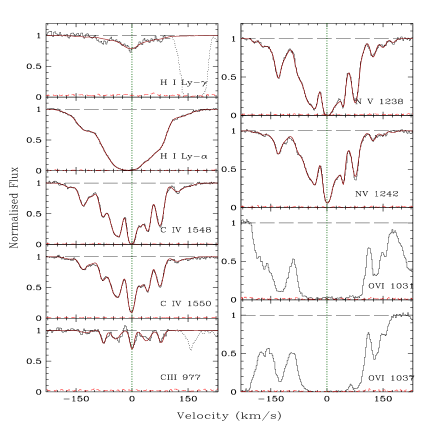
System at towards HE1158-1843
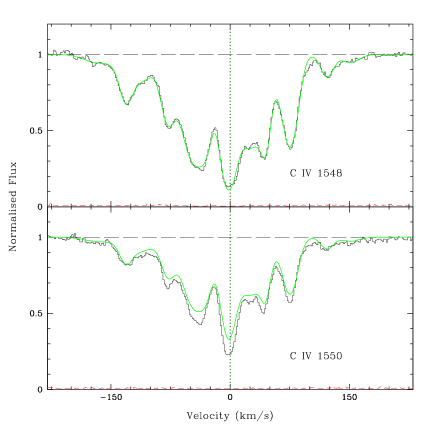
A km s-1 wide system is observed at an average velocity of km s-1 from the systemic redshift of QSO HE1158-1843 with associated C iii, C iv, N v and strong O vi absorption lines, as shown in Fig. 4. N iii, Si iii and S iii are blended if present, while Si iv and S iv are not observed. In Fig. 5 we show that the intensity ratio of the lines of the C iv doublet is not 2 as expected, this could be due to an incomplete coverage of the continuum source by the absorber. The unnatural ratio of the N v doublet lines and the disagreement between the H i Ly- line and the Ly-, Ly- line intensities confirm the hypothesis of partial coverage. In order to measure column densities for the observed ions we artificially fixed the zero level at the bottom of the stronger lines of the C iv and N v doublets and carried out the fitting. We followed the same procedure for the Ly- for which we adopted the redshifts of the main C iv components. The column density obtained for the central component of Ly- is consistent with the velocity profiles of Ly- and Ly-. They are reported in Table 5.
The upper limits on the column densities for the undetected Si iv and S iv transitions are Si iv and S iv where we have adopted the Doppler parameter of C iv for the component at .
The partial coverage effect suggests that the size of the absorbing cloud is comparable with that of the continuum source, in the hypothesis of spherical geometry it is possible to derive a lower limit to the absorber total density (Petitjean et al., 1994):
| (2) |
where we have adopted pc as the extension of the ionizing source considering that both the broad line region and the continuum emitting region contribute to the ionizing flux.
We computed the chemical abundances only for the strongest component at for which the column densities of both H i and metals where best determined.
| Ion | Redshift | log N | b |
|---|---|---|---|
| (cm-2) | (km s-1) | ||
| H i | 2.568871(f) | ||
| C iii | |||
| 9(f) | |||
| C iv | |||
| 3(f) | |||
| N iii | |||
| N v | 2.568869(f) | ||
| 2.568934(f) | |||
| Si iv | |||
System at towards Q2343+1232
A system with three main components is observed in the spectrum of Q2343+1232, redshifted by km s-1 with respect to the QSO emission lines. It shows absorptions due to C iii, C iv, N v and a weak Si iv. N iii is detected only at the redshift of the strongest component. The upper limits on the other two main components obtained adopting the Doppler parameter of C iii are: N iii at and N iii at . The H i column density was obtained by the simultaneous fitting of the Ly- and Ly- absorption complexes which look free from blending. The detected ionic transitions are shown in Fig. 6 and the measured column densities are reported in Table 6.
| Ion | Redshift | log N | b |
|---|---|---|---|
| (cm-2) | (km s-1) | ||
| H i | |||
| C iv | |||
| 3(f) | |||
| N v | |||
| Si iii | |||
| Si iv |
System at towards Q0453-423
A C iv doublet is detected at this redshift ( km s-1) showing a very weak associated N v absorption and also weak Si iii and Si iv (see Fig. 7). O vi and C iii are possibly present although they are blended. The upper limit on the N iii and C iii column densities adopting the redshift and Doppler parameter of Si iii are N iii and C iii. The H i Ly- and Ly- lines were used to determine the column density: H i which is consistent with the blended Ly- absorption. All the measured column densities are reported in Table 7.
| Ion | Redshift | log N | b |
|---|---|---|---|
| (cm-2) | (km s-1) | ||
| H i | |||
| C iii | |||
| C iv | |||
| N v | |||
| O vi | |||
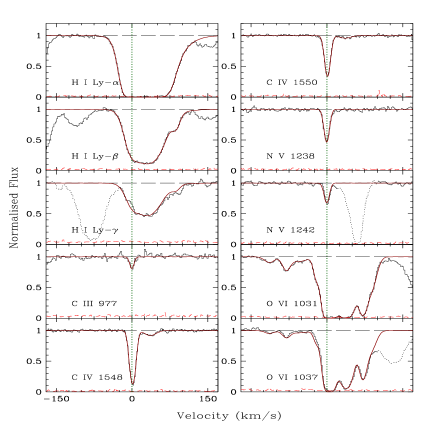
System at towards PKS0329-255
This system is redshifted by km s-1 from the QSO emission lines. It shows optically thin absorptions due to C iv, C iii and N v. O vi is also detected, it is saturated and with at least two other components besides the one in common with the other ions (see Fig. 8). The measured column densities for the observed transitions are reported in Table 8. The upper limits on the column densities of N iii and Si iv obtained adopting the Doppler parameter of C iii and C iv, respectively are: N iii and Si iv. The H i column density corresponding to the metal absorption is well constrained by the simultaneous fitting of the Ly-, Ly- and Ly- transitions which gives: H i.
4 The photoionisation model
In order to obtain elemental abundances from the observed ionic column densities it is necessary to compute ionisation corrections. To this purpose we used the code Cloudy (Ferland, 2003) adopting as an ionising spectrum a typical QSO spectrum derived from Cristiani & Vio (1990) and extrapolated in the region shortward of the Ly- emission with a power law corresponding to the continuum slope observed redward of the Ly- emission. At energies higher than the Lyman limit, we adopted a power law following Hamann et al. (2001). This is consistent with the best observations of luminous QSOs and with the slope of the UV background at high energies. We verified that results did not change using a slightly different composite spectrum obtained from the FIRST bright QSO survey by Brotherton et al. (2001). The absorption in the range Å was corrected adopting the power law fitting the spectrum at larger wavelengths: and for Å we used as before.
We assumed that components of different transitions which are at the same velocity arise in the same gas and we tried to reproduce with Cloudy all the ionic column densities observed at the same redshift with a single-region model.
As a zero-order approach we computed for each system a grid of Cloudy models for a cloud with the measured H i column density, solar metallicity and relative abundances, varying the ionisation parameter, which is defined as:
| (3) |
where is the luminosity density of the QSO spectrum, is the speed of light, is the separation between the QSO and the illuminated face of the cloud and (cm-3) is the total hydrogen density (H ii + H i + H2).
In every studied system it was not possible to reproduce all the observed ionic column densities with a single value, even allowing for a vertical shift to account for a non-solar metallicity. This was true also when considering groups of ions of similar ionisation state. Then, this discrepancy cannot be ascribed (only) to the fact that we are treating as a single region a multi-phase gas, and to be solved it requires the introduction of non-solar relative abundances.
To derive the relative abundances and reproduce the observed set of column densities we followed three main steps.
(1) The value of the ionisation parameter for the considered absorption system, , was fixed on the basis of the column density ratio of two, possibly close, ionisation states of one or more elements.
(2) The column densities of all observed ions were then computed with Cloudy for , with the measured H i column density, solar metallicity and relative abundances. The ratios of the observed to the computed column densities were taken as the variations of the element abundances with respect to the solar values.
(3) As a final step, we introduced new elemental abundances in the model computed from the variations determined in step (2). Then, instead of fixing we normalised the spectrum with the absolute magnitude of the studied QSO and ran a grid of models varying the value of and finding the corresponding values of which gave viable solutions.
Due to the degeneracy between the total density and the radius (refer to eq. 3), for all the reasonable values of it is possible to find a corresponding at which the set of column densities matches the observed one. For three systems in Section 3.2 we derived physical limits on in an independent way which consequently gave limits on the distance from the source. In principle it is possible to derive a lower limit on , that is an upper limit on the distance from the QSO, computing the total density of a cloud with the observed neutral hydrogen column density and a characteristic dimension equal to the local Jeans length (see Schaye, 2001). However, this approach, due to the low H i column densities observed, does not provide stringent limits ( Mpc).
We could not determine the metallicity of the gas from the abundance of iron, since we did not observe iron in our systems neither as Fe ii nor as Fe iii. Observations of stars in our Galaxy show that [C/Fe] is consistent with solar at least for [Fe/H] (Carretta, Gratton & Sneden, 2000). This is predicted by chemical evolution models of our Galaxy where a consistent amount of carbon is produced by low and intermediate mass stars (Timmes, Woosley & Weaver, 1995; Chiappini, Romano, & Matteucci, 2003), enriching the interstellar medium on a time-scale similar to that of iron enrichment from Type Ia SNe. In our analysis, we used carbon as a proxy of iron and we computed the -element abundances compared to it.
5 Results
We investigated the star formation history in the close neighbourhood of six QSOs at emission redshifts between 2.1 and 2.7 deriving the metallicities and relative chemical abundances of six associated narrow absorption systems. The results of our calculations are summarised in Table 9 where errors on the abundance ratios are due mainly to the uncertainties in the column density determinations.
1. For the systems associated with the QSOs UM680 and UM681 we were able to put upper limits on the total hydrogen density in an independent way (see Section 3.2). They correspond in the Cloudy photoionisation models to lower limits on the distance from the emitting source of 70-120 kpc and 120-260 kpc for UM680 and UM681 respectively. The two absorption systems fall at very close redshifts and present similar velocity structures, evidences that suggested the presence of a diffuse gaseous structure possibly including the two QSOs (Shaver & Robertson, 1983; D’Odorico et al., 2002). The metallicity of the two systems is quite uncertain due to saturated H i Ly- lines. However, the system associated with UM680 has a [C/H] abundance ratio at least 5 times solar and larger than that of UM681 which is consistent with solar. The [/C] is larger in UM681 than in UM680, while the two systems have [N/C] abundances consistent with solar. We speculate that the observed gas is an outflow of UM680 which is pierced by the UM681 line of sight in an external, less enriched region. Deep imaging of the field could possibly shed some light on the nature of these absorbers. For example by detecting Ly--emitters at the same redshift of the absorbers tracing a large scale structure between the two lines of sight.
2. For the absorber towards QSO HE1158-1843 it was possible to compute a lower limit on the total density which translates into a separation from the continuum source smaller than kpc. In this case we can assert that we are probing the abundances in the interstellar medium of the host galaxy. The metallicity is about twice solar and the N/C ratio is slightly supersolar. Unfortunately we did not detect any -element.
3. The three components of the system in QSO Q2343+1232 show very similar relative abundances although the H i column densities vary of a factor of 3 among them. The metallicity and the ratio N/C are between 2 and 3 times solar and there is an indication of -enhancement.
4. The two systems at larger redshifts are characterised by small C iv equivalent widths and show different abundance patterns compared to the other systems. In particular they have undersolar N/C ratios.
5. No significant correlation is observed between the velocity separation from the quasar and the metallicity of the system. This suggests that the observed separations cannot be trivially related to the actual spatial distances between the central source and the absorber due both to uncertainties in the emission redshift determination and to peculiar velocities of the absorbing material.
As shown in Fig. 10, only one among the six studied systems has a metallicity significantly lower than solar, . The other 5 systems show values comparable or larger than solar. We confirmed the supersolar N/C abundance ratio in those systems with , as already found in other AALs (see Hamann & Ferland, 1999, for a review). On the other hand, in our AALs we measured enhanced -element/C abundance ratios at variance with the tentative detection of supersolar Fe/Mg abundance ratios in broad emission line regions (see Section 7) but in agreement with abundances measured in elliptical galaxies. This suggests that we are sampling regions where SNe Ia did not yet have the time to enrich the gaseous medium, implying that the bulk of star formation started less than Gyr before.
Due to the lack of constraints on the total density of the absorbers we cannot reliably establish how close they are to the continuum source in all but one case. However, adopting a density typical of the interstellar medium, cm-3, we obtained separations of the order of kpc. To reach such a distance in yrs, the average lifetime of a QSO, the gas should have travelled at a velocity of km s-1, which is indeed of the order of the measured for our systems.
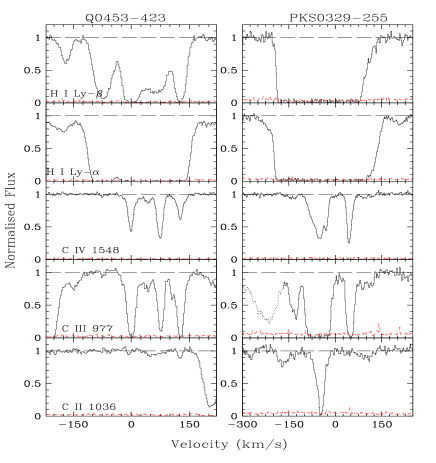
Another way to test the hypothesis that these systems are under the strong influence of the associated QSO and probe chemical abundances in the QSO vicinity is to compare them with intervening systems with similar C iv equivalent width. In Fig. 9 we show two examples of intevening systems at velocity separations of and km s-1 from the QSOs Q0453-423 and PKS0329-255 respectively. It is apparent that the ionisation pattern is completely different from the one observed in AALs, in particular the C iii transition is much stronger than the C iv line while in the studied AALs the C iii/C iv column density ratio is always lower than one. This suggests that most optically thin intervening systems are ionised by the diffuse UV background while associated systems receive the direct emission from the QSO. In particular, the ionisation energy of the C iii C iv transition is close to a break present in the UV background spectrum at the He ionisation energy which is absent in the unabsorbed QSO spectra.
The analysis of abundances in intervening systems is a difficult task because in many cases it is not possible to derive with confidence the H i column density and, in general, there is an ambiguity on which kind of sources is ionising the gas. However, the vast majority of the studies on intervening Lyman limit and optically thin metal absorption systems carried out up to now found undersolar metallicities (e.g. Bergeron, et al, 1994; Köhler et al., 1999; Prochaska & Burles, 1999; D’Odorico & Petitjean, 2001). Finally, the damped Ly- systems for which the determination of abundances is very precise due to negligible ionisation corrections, are characterised by an average metallicity lower than 1/10 solar at .
We conclude that the associated systems show indeed a peculiar chemical abundance pattern and in the following section we try to frame our results into a model for the chemical evolution of large elliptical galaxies.
6 Comparison with model predictions
We compared the present results on abundances with theoretical predictions based on a physical model for the co-evolution of QSO and host galaxy systems (Romano et al., 2002; Granato et al., 2004). In order to illustrate the effects of the star-formation rate (SFR) history on abundances, we considered two cases for the gas distribution inside the virialized DM halo. The first one, case A, assumes that the gas closely follows the DM profile with no clumpiness, while in the second case, B, we assumed that after virilization on the average the gas follows the DM profile, but we introduced a clumping factor. As expected, in case A it is difficult to get a rapid star formation in DM haloes with M☉ before the QSO shines (see Fig. 10 in Romano et al., 2002), while in case B we can form stars very rapidly even in larger haloes (see Granato et al., 2004).
Both cases consider a single-zone galaxy and a double power-law IMF, i.e. MM-0.4 for M M☉ and MM-1.25 for 1 M M M☉ (in a notation where the Salpeter index would be 1.35). We also used for both cases the chemical yields adopted by Chiappini et al. (2003, their model 7). This yield set was chosen because it proved to give the best agreement with CNO osbervations for the Milky Way, the M101 spiral galaxy, DLAs and dwarf irregular galaxies.

For case A we simulated a halo of mass M M☉ (model 1d in Romano et al., 2002). We followed the evolution of gas abundances from the beginning of star formation to the shining of the QSO at time-steps of 0.1 Gyrs and for different virialization redshifts. The model predictions reported in Fig. 10 reproduce the correlation [N/C] vs. [C/H] and the -enhancement, but the relation between [Si/C] and [C/H] is almost flat.
The predictions for case B (see Granato et al., 2004) refer to the chemical evolution of two DM haloes of masses M and M☉ corresponding roughly to the absolute magnitudes and in the hypothesis that the QSOs are shining at the Eddington luminosity and applying eq. 6 by Ferrarese (2002):
| (4) |
We explored virialization redshifts at time intervals of and 1 Gyr from the QSO emission redhifts in our sample. As shown in Fig. 10, the predictions cover the range of [C/H] where most of the observations lie. They reproduce both the observed correlation between [N/C] and [C/H] and the anticorrelation in [Si/C] vs. [C/H].
The differences between the predictions of case A and B are small. They are mostly due to the higher SFR that can be attained in case B before the QSO shining, due to the clumping factor that shortens the cooling time of the gas. It should be noticed also that this is a single-zone model, i.e. the results are averaged over the whole physical dimension of the galaxy, while a metallicity gradient is observed in elliptical galaxies.
In conclusion, the high level of chemical enrichment and the -enhancement observed in the QSO environments indicates that the massive elliptical galaxies hosting QSOs must have formed the bulk of their stellar population on short time-scales at high redshifts.
7 Alternative measurements of chemical abundances in the vicinity of QSOs
Our results are in general agreement with QSO chemical abundances determined with other methods.
Broad emission lines (BELs) observed in QSO spectra are the most commonly used diagnostics to this purpose (see e.g. Davidson & Netzer, 1979; Hamann & Ferland, 1999). BELs are known to originate in photoionised gas within pc of the central continuum source. It has become the norm in BEL studies to take the N/O abundance ratio as a tracer of O/H, that is of . The prominent metal lines, such as C iv , relative to Ly- are not sensitive to the overall metallicity for (Hamann & Ferland, 1999). On the other hand, observations in H ii regions indicate that the N/O O/H relation is valid for metallicities above to solar (Shields, 1976; Pagel & Edmunds, 1981; van Zee, Salzer & Haynes, 1998; Izotov & Thuan, 1999; Pettini et al., 2002). This abundance behaviour is attributed to “secondary” N production, whereby N is synthesized from existing C and O via CNO burning in stars.
Calculations of BEL metallicities in large samples of QSOs spanning the redshift range found typically solar or supersolar metallicities across the entire redshift range and no evidence of a decrease at the highest redshifts (Hamann & Ferland, 1993; Hamann et al., 2002; Warner et al., 2002; Dietrich et al., 2003a; Warner, Hamann & Dietrich, 2003). Precise estimates are difficult because metallicities derived from the N v lines (most notably N v/He ii) are typically % to a factor of larger than estimates from the intercombination ratios (e.g. N iii/C iii). The reason for this discrepancy is not clear and also the absolute uncertainties are not easily quantified because they depend on the assumed theoretical models.
The determination of the relative abundance of iron versus -elements, which is taken as an indicator of the time elapsed from the beginning of the last star formation episode, relies for QSO BELs on the ratio Fe ii(UV)/Mg ii , where “Fe ii(UV)” indicates a broad blend of many Fe ii lines between roughly 2000 and 3000 Å which is very hard to measure. The tentative measurements carried out at low and intermediate redshifts indicate Fe/Mg a factor of above solar (Wills et al., 1985) suggesting that SN Ia already contributed to the gas enrichment. Recently, new measurements of the Fe ii/Mg ii ratio were obtained for high and very high () redshift QSOs showing no clear evolution with time (Freudling, Corbin & Korista, 2003; Dietrich et al., 2003b). However the consequences of these results on the early star formation history will be clearer only when the theoretical relationship between the observed Fe ii/Mg ii emission ratio and the Fe/Mg abundance will be assessed (Verner et al., 1999, 2003; Sigut & Pradhan, 2003).
Also “broad” absorption lines (BALs) have been used to investigate the chemical and physical properties of the gas associated with QSOs. Indeed, BALs are believed to arise in material ejected by the QSO but still located very close to the central regions. The drawback in the use of these systems is that broad profiles blend together all the important doublets and do not allow a reliable estimate of the column densities, in particular in the case of partial coverage of the source. However, the numerous studies on BALs indicate metallicities near or above the solar value (e.g. Korista et al., 1996; Hamann, 1998; Arav et al., 2001; Srianand & Petitjean, 2001; Gupta et al., 2003).
8 Conclusions
Up to now the main approach to study the chemical abundances in QSO environments has been the analysis of BELs observed in their spectra. Metallicities determined from BELs are consistent with solar or slightly supersolar values without a significant evolution in redshift. Other elemental abundances are very difficult to measure, in particular determinations of the ratio /Fe are very uncertain.
Associated narrow absorptions are complementary probes of the physical status of QSO-elliptical systems with respect to BELs. In general, they can be due to gas belonging to the interstellar medium of the galaxy, outflowing under the effect of the QSO or re-infalling on the QSO itself. Furthermore, it is more straightforward to derive chemical abundances from absorption lines than from emission lines. We need only to determine and apply the proper ionisation corrections to convert the measured ionic column densities into relative abundances.
In this paper, we selected six narrow absorption systems lying within 5000 km s-1 from a QSO emission redshift and determined the abundances of C, N and -elements in the gas they originate from. We used high resolution, high signal-to-noise UVES QSO spectra and applied a procedure based on the photoionisation code Cloudy to compute the chemical abundances starting from the measured column densities.
We found that all systems but one in our sample have metallicities (measured by carbon) consistent with or larger than solar. We found also a possible correlation of [N/C] and an anticorrelation of [Si/C] with [C/H] with supersolar values of [Si/C]. These results are suggestive of rapid enrichment due to a short star formation burst, of duration 1 Gyr (see Section 5). Since the very high luminosity QSOs in our sample should have , assuming (McLure & Dunlop, 2002) we expect SFR yr-1 in their hosts.
The predictions of the model of chemical evolution for a spheroidal galaxy where the star formation depends on stellar and QSO feedback are in good agreement with the observations. In particular, the agreement improves when taking into account a clumping factor (Granato et al., 2004), which allows the gas to be efficiently converted into stars also in very massive dark haloes with SFR yr-1.
In this way, narrow associated QSO absorption systems proved to be extremely useful in the study of the QSO environment, in particular when there is evidence of their intrinsicness. They can be used as estimators of the chemical abundances in high redshift spheroidal galaxies which are not easily determined otherwise. The probed gas will probably be ejected from the galaxy due to the QSO feedback, thus we are also observing a potential source of enrichment of the intergalactic medium at high redshift.
In order to obtain a deeper insight in the evolution of QSO host-galaxies and environments it is essential to enlarge the data sample. In particular, obtaining high signal-to-noise spectra in the UV to reliably measure the doubly-ionised lines of C and N and increasing the redshift range especially at large values. Indeed, the five AALs analised up to now (Savaglio et al., 1997) seems to indicate a slightly lower average metallicity, [C/H] , than for the bulk of the sample at redshift . More data will be fundamental to verify the observed correlations and to constrain the predictions of theoretical models.
Acknowledgements
We are grateful to the referee for her comments and suggestions which greatly improved this paper. V.D. would like to thank MIUR/COFIN for financial support. This research was partially funded by ASI contracts I/R/35/00, I/R/088/02. Part of the work was supported by the European Community Research and Training Network “Physics of the Intergalactic Medium”. We thank the ESO support astronomers who have performed some of the observations in service mode.
References
- Aracil et al. (2004) Aracil B., Petitjean P., Pichon C., Bergeron J., 2004, A&A accepted, astro-ph/0307506
- Arav et al. (2001) Arav N., 2001, ApJ, 561, 118
- Archibald et al. (2002) Archibald E. N., Dunlop J. S., Jimenez R., et al., 2002, MNRAS, 336, 353
- Ballester et al. (2000) Ballester P., Modigliani A., Boitquin O., et al., 2000, ESO The Messenger, 101, 31
- Baugh, Cole & Frenk (1996) Baugh C. M., Cole S., Frenk C. S., 1996, MNRAS, 283, 1361
- Bergeron, et al (1994) Bergeron J., Petitjean P., Sargent W. L. W., et al., 1994, ApJ, 436, 33
- Bergeson & Lawler (1993) Bergeson S. D., Lawler J. E., 1993, 414, L137
- Bernardi et al. (1998) Bernardi M., Renzini A., da Costa L. N., et al., 1998 ApJ, 508, L143
- Brotherton et al. (2001) Brotherton M. S., Tran Hien D., Becker R. H., et al., 2001, ApJ, 546, 775
- Carretta et al. (2000) Carretta E., Gratton R. G., Sneden C., 2000, A&A, 356, 238
- Chiappini et al. (2003) Chiappini C., Romano D., Matteucci F., 2003, MNRAS, 339, 63
- Cristiani & Vio (1990) Cristiani S., Vio R., 1990, A&A, 227, 385
- Davidson & Netzer (1979) Davidson K., Netzer H., 1979, Rev. Mod. Physics, 51, 715
- Dietrich et al. (2003a) Dietrich M., Hamann F., Shields J. C., et al., 2003, ApJ, 589, 722
- Dietrich et al. (2003b) Dietrich M., Hamann F., Appenzeller I., Vestergaard M., 2003, ApJ, 596, 817
- D’Odorico & Petitjean (2001) D’Odorico V., Petitjean P., 2001, A&A, 370, 729
- D’Odorico et al. (2002) D’Odorico V., Petitjean P., Cristiani S., 2002, A&A, 390, 13
- Dunlop et al. (2003) Dunlop J. S., McLure R. J., Kukula M. J., et al., 2003, MNRAS, 340, 1095
- Ellis et al. (1997) Ellis R. S., Smail I., Dressler A., et al., 1997, ApJ, 483, 582
- Ferland (2003) Ferland G., 2003, ARA&A, 41, 517
- Ferrarese (2002) Ferrarese L., 2002, ApJ, 578, 90
- Fitzpatrick & Spitzer (1997) Fitzpatrick E. L., Spitzer L. Jr., 1997, ApJ, 475, 623
- Fontana & Ballester (1995) Fontana A., Ballester P., 1995, ESO The Messenger, 80, 37
- Franceschini & Gratton (1997) Franceschini A., Gratton R., 1997, MNRAS, 286, 235
- Freudling, Corbin & Korista (2003) Freudling W., Corbin M. R., Korista K. T., 2003, ApJ, 587, L67
- Granato et al. (2001) Granato G. L., Silva L., Monaco P., et al., 2001, MNRAS, 324, 757
- Granato et al. (2004) Granato G. L., De Zotti G., Silva L., Bressan A., Danese L., 2004, ApJ, 600, 580
- Griesmann & Kling (2000) Griesmann U., Kling R., 2000, ApJ, 536, L113
- Gupta et al. (2003) Gupta N., Srianand R., Petitjean P., Ledoux C., 2003, A&A, 406, 65
- Hamann (1998) Hamann F., 1998, ApJ, 500, 798
- Hamann & Ferland (1993) Hamann F., Ferland G., 1993, ApJ, 418, 11
- Hamann & Ferland (1999) Hamann F., Ferland G., 1999, ARA&A, 37, 487
- Hamann et al. (1997) Hamann F. W., Barlow T. A., Junkkarinen V., Burbidge E. M., 1997, ApJ, 478, 80
- Hamann et al. (2001) Hamann F. W., Barlow T. A., Chaffee F. C., Foltz C. B., Weymann R. J., 2001, ApJ, 550, 142
- Hamann et al. (2002) Hamann F. W., Korista K. T., Ferland G. J., Warner C., Baldwin J., 2002, ApJ, 564, 592
- Holweger (2001) Holweger H., 2001, in proc. of the Joint SOHO/ACE workshop ”Solar and Galactic Composition”. Edited by R. F. Wimmer-Schweingruber, American Institute of Physics Conference proceedings vol. 598, p.23
- Izotov & Thuan (1999) Izotov Y. I., Thuan T. X., 1999, ApJ, 511, 639
- Kauffmann & Charlot (1998) Kauffmann G., Charlot S., 1998, MNRAS, 294, 705
- Kauffmann & Haehnelt (2000) Kauffmann G., Haehnelt M., 2000, MNRAS, 311, 576
- Kim et al. (2001) Kim T-S., Cristiani S., D’Odorico, S., 2001, A&A, 373, 757
- Köhler et al. (1999) Köhler S., Reimers D., Tytler D., et al., 1999, A&A, 342, 395
- Korista et al. (1996) Korista K., Hamann F., Ferguson J., Ferland G., 1996, ApJ, 1996, 641
- Kormendy & Gebhardt (2001) Kormendy J., Gebhardt K., 2001, in 20th Texas Symposium on relativistic astrophysics, ed. J.C.Wheeler, & H. Martel (AIP Conf. Proc. 586; Melville: AIP), 363
- Matteucci (1994) Matteucci F., 1994, A&A, 288, 57
- McLure & Dunlop (2002) McLure R.J., Dunlop J.S., 2002, MNRAS, 331, 795
- Menci et al. (2003) Menci N., Cavaliere A., Fontana A., et al., 2003, ApJ accepted, astro-ph/0311496
- Møller et al. (1994) Møller P., Jakobsen P., Perryman M. A. C., 1994, A&A, 287, 719
- Monaco et al. (2000) Monaco P., Salucci P., Danese L., 2000, MNRAS, 311, 279
- Morton (1991) Morton D. C., 1991, ApJS, 77, 119
- Pagel & Edmunds (1981) Pagel B. E. J., Edmunds M. G., 1981, ARA&A, 19, 77
- Petitjean & Srianand (1999) Petitjean P., Srianand R., 1999, A&A, 345, 73
- Petitjean et al. (1994) Petitjean P., Rauch M., Carswell R. F., 1994, A&A, 291, 29
- Pettini et al. (1999) Pettini M., Ellison S. L., Steidel C. C., Bowen D. V., 1999, ApJ, 510, 576
- Pettini et al. (2002) Pettini M., Ellison S. L., Bergeron J., Petitjean P., 2002, A&A, 391, 21
- Pickering et al. (2000) Pickering J. C., Thorne A. P., Murray J. E., et al., 2000, MNRAS, 319, 163
- Pickering et al. (2002) Pickering J. C., Donnelly M. P., Nilsson H., Hibbert A., Johansson S., 2002, A&A, 396, 715
- Prochaska & Burles (1999) Prochaska J. X., Burles S. M., 1999, ApJ, 117, 1957
- Prochaska & Wolfe (2002) Prochaska J. X., Wolfe A., 2002, ApJ, 566, 68
- Reichard et al. (2003) Reichard T. A., et al., 2003, AJ, 125, 1711
- Romano et al. (2002) Romano D., Silva L., Matteucci F., Danese L., 2002,MNRAS, 334, 444
- Savaglio et al. (1997) Savaglio S., Cristiani S., D’Odorico S., et al., 1997, A&A, 318, 347
- Schaye (2001) Schaye J., 2001, ApJ, 559, 507
- Shaver & Robertson (1983) Shaver P. A., Robertson J. G., 1983, ApJ, 268, L57
- Shields (1976) Shields G. A., 1976, ApJ, 204, 330
- Sigut & Pradhan (2003) Sigut T. A. A., Pradhan A. K., 2003, ApJS, 145, 15
- Spitzer & Fitzpatrick (1993) Spitzer L. Jr., Fitzpatrick E. L., 1993, ApJ, 409, 299
- Srianand & Petitjean (2000) Srianand R., Petitjean P., 2000, A&A, 357, 414
- Srianand & Petitjean (2001) Srianand R., Petitjean P., 2001, A&A, 373, 816
- Stanford et al. (1998) Stanford S. A., Eisenhardt P. R., Dickinson M., 1998, ApJ,492, 461
- Timmes et al. (1995) Timmes F. X., Woosley S. E., Weaver T. A., 1995, ApJS, 98, 617
- Tripp, Lu & Savage (1997) Tripp T. M., Lu L., Savage B. D., 1997, ApJS, 112, 1
- van den Hoek & Groenewegen (1997) van den Hoek L. B., Groenewegen M. A. T., 1997, A&AS, 123, 305
- van Zee, Salzer & Haynes (1998) van Zee L., Salzer J. J., Haynes M. P., 1998, ApJ, 497, L1
- Verner et al. (1999) Verner E. M., Verner D. A., Korista K. T., et al., 1999, ApJS, 120, 101
- Verner et al. (2003) Verner E., Bruhweiler F., Verner D. Johansson S., Gull T., 2003, ApJ, 592, L59
- Volonteri, Haardt & Madau (2003) Volonteri M., Haardt F., Madau P., 2003, ApJ, 582, 559
- Wampler et al. (1993) Wampler E. J., Bergeron J., Petitjean P., 1993, A&A, 273, 15
- Wang & Biermann (1998) Wang Y., Biermann P. L., 1998, A&A, 334, 87
- Warner et al. (2002) Warner C., Hamann F., Shields J. C., et al., 2002, ApJ, 567, 68
- Warner, Hamann & Dietrich (2003) Warner C., Hamann F., Dietrich M., 2003, ApJ, 596, 72
- Weymann et al. (1991) Weymann R. J., Morris S. L., Foltz C. B., Hewett P. C., 1991, ApJ, 373, 23
- Wills et al. (1985) Wills B. J., Netzer H., Wills D., 1985, ApJ, 288, 94
- Woosley & Weaver (1995) Woosley S. E., Weaver T. A., 1995, ApJS, 101, 181
- Worthey, Faber & González (1992) Worthey G., Faber S. M., González J. J., 1992, ApJ, 398, 69
![[Uncaptioned image]](/html/astro-ph/0402043/assets/x11.png)