A Hard X-ray survey of the Galactic Center with INTEGRAL/IBIS. Catalog of sources
Abstract
During the period Aug.23-Sept.24 2003, the INTEGRAL observatory performed an ultra deep survey of the Galactic Center region with a record sensitivity at energies higher than 20 keV. We have analized images of the Galactic Center region obtained with the ISGRI detector of the IBIS telescope (15-200 keV) and present here a catalog of detected sources. In total, 60 sources with a flux higher than 1.5 mCrab have been detected. 44 of them were earlier identified as Galactic binary systems, 3 are extragalactic objects. 2 new sources are discovered.
INTRODUCTION
Bright Galactic X-ray sources, most of which are binary systems with an accreting black hole or a neutron star, strongly concentrate towards the Galactic plane and especially towards the Galactic Center. Therefore, imaging instruments are very important in studying the X-ray emission from these objects. For some time in the past, X-ray images of the sky were obtained from scanning observations with detectors having collimator-limited fields of view (e.g. UHURU, Forman et al. 1978, HEAO1, Wood et al. 1984). The advent of X-ray telescopes using the grazing reflection technique (e.g. EINSTEIN, ROSAT, CHANDRA, XMM) dramatically increased the resolution of X-ray images. However, neither of these telescopes can produce images at energies higher than 10 keV.
Focusing hard X-ray photons with energies above 30 keV is very difficult. Therefore, telescopes used for image reconstruction in this energy range employ another method – coded mask aperture (see e.g. Fenimore, Cannon 1978; Skinner et al. 1987a). A number of telescopes built on this principle have obtained very interesting results, in particular for the Galactic Center region, e.g. Spacelab/XRT (Skinner et al. 1987b), MIR/KVANT/TTM(Sunyaev et al. 1990), GRANAT/ART-P(Pavlinsky et al. 1992, 1994), GRANAT/SIGMA(Cordier et al. 1991, Sunyaev et al. 1991), BeppoSAX/WFC (Ubertini et al. 1999)
The last survey of the Galactic Center region at energies above 40 keV was completed by the SIGMA telescope aboard the GRANAT observatory more than 5 years ago. More than 5 million sec were spent on observations of this region, which made it possible to achieve a sensitivity of 5 mCrab in the energy band 40-150 keV (e.g. Churazov et al. 1994). Now with the IBIS telescope of the INTEGRAL observatory we have the possibility to carry out a new hard X-ray survey of the Galactic Center at a much higher sensitivity in the energy band 20-150 keV.
In this article we present an analysis of data obtained with INTEGRAL/IBIS during an ultra deep survey of the Galactic Center region that was performed by the INTEGRAL observatory in August-September 2003. The total exposure time of the utilized observations is approximately 2 million sec. We analize images of the region and present a catalog of detected sources. More detailed analysis of the X-ray emission of the detected sources will be presented in future papers.
INSTRUMENT AND DATA ANALYSIS
The INTEGRAL observatory (Winkler et al. 2003) was launched by a Russian rocket-launcher PROTON Oct.17 2002 (Eismont et al. 2003). There are four telescopes on board the observatory. In the present work, we will only use data from the detector ISGRI of the telescope IBIS (Ubertini et al. 2003). This instrument provides the best combination of field of view, sensitivity and angular resolution for our study. The lower detector of the telescope IBIS - PICsIT has an effective energy range starting at 170 keV and is therefore less sensitive to typical X-ray sources.
The coded-mask telescope IBIS has a field of view of (the fully coded field of view is ) and makes it possible to construct images with an angular resolution of . The detector ISGRI mounted on this telescope consists of 16384 independent pixels of the CdTe semiconductor. A detailed description of the detector can be found in (Lebrun et al. 2003).
All the available data were processed in a uniform way. For each Science Window, the event energies were calculated following the prescription implemented in OSA 3.0 (Goldwurm et al. 2003) using the gain and rise time correction tables versions 9 and 7 respectively. Events, accumulated in raw detector coordinates, were screened for possible hot or dead pixels, which resulted in a rejection of a few percent of the pixels. The raw detector images in the 18-60 keV band (which provides the best sensitivity for typical X-ray sources) were then rebinned into a new grid having a pixel size equal to of the mask pixel size. This causes inevitable (although modest) loss of spatial resolution, but has an advantage of straightforward application of standard coded masks reconstruction algorithms such as DLD deconvolution (e.g. Fenimor, Cannon 1981, Skinner et al. 1987a). The ”balanced” DLD deconvolution was then applied to detector images. A balance matrix was calculated to compensate the spatially nonuniform background across the detector. The background used for balance matrix calculations was accumulated over a large set of observations so the contribution of individual sources to the background is completely smeared. An iterative source removal procedure was used to eliminate ghosts of sources due to incomplete coding. The resulting DLD images were then coadded to form a combined map. The map was finally convolved with a Gaussian having a width approximatelly matching the width of the real PSF, which is somewhat broader then the ideal DLD PSF due to the detector rebinning and co-adding multiple images with different orientations.
The same procedure was applied to a big set of Crab Nebula observations, thus allowing direct check of the applied method and comparison of detected fluxes with standard ”Crab” units. We have concluded from this analysis that the current software allows recovering absolute source fluxes with 10 % uncertainty. The accuracy of bright source localization is approximately 0.4′ (1 confidence contour). For weaker sources this error radius can increase to 2-3′.
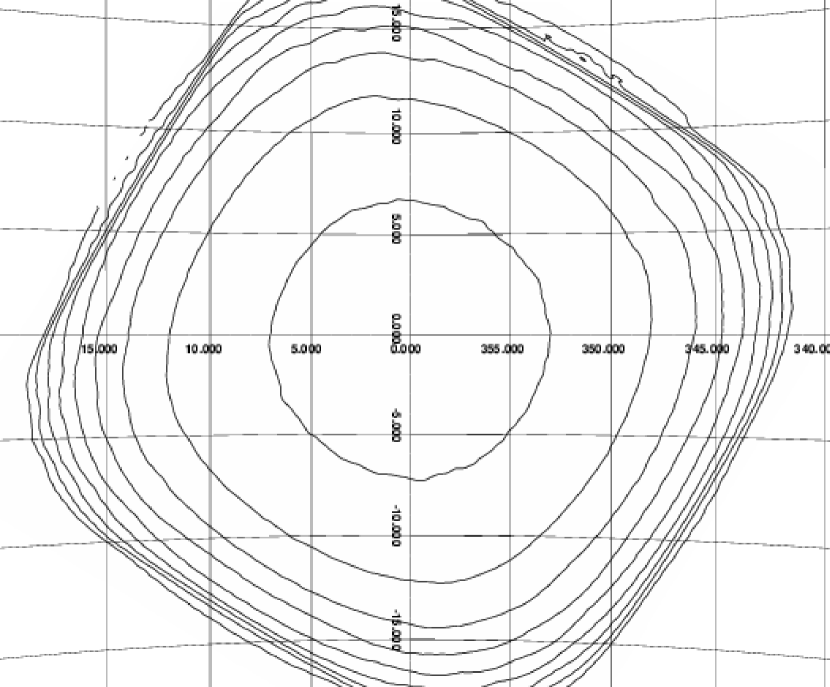
The average image of the Galactic Center region was searched for sources. A peak on the image with an intensity higher than a specified limit was regarded as indicating the presence of a point source. We adopted a 6.5 detection limit, which is slightly higher than allowed by the statistics. This allows us to avoid dealing with systematic uncertainties that arise in analyzing images of such crowded regions as the Galactic Center with the present software. The sensitivity map derived with the adopted detection limit is presented in Fig.1.
RESULTS
A list of detected sources, their coordinates and fluxes in the 18-60 keV energy band are presented in Table 1. A flux of 1 mCrab in this energy band corresponds to ergs/s/cm2 for sources with a Crab-like spectrum. The accuracy of source localization is approximately 2–3′ (90% confidence contour).
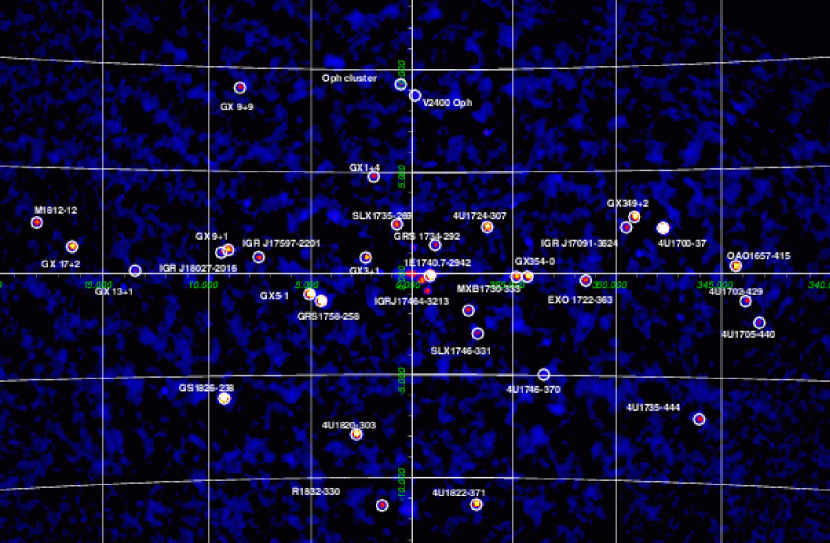
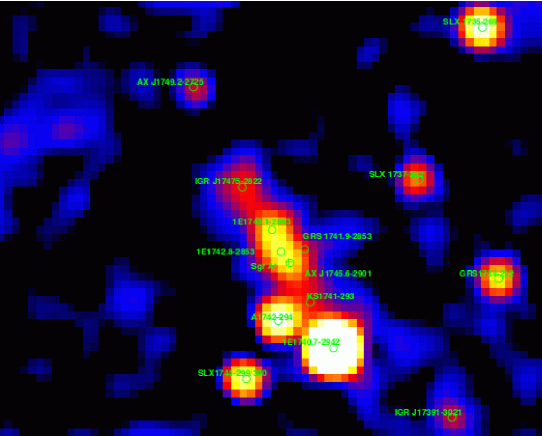
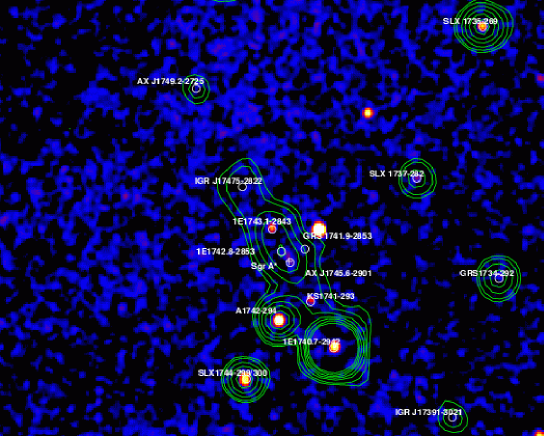
An image of the Galactic Center region (size ) is presented in Fig.1. In order to avoid too many subscripts on the image, we labeled only part of the detected sources. Zoomed images of the Galactic Center ( size) obtained from INTEGRAL/IBIS/ISGRI (18-60 keV) and MIR/KVANT/TTM(2-20 keV) data are presented in Fig. 3. The location of the dynamical center of the Galaxy (the supermassive black hole Sgr A∗) is shown by a cross. Because of the limited angular resolution of the IBIS and TTM telescopes we cannot determine the flux of the Sgr A∗ itself (for more details see Baganoff et al. 2003, Belanger et al. 2003).
By analyzing the averaged 18-60 keV image of the Galactic Center region with a typical sensitivity of 1-2 mCrab we have detected 60 sources. The nature of 50 of them is known, most of them (37 of 50) being low mass X-ray binaries (LMXB). A significant fraction of these binary systems are bursters (i.e. binary systems with neutron stars, episodically demonstrating unstable thermonuclear burning – bursts – on the surface of the neutron star). However, bright neutron star systems that do not demonstrate such bursting behavior (GX5-1, GX9+1, GX9+9, GX13+1, GX340+0) are also present in the field.
Also detected are an anomalous X-ray pulsar – 1RXS J170849.0-40091 and 4 binary X-ray pulsars – OAO1657-415, AXJ1749.2-2725, EXO1722-363 and GX1+4. Except for the last one, these sources are high mass X-ray binary systems (HMXB).
Two detected sources (V1223 Sgr and V2400 Oph) are cataclysmic variables (CV), one (Oph cluster=4U1708-23) is a cluster of galaxies, one (GRS 1734-292) is an active galactic nucleus, one (PKS 1830-211) is a lensed blazar (), and one (SGR 1806-20) is a soft gamma repeater.
Among the known binary systems, only four (1E1740.7-2942, GRS 1758-258, SLX 1746-331 and IGR J17464-3213/H1743-31) harbor black hole candidates (BH).
Five sources from Table 1 were discovered by INTEGRAL, three of them during these observations (IGR J17544-2619, IGR J18027-2016, IGR J17475-2822). 111 IGR J17475-2822 is located only 0.7∘ from the Galactic Center and can be a superposition of weaker sources. Observations with higher angular resolution are needed IGR J17544-2619 is a transient source, which was detectable only during part of our observations (Sunyaev et al. 2003, Grebenev et al. 2003), it cannot be detected on the averaged map of the region.
Therefore, only 10 of the 60 sources detected in the Galactic Center region are of unknown origin. Four of them have positions coincident with sources previously discovered by the ROSAT observatory.
Work was partly supported by a grant of Minpromnauka (grant of president of Russian Federation NSH-2083.2003.2) and the programm of the Russian Academy of Sciences ’Non-stable phenomena in astronomy”. Authors thank the International Science Data Center of INTEGRAL (Versoix, Swiss) and Russian Science Data Center of INTEGRAL (Moscow, Russia). The work is based on observations with INTEGRAL, an ESA project with instruments and science data centre funded by ESA member states (especially the PI countries: Denmark, France, Germany, Italy, Switzerland, Spain), Czech Republic and Poland, and with the participation of Russia and the USA.
REFERENCES
Baganoff F., Maeda Y., Morris M. et al.// Astroph.J. 591, 891 (2003)
Belanger G., Goldwurm A., Goldoni P. et al.// astro-ph/0311147 (2003)
Churazov E., Gilfanov M., Sunyaev R. et al. // Astroph.J.Suppl.92, 381 (1994)
Cordier B., Goldwurm A., Laurent P. et al.// Adv.Sp.Res. 11, 169 (1991)
Eismont N.A., Ditrikh A.V., Janin G. et al.// Astron. Astroph. 411, 37 (2003)
Fenimore E. E., Cannon T. M.// Appl.Opt. 17, 337 (1978)
Fenimore E. E., Cannon T. M.// Appl.Opt. 20, 1858 (1981)
Forman W., Jones C., Cominsky L. et al. // Astroph.J.Suppl. 38, 357 (1978)
Goldwurm A., David P., Foschini L. et al.// Astron. Astroph. 411, 223 (2003)
Grebenev S., Lutovinov A., Sunyaev R.// Astronomer’s Telegram 192 (2003)
Lebrun F., Leray J. P., Lavocat P. et al.// Astron. Astroph. 411, 141 (2003)
Pavlinsky M., Grebenev S., Sunyaev R.// Sv.AL 18, 291 (1992)
Pavlinsky M., Grebenev S., Sunyaev R. // Astroph.J. 425, 110 (1994)
Skinner G. K., Ponman T. J., Hammersley A. P., Eyles, C. J.// Astroph. and Space Science 136, 337 (1987a)
Skinner G. K., Willmore, A. P., Eyles C. J., Bertram D., Church M. J.// Nature 330, 544 (1987b)
Sunyaev R. A., Churazov E., Efremov V., Gilfanov M., Grebenev S.// Adv.Sp.Res. 10, 41 (1990)
Sunyaev R., Churazov E., Gilfanov M. et al.// Astron. Astroph. 247, 29 (1991)
Sunyaev R., Grebenev S., Lutovinov A. et al.// Astronomer’s Telegram 190 (2003)
Ubertini P., Bazzano A., Cocchi M. et al.// Astroph.Lett.Comm. 38, 301 (1999)
Ubertini P., Lebrun F., Di Cocco G. et al.// Astron. Astroph. 411, 131 (2003)
Winkler C., Courvoisier T. J.-L., Di Cocco G. et al.// Astron. Astroph. 411, 1 (2003)
Wood K.S., Meekins J.F., Yentis D.J. et al.// Astroph.J.Suppl. 56, 507 (1984)
| (2000) | (2000) | Flux (18-60 keV), mCrab a | Identification | Class | ||
|---|---|---|---|---|---|---|
| 1 | 255.978 | -37.841 | 662.5 | 4U1700-377 | HMXB, NS | |
| 2 | 265.977 | -29.746 | 491.8 | 1E1740.7-2942 | LMXB, BH | |
| 3 | 270.308 | -25.748 | 478.2 | GRS 1758-258 | LMXB, BH | |
| 4 | 277.370 | -23.805 | 392.4 | GS1826-238 | LMXB, NS | |
| 5 | 270.289 | -25.080 | 259.0 | GX5-1 | LMXB, NS | |
| 6 | 275.917 | -30.367 | 169.4 | 4U1820-303 | LMXB, NS | |
| 7 | 256.424 | -36.416 | 160.5 | GX349+2 | LMXB, NS | |
| 8 | 261.887 | -30.804 | 151.6 | 4U1724-307 (Ter 2) | LMXB, NS | |
| 9 | 262.981 | -33.831 | 135.8 | GX354-0 | LMXB, NS | |
| 10 | 255.187 | -41.658 | 126.6 | OAO1657-415 | HMXB, NS | |
| 11 | 276.438 | -37.113 | 117.6 | 4U1822-371 | LMXB, NS | |
| 12 | 263.354 | -33.381 | 88.4 | RAPID BURSTER | LMXB, NS | |
| 13 | 266.991 | -26.566 | 81.7 | GX3+1 | LMXB, NS | |
| 14 | 270.387 | -20.523 | 77.2 | GX9+1 | LMXB, NS | |
| 15 | 266.519 | -29.514 | 69.3 | A1742-294 | LMXB, NS | |
| 16 | 264.560 | -26.993 | 64.4 | SLX 1735-269 | LMXB, NS | |
| 17 | 274.014 | -14.037 | 63.1 | GX17+2 | LMXB, NS | |
| 18 | 266.834 | -30.010 | 50.0 | SLX1744-299/300 | LMXB, NS | |
| 19 | 261.286 | -36.280 | 48.4 | EXO 1722-363 | HMXB?, NS | |
| 20 | 269.958 | -22.019 | 46.6 | IGR/XTE J17597-2201 | LMXB, NS | |
| 21 | 266.543 | -32.235 | 45.8 | IGR J17464-3213/H1743-322 | XB,BH? | |
| 22 | 264.729 | -44.438 | 43.9 | 4U1735-444 | LMXB,NS | |
| 23 | 278.921 | -32.995 | 43.7 | R1832-330 (NGC 6652) | LMXB, NS | |
| 24 | 256.540 | -43.043 | 43.6 | 4U1702-429 | LMXB, NS | |
| 25 | 266.491 | -28.923 | 41.0 | 1E1742.8-2853 | LMXB | |
| 26 | 257.290 | -36.394 | 39.4 | IGR J17091-3624 | ? | |
| 27 | 266.404 | -29.018 | 37.9 | AX J1745.6-2901 | LMXB | |
| 28 | 266.580 | -28.735 | 37.3 | 1E1743.1-2843 | LMXB | |
| 29 | 264.364 | -29.137 | 35.0 | GRS1734-292 | AGN | |
| 30 | 263.003 | -24.747 | 34.3 | GX1+4 | LMXB, NS | |
| 31 | 267.466 | -33.192 | 33.8 | SLX 1746-331 | LMXB? | |
| 32 | 262.905 | -16.991 | 31.7 | GX9+9 | LMXB, NS | |
| 33 | 257.210 | -44.089 | 25.9 | 4U1705-440 | LMXB, NS | |
| 34 | 270.690 | -20.272 | 23.0 | IGR J18027-2016(new) | ? | |
| 35 | 273.630 | -17.149 | 22.8 | GX13+1 | LMXB, NS | |
| 36 | 265.152 | -28.303 | 22.4 | SLX 1737-282 | LMXB | |
| 37 | 273.780 | -12.103 | 20.6 | M1812-12 | LMXB, NS | |
| 38 | 258.140 | -23.334 | 20.1 | Oph cluster | Cluster | |
| 39 | 267.511 | -37.061 | 18.1 | 4U1746-370 (NGC 6441) | LMXB, NS | |
| 40 | 257.528 | -28.162 | 18.1 | XTEJ1710-281 | LMXB | |
| 41 | 258.159 | -24.232 | 15.8 | V2400 Oph | CV | |
| 42 | 266.261 | -28.902 | 15.4 | GRS 1741.9-2853 | LMXB, NS | |
| 43 | 266.868 | -28.370 | 14.8 | IGR J17475-2822(new*) | ? | |
| 44 | 261.317 | -32.976 | 14.8 | 1RXS J172525.5-325717 | ? | |
| 45 | 266.205 | -29.352 | 14.1 | KS1741-293 | LMXB, NS | |
| 46 | 274.652 | -17.040 | 13.6 | SAX J1818.6-1703 | LMXB? | |
| 47 | 264.802 | -30.329 | 13.1 | IGR/XTE J17391-3021 | HMXB? | |
| 48 | 272.148 | -20.446 | 12.8 | SGR 1806-20 | SGR | |
| 49 | 267.335 | -27.511 | 12.7 | AX J1749.2-2725 | HMXB, NS | |
| 50 | 267.828 | -20.174 | 12.2 | 1RXS J175113.3-201214 | ? | |
| 51 | 257.294 | -32.302 | 12.1 | 4U1705-32 | ? | |
| 52 | 258.073 | -37.652 | 12.0 | SAX J1712.6-3739 | LMXB, NS | |
| 53 | 278.379 | -21.084 | 10.8 | PKS 1830-211 | Blazar | |
| 54 | 260.027 | -31.288 | 9.2 | 1RXS J172006.1-311702 | ? | |
| 55 | 265.745 | -36.345 | 9.0 | XTE J1743-363 | ? | |
| 56 | 251.452 | -45.609 | 9.0 | GX340+0 | LMXB, NS | |
| 57 | 283.722 | -31.133 | 8.8 | V1223 Sgr | CV | |
| 58 | 266.590 | -21.543 | 7.0 | 1RXS J174607.8-213333 | ? | |
| 59 | 257.245 | -40.111 | 6.5 | 1RXS J170849.0-40091 | AXP, NS | |
| 60b | 268.585 | -26.335 | 30.0 | IGR J17544-2619 | ? |
-
a – here are quoted only statistical errors. Systematic uncertainties (10%) are not included
-
b – this source was detected only during part of the observations. We quote maximum detection significance and maximum source flux