On the Center Shifts of Raman Scattered He II and H Wings in Symbiotic Stars
Abstract
Using a Monte Carlo technique, we investigate the center shifts that are expected to occur for the broad H wings and the He II 6545 feature as a function of the neutral hydrogen column density in symbiotic stars. These two features are proposed to be formed via Raman scattering of UV continuum around Ly and He II 1025 emission line by neutral hydrogen. The strengths of these two features are determined by a combination of various physical parameters including the covering factor and the neutral hydrogen column density of the scattering region. The branching ratio of Raman scattering to Rayleigh scattering for UV radiation around Ly is a non-linearly increasing function of the wavelength, which results in enhanced Raman optical fluxes redward of the H line center as increases. However, we find that the amount of wing center shift is quite small about as increases from to . Assuming that He II 1025 emission is characterized by a Gaussian profile, the Raman scattered He II 6545 feature exhibits near Gaussian profiles with the peak shifted redward for . The redward center shift amounts to for and decreases as increases up to , above which no center shift is observed. The redward peak shift is due to the fact that the incident emission profile is symmetric with respect to He II 1025 line center whereas the Raman conversion rate is increasing towards the line center of Ly. We emphasize that the determination of by locating the exact peak position of the He II 6545 feature will lift the degeneracy to allow a more accurate estimate of the covering factor of the neutral region, providing strong constraints on the mass loss process occurring in symbiotic stars.
keywords:
scattering — radiative transfer — binaries: symbiotic — mass-loss — circumstellar matter1 Introduction
Symbiotic stars are generally believed to be binary systems of a mass losing giant and a hot star, which is usually a white dwarf (Kenyon 1986). The giant component loses a large amount of mass in the form of a slow stellar wind, a significant fraction of which may be ionized by the strong UV radiation emanating from the hot component (e.g. Taylor & Seaquist 1984). The physical extent of the ionized region should be sensitively dependent on the strength of the ionizing radiation and the mass loss rate of the giant component. In this respect, studies of ionization structures of symbiotic stars are very important in understanding the mass loss process in symbiotic stars (e.g. Skopal 2003).
Symbiotic stars exhibit very unique spectroscopic features, which are Raman scattered lines by neutral hydrogen. The emission features around 6825 Å and 7082 Å appearing in more than half of the symbiotic stars are Raman scattered O VI 1032, 1038 doublets first identified by Schmid (1989). The Raman scattering origin for these features is strongly supported by many spectropolarimetric observations (e.g. Schmid & Schild 1994, Schmid et al. 2000, Harries & Howarth 1996) and contemporaneous far UV observations (e.g. Espey et al. 1995, Birriel, Espey, Schulte-Ladbeck 1998, 2000). The Raman scattering cross sections for O VI 1032,1038 are of order . Therefore, the existence of these features implies that a non-negligible fraction of the scattering region is characterized by a very high H I column densities .
Van Groningen (1993) found other Raman scattered features including Raman scattered He II lines in the symbiotic star RR Telescopii. In particular, Raman scattered He II line at around 4850 Å was found in the spectrum of the young planetary nebula NGC 7027 by Péquignot(1997). Because a He II ion has the same atomic structure with four times large level spacings as a hydrogen atom does, the emission lines associated with the energy levels with even principal quantum numbers of He II have a slightly shorter wavelengths than those of H I emission lines. This implies that the Raman scattering cross sections for these He II lines are so high that the scattering processes can operate in broader range of objects including young planetary nebulae (Nussbaumer, Schmid & Vogel 1989).
In the same line of reasoning, UV continuum radiation around Ly will be Raman scattered to be redistributed around H, forming broad wings. In this case, the wing profiles reflect the wavelength dependence of the scattering cross section, which is approximately inversely proportional to the squared wavelength difference of the incident radiation and the Ly line center. These broad H wings with profiles well-fitted by a profile were found in objects including many symbiotic stars (Lee 2000), some young planetary nebulae such as IC 4997 (Lee & Hyung 2000) and M2-9 (Balick 1989), and post AGB stars (van de Steene, Wood, & van Hoof 2000). Recently Arrieta & Torres-Peimbert (2003) added 12 more objects that are also in late stages of stellar evolution. Considerable mass loss is a common feature for all of these objects, where one can find a large amount of neutral matter surrounding the central hot stars. It is also interesting that a large fraction of these objects exhibit bipolar nebular morphology (e.g. Schwarz & Monteiro 2003, Schwarz & Corradi 1992).
Lee et al. (2003) used the 3.6 m Canada-France-Hawaii telescope to perform spectroscopy of the symbiotic star V1016 Cygni. They found the Raman scattered He II 6545 that is converted from He II 1025 emission line. They adopted a simple scattering geometry to compute the broad H wing template profiles and isolate the 6545 feature, from which they were able to put a lower limit of the mass loss rate of the Mira variable. However, the strengths of Raman scattered features are determined by a combination of the covering factor and neutral hydrogen column density () of the scattering region for given incident UV radiation. The degeneracy of the two factors should be lifted in order to put more stringent constraints on the mass loss processes occurring in symbiotic stars.
There exists conspicuous asymmetry in the branching ratio of Raman scattering relative to Rayleigh scattering around Ly, where the branching ratio is an increasing function of the incident wavelength (Yoo, Bak, & Lee 2002). Therefore, continuum radiation redward of Ly will be more easily Raman scattered than continuum blueward of Ly. This tendency increases for higher scattering optical depths, which may lead to a redward shift of the center location of H wings as increases. Furthermore, the Raman conversion rate increases in the wavelength region, where He II 1025 is located. Therefore, if He II 1025 exhibits a symmetric emission profile with the peak at its line center, the peak position of the Raman scattered He II 6545 will move toward H, where the amount of shift will be mainly determined by the neutral hydrogen column density.
In this paper, we perform Monte Carlo simulations to compute the center shifts of the H wings and the Raman scattered He II 6545 features for various , which may be useful in lifting the degeneracy of the column density and the covering factor that determine the strengths of the Raman scattered features. In the following section we briefly describe the basic ideas of the center shifts. The numerical results from our Monte Carlo calculations are presented in Section 3. Finally in Section 4 we discuss our results and observational ramifications.
2 Models and Monte Carlo Procedures
In a symbiotic star, the gravity of the white dwarf significantly affects the stellar wind flow from the giant, as is shown by the SPH computations by Mastrodemos & Morris (1998). However, it will still hold that the matter density will decrease as the distance from the giant center increases. As a first approximation, the ionization structure was investigated by Taylor & Seaquist (1984), assuming that the circumstellar distribution is radial. With this assumption, the ionized region will take a conical shape, which is determined by the relative strength of H ionizing UV radiation and the mass loss rate of the giant. They introduced a parameter defined as
| (1) |
Here, is the recombination coefficient of hydrogen in a region with electron temperature is the binary separation, is the mean molecular weight and is the relative hydrogen particle density. The Strömgren boundary is formed where the parameter exceeds the value of the function defined by
| (2) |
where the angle is the opening angle of the ionized conical region (Seaquist, Taylor & Button 1984).
The Raman scattering optical depth of unity for UV radiation corresponding to this spectral region is obtained when the neutral hydrogen column density exceeds (e.g. Nussbaumer et al. 1989, Lee 2000). Therefore, the Raman scattered He II 6545 and nearby H wings are formed in the neutral region, because the neutral column density of the ionized region does not exceed the column density , for which the Lyman limit radiation becomes optically thick. The neutral column density for a given line of sight starting from the UV emission region through the neutral scattering region will be inversely proportional to the impact parameter with respect to the giant. Therefore, the determination of may put a strong constraint on the mass loss rate of the giant component in a symbiotic star.
In this paper, we are mainly concerned with the Raman scattered He II 6545 feature and broad H wings found in symbiotic stars. We adopt a view that the broad H wings are formed through Raman scattering of continuum around Ly, as is proposed by Nussbaumer et al. (1989). The relative strength of Raman scattered He II 6545 feature with respect to that of H wings are determined basically by the equivalent width of He II 1025 and the scattering optical depth.
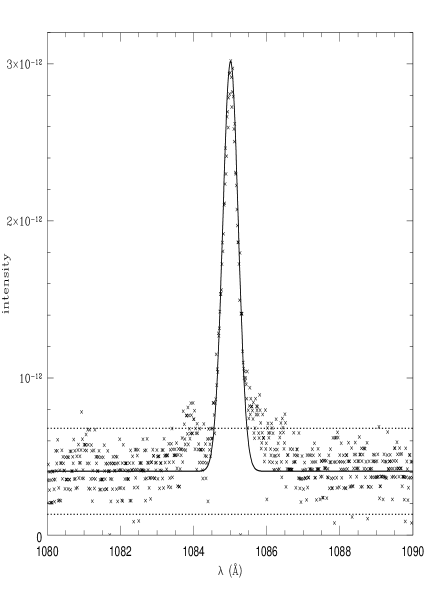
Schmid et al. (1999) studied O VI 1032, 1038 lines using ORFEUS (Orbiting and Retrievable Far and Extreme Ultraviolet Spectrometers). In Fig. 1, we show a spectrum around He II 1085 of the symbiotic star RR Telescopii obtained with the ORFEUS, in order to obtain a hint of He II 1025 which suffers heavy interstellar extinction due to closeness to H I Ly. It is well fitted by a single Gaussian , where and . In order to estimate the equivalent width of He II 1085, we fit the continuum and the He II 1025 emission line by a solid line in the figure, from which the continuum flux density is chosen to be . By dotted lines we show the continuum levels higher and lower by . We obtain the equivalent width , and put a lower bound from this measurement. Using the Case B recombination theory we may infer the equivalent width of He 1025 with the additional assumption that the continuum level does not change much. In the current work, we adopt a value , which appears to fit to the spectrum of V1016 Cyg obtained by Lee et al. (2003).
When the scattering optical depth is small, the Raman conversion efficiency will be approximately proportional to the cross section that is again approximately given by (e.g. Lee & Lee 1997, Lee & Hyung 2000). Therefore, the peak position of the Raman feature is determined by the location of the maximum of the function
| (3) |
where and are the center wavelengths of He II 1025 and Ly, respectively. Here, is the width of the single Gaussian for incident He II 1025 emission line, which was chosen in this work. Here, we define , and and are masses of an electron and a proton, respectively. In this work, we choose and . In Fig. 2, we show the Raman scattering cross section and the He II 1025 emission line given by a single Gaussian with .

By performing a simple differentiation, we find
| (4) |
where is the wavelength around , at which the Raman scattered He II will exhibit the peak. In the limit , the peak of Raman conversion rate is found at
| (5) |
for our assumed value . It is interesting to note that the amount of peak shift is proportional to the squared width of the incident radiation with a Gaussian profile. This shift is translated into the redward shift of Raman scattered He II 6545 feature by an amount
| (6) |
which is quite significant and should be easily observable.
As the scattering optical depth increases, a significant fraction of Raman scattered photons are formed after a few Rayleigh scatterings, resulting in a constant Raman conversion rate, under the assumption of the absence of absorbing opacities such as dust and little opacity near H (e.g. Schmid 1996, Lee & Lee 1997). In this highly optically thick limit, no shift in peak position will be seen. This implies that the redward shift of Raman scattered feature He II 6545 decreases as the neutral hydrogen column density increases, rendering the amount of redward shift a useful indicator of . The multiple scattering effects are difficult to handle analytically, and we adopt a Monte Carlo approach to obtain the quantitative relation between the peak shift and .
Monte Carlo techniques have been applied usefully to understand basic properties of Rayleigh and Raman scattered radiation and interpret various spectroscopic and polarimetric observational data (e.g. Schmid 1995, 1996). In this work, we use the Monte Carlo code developed by Yoo, Bak & Lee (2002), in which they adopted the branching ratio of Raman and Rayleigh scattering cross sections around Ly given by
| (7) |
This situation is illustrated in Fig. 1 of Yoo et al. (2002), where the branching ratio was represented by a dotted line. Although it is highly unrealistic to characterize the scattering region by a single value of , we adopt the scattering regions in this way in order to find the amount of center shift dependent on .
The Raman scattering branching ratio increases as the wavelength increases fairly steeply according to Yoo et al. (2002). For higher column densities the Raman wings will extend to broader range of wavelengths, where the difference in the branching ratios redward and blueward of the line center will increase significantly, strengthening the red wing part selectively. This effect may lead to the redward shift of the H wing center as increases.
3 Results
3.1 Center Shift of H Wings

In Fig. 3, we show H wings produced by our Monte Carlo code for Raman scattering of continuum radiation around Ly for various neutral hydrogen column densities in order to determine the wing center. The vertical axis represents the Raman conversion rate, which is the ratio of the number of incident UV photons to that converted into optical ones. As is explained by Lee & Hyung (2000), when the medium becomes optically thick, the conversion rate saturates to a constant value near 0.6.
A least square method was adopted to locate the wing center. Using the fact that the far wing parts are fairly well approximated by profiles , by varying we obtained a profile that best fits each Monte Carlo result for those parts with the conversion rate less than 0.5. For illustrative purpose, one such fit for is shown in Fig. 3 by a long-dashed line. Even though profiles provide overall satisfactory fits to simulated H profiles, it should be noted that small deviations are also apparent especially near H center.

In Fig. 4, we plot the center locations as a function of . The result shows the redward wing shift of H wings as increases. However, the center shift amounts to only for a change of from to . Furthermore, the exact center location is ambiguous as is shown by the considerable scatter in Fig. 4, which is mainly due to the statistical nature of our Monte Carlo calculations. From this simulation, we may conclude that the center shift of H wings in this range of does not have much observational significance.
3.2 Raman Scattered He II 6545
Assuming a similar nebula condition discussed in Section 2, we prepare He II 1025 line as an input spectrum represented by a single Gaussian with a width of shown in Fig. 2. As is discussed later, this choice explains fairly well the spectrum around H of the symbiotic star V1016 Cyg obtained with the 3.6 m Canada-France-Hawaii Telescope in 2002 (e.g. Lee et al. 2003). First, we investigate the Raman scattered He II 6545 feature without any contribution from the UV continuum.

In Fig. 5, we show the profiles of the Raman scattered He II from a scattering region with neutral hydrogen column densities , and . In order to clarify the shift of the peak position, by long dashed lines we show the single Gaussian line profile of the Raman scattered He II 6545, which would appear in the case where the Raman conversion rate is constant. The Monte Carlo results are shown by solid lines. In this figure, we immediately see that the center location moves redward or toward H. The result for is quite noisy due to low photon statistics.

A least square method was applied to the Monte Carlo results in order to obtain the fits and locate the peak positions of the Raman scattered features. We note that all the Raman features are fitted satisfactorily by a Gaussian function with a width .
In Fig. 6, we plot the amount of center shift as a function of . For a column density the peak position shift amounts to , which is quite significant and similar to the value discussed in the previous section. The amount of center shift decreases as increases in the region , and no center shift is seen for . At this high column density, the Raman conversion rate for He II 1025 saturates to a constant value , which explains no shift of the peak position. The decrease of the peak shift as indicates the decrease of the slope of the Raman conversion rate as a function of the scattering optical depth, which approaches zero in the optically thick limit.
For lower column densities, the peak shifts are quite large exceeding . This implies that in an optically thin limit, the Raman conversion rate is not given by a simple relation that is proportional to . It appears that more redward peak shift in low column densities may be explained by introducing a parameter so that the Raman conversion rate is described in terms of this parameter by
| (8) |
where the peak location coincides with one of the roots of the derivative . The introduction of a new parameter may be justified by the following argument. In an optically thin scattering region characterized by the total scattering optical depth and the Raman branching ratio , the Raman conversion efficiency including multiple scattering effects may be approximated by an infinite geometric series
| (9) | |||||
Since we approximately have , this leads to a result in the functional form . With the assumption of an optically thin medium, it follows that .
By differentiating and defining , we obtain a cubic equation in , which is
| (10) |
Upon investigating the roots of the cubic equation for various values of , we find that when , the peak shift can be as large as found for in our Monte Carlo calculation.
In the cases of optically thick scattering regions, the Raman conversion rate depends on in a non-linear way, which gives rise to the various amount of the peak shift for . In turn, the nonlinearity is attributed to the multiple Rayleigh scattering effect before Raman conversion takes place.

In Fig. 7, we show combined spectra of UV continuum and He II 1025 for various . The strengths of both the H wings and the He II 6545 feature vary as the column density of the scattering region mainly due to the difference in scattering cross section. However, the observed strength is directly proportional to the covering factor of the scattering region, and hence these two factors are degenerate. If we fix the covering factor and geometrical shape of the scattering region, the Raman conversion efficiency is determined by the scattering optical depth in a non-linear way. Therefore, with the unknown covering factor of the scattering region, these simulated profiles should be multiplied by a constant factor to fit an observed spectrum.

In Fig. 8, we show the spectrum of the symbiotic star V1016 Cyg obtained with the 3.6 m Canada-France-Hawaii Telescope (see Lee et al. 2003 for observation details). We overplot the simulated H wings and He II 6545 features for various column densities onto this spectrum. It appears that the simulated profiles with in the range considered in this figure provide good fits to the observed spectrum blueward of the [N II] 6548 line. Therefore, in order to determine , it is necessary to locate the exact peak position, which can be done only after a very careful de-blending of [N II] 6548.
From the fact that He II 6545 feature is observed outside the region where the Raman conversion rate is saturated and constant, the scattering region should be characterized by . Noting that Raman scattered O VI 6825 and 7082 features are formed in a region with , the scattering region responsible for He II 6545 should include the O VI scattering region and be much more extended.
4 Discussion and Observational Ramifications
4.1 Electron Scattering Wings

Electron scattering of H line photons is one of physical mechanisms that have been proposed to be the origin of the broad H wings in many celestial objects including active galactic nuclei and Wolf-Rayet stars (e.g. Mathis 1970, Weymann 1970, Hillier 1991). We generated electron scattering wings using a similar Monte Carlo technique, which is shown in Fig. 9.
Because the H emission line is well-approximated by a single Gaussian , we used this Gaussian as an incident radiation. The temperature of the electron cloud is chosen to be . The covering factor of the electron scattering region is assumed to be and the electron column density , for which the Thomson optical depth . It is also noted that similar profiles will be obtained by a choice of and with their product fixed as far as the electron plasma is optically thin.
In the top panel, we show the electron scattering wing produced by a Monte Carlo technique, which is represented by a thin solid line. According to Weymann (1970), electron scattering wings formed in an optically thin region may be approximated by exponential profiles represented by a thick solid line with a functional form
| (11) |
Here, the profile width coincides with the Doppler width corresponding to the thermal electron velocity with , from which the electron temperature is strongly constrained. The apparent discrepancy with the theoretical profile is attributed to our choice of rather high and the fact that the incident H emission profile is not a Dirac delta function but a Gaussian with a finite width.
In the middle and bottom panels, the Monte Carlo results are represented by dotted lines and the solid lines show the CFHT spectrum of V1016 Cyg. The fit is quite satisfactory. However, the Raman scattering origin of H wings naturally explains the existence of the He II 1025 feature. A more stringent constraint may be put from careful analyses of the broad H wings and He II 4850 feature, because Raman scattering cross sections and branching ratios differ from those corresponding to features around H. Future spectroscopic observations covering both H and H regions simultaneously may shed much light on this point.
4.2 Observational Ramifications
An interesting possibility is that if the He II emission is not isotropic but the continuum is, then the equivalent width of He II 1025 measured by a hypothetical observer located in the neutral scattering region does not have to be equal to that measured by an observer on Earth. According to Mastrodemos & Morris (1998), some fraction of the stellar wind from the giant component may be captured by the white dwarf component in symbiotic stars to form an accretion disk. If we accept this picture, the line emission region may take a disk-like shape, where more line radiation is expected to the normal direction of the orbital plane or the accretion disk. Using the ORFEUS data, Schmid et al. (1999) pointed out that O VI 1032, 1038 doublets exhibit different profiles from those of their Raman scattered counterparts, which appears to support this picture. In this case, for an observer with a large inclination to the orbital plane, the equivalent width that is estimated from the Raman scattered He II 6545 will be smaller than that estimated from the far UV spectroscopy performed for the same object.
In the work of Lee et al. (2003), the neutral column density was assumed to be the value that gives a unit scattering optical depth, of which the validity has not been pursued in a rigorous way. Therefore, if this choice of is lower than the true value, then the covering factor of the scattering region should be larger than they estimated, and vice versa. However, in order to locate the peak position very accurately, we have to subtract [N II] 6548 feature reliably using the 3 times stronger [N II] 6584, which requires very careful data reductions. [N II] lines are weak or absent in the higher nebular density S-type systems, for which case the line center of the Raman scattered He II 6545 can potentially be determined without this complication. As is shown by this study, an accurate value of the mass loss rate of the giant can be obtained by a more realistic model equipped with a range of with independent information about the equivalent width of He II 1025.
It is particularly notable that the continuum photon number flux is diluted by a factor of due to the incoherency of the Raman scattering process. Because the equivalent width is a measure of the line photon number flux normalized by the continuum photon number flux, the computation of the equivalent width of the He II 1025 presented by Lee et al. (2003) is erroneous and overestimated by a factor of 6.4. The correct equivalent width should be about 0.51 Å which is similar to the value adopted in the current work.
It is very interesting to note that the asymmetric branching ratio of the Raman scattering cross section gives rise to asymmetric wing profiles with the stronger red part around H. Regarding this, spectropolarimetric studies of Raman scattered O VI 6825 and 7082 features by Harries & Howarth (1996) show the flip of polarization direction occurring in the far red part, implying the existence of a third emission (or scattering) component moving away from the main scattering region (or emission region). Therefore, when examining this kind of component that is moving away, the effect from the asymmetry of atomic physics should be corrected first. More spectropolarimetry will be very useful to investigate the existence of similar phenomenon in H wings.
Less scattering cross sections and more branching possibilities may lead to more diverse features in Raman scattered lines around H and higher Balmer series lines. Therefore, simultaneous spectroscopy for the Raman scattered features around H and higher Balmer series lines will shed more light on the mass loss processes and the ionization structures of symbiotic stars. Similar center shift phenomena are expected to Raman scattered He II features formed blueward of higher Balmer series lines. Because center shifts are also sensitive to relative kinematics between the UV emission source region and the scattering region, careful data analyses will be required. We conclude that Raman features provide very important and interesting diagnostic tools for investigating the mass loss processes and ionization structures in symbiotic stars.
Acknowledgments
We are very grateful to an anonymous referee for providing helpful and constructive suggestiongs that improve the presentation of this paper. This work is a result of research activities of the Astrophysical Research Center for the Structure and Evolution of the Cosmos (ARCSEC) funded by the Korea Science and Engineering Foundation.
References
- [Arrieta & Torres-Peimbert 2003] Arrieta, A. & Torres-Peimbert, S., 2003, ApJS, 147, 97
- [Balick 1989] Balick, B., 1989, AJ, 97, 476
- [Birriel et al. 1998] Birriel, J., Espey, B. R., & Schulte-Ladbeck, R. E., 1998, ApJ, 507, 75
- [Birriel et al. 2000] Birriel, J., Espey, B. R., & Schulte-Ladbeck, R. E., 2000, ApJ, 545, 1020
- [Espey et al. 1995] Espey, B. R., Schulte-Ladbeck, R. E., Kriss, G. A., Hamann, F., Schmid, H. M., Johnson, J. J., 1995, ApJ, 454, L61
- [Harries and Howarth 1996] Harries, T. J., & Howarth, I. D. 1996, A&AS, 119, 61
- [Hillier 1991] Hillier, D. J., 1991, A&A, 247, 455
- [Kenyon, 1986] Kenyon, S. J., 1986, The Symbiotic Stars (Cambridge: Cambridge Univ. Press)
- [Lee 2003] Lee, H. -W. 2003, ApJ, 594, 637
- [Lee 2000] Lee, H. -W. 2000, ApJ, 541, L25
- [Lee & Hyung 2000] Lee, H.-W., & Hyung, S., 2000, ApJ, 530, L49
- [Lee & Lee 1997] Lee, H.-W., & Lee, K. W. 1997, MNRAS, 287, 211
- [Lee et al. 2003] Lee, H.-W., Sohn, Y.-J., Kang, Y. W., & Kim, H.-I., 2003, ApJ, 598, 553
- [Mastrodemos & Morris 1998] Mastrodemos, N. & Morris, M., 1998, ApJ, 497, 303
- [Mathis 1970] Mathis, J. S., ApJ, 162, 761
- [Nussbaumer, Schmid, & Vogel 1989] Nussbaumer, H., Schmid, H. M.& Vogel, M.,1989,A&A, 221, L27
- [Péquignot et al. 1997] Péquignot, D., Baluteau, J.-P., Morisset, C., Boisson, C., 1997, A&A, 323, 217
- [Seaquist et al. 1984] Seaquist, E. R., Taylor, A. R., & Button, S., 1984, 284, 202
- [Skopal 2003] Skopal, A, 2003, Recent. Res. Devel. Astronomy & Astrophys., 1, 111-135, Research Signpost, Kerela
- [Schmid 1989] Schmid, H. M. 1989,A&A, 211, L31
- [Schmid 1995] Schmid, H. M. 1995, MNRAS, 275, 227
- [Schmid 1996] Schmid, H. M. 1996, MNRAS, 282, 511
- [Schmid & Schild 1994] Schmid, H. M. & Schild, H., 1994, A&A, 281, 145
- [Schmid et al. 1999] Schmid, H. M. et al., 1999, A&A, 348, 950
- [Schmid et al. 2000] Schmid, H. M., Corradi, R., Krautter, J., Schild, H., 2000, A&A, 355, 261
- [Schwarz & Corradi 1992] Schwarz, H. E. & Corradi, R. L. M., 1992, A&A, 265, L37
- [Schwarz & Monteiro 2003] Schwarz, H. E. & Monteiro, H., 2003, Rev. Mex. Astron. Astrofis., 15, 23
- [Taylor & Seaquist 1984] Taylor, A. R. & Seaquist, E. R., 1984, ApJ, 286, 263
- [Van de Steene et al. 2000] Van de Steene, G. C., Wood, P. R., & van Hoof, P. A. M. 2000, in Asymmetrical Planetary Nebulae II: From Origins to Microstructures, ed. J. H. Kastner, N. Soker, & S. Rappaport (San Francisco: ASP Conference Series, Vol. 199), p. 191
- [van Groningen 1993] Van Groningen, E., 1993, MNRAS, 264, 975
- [Weyman 1970] Weymann, R., 1970, ApJ, 160, 31
- [Yoo, Bak, & Lee 2002] Yoo, J. J., Bak, J.-Y., & Lee H. -W., 2002, MNRAS, 336, 467