The Globular Cluster Systems of the Sculptor Group
Abstract
We use CTIO 4-m Mosaic II images taken with the Washington and Harris filters to identify candidate globular clusters in the six major galaxies of the Sculptor group: NGC 45, NGC 55, NGC 247, NGC 254, NGC 300, and NGC 7793. From follow-up spectroscopy with Hydra-CTIO, we find 19 new globular clusters in NGC 55, NGC 247, NGC 253, and NGC 300, bringing the total number of known Sculptor group globular clusters to 36. The newly discovered clusters have spectroscopic ages consistent with those of old Milky Way globular clusters, and the majority are metal-poor. Their luminosity function closely resembles that of the Milky Way’s globular clusters; their metallicity distribution is somewhat more metal-rich, but this may be the result of our color selection of candidates. The mean [/Fe] ratio in the clusters is , which is lower than the Milky Way average. The specific frequencies are similar to those of other late-type galaxies. However, if we calculate the specific frequency using the -band total magnitudes of the host galaxies, we find values that are more than a factor of two higher. The kinematics of the globular cluster systems are consistent with rotation with the H I disk in each of the four galaxies; however, only in NGC 253 is this result based on more than seven objects. We suggest that the Sculptor group galaxies add to evidence indicating that many of the first generation globular clusters formed in disks, not halos.
1 Introduction
Observations of extragalactic globular cluster (GC) systems suggest a variety of processes by which they may form. For example, giant elliptical galaxies may build up their GC systems in galaxy mergers through the combination of the progenitor systems (e.g. Forbes et al. 2000) and through the formation of new GCs in the merger (e.g. Schweizer et al. 1996). Galaxies such as the Milky Way and M31 likely formed many of their GCs from fragments in the halo (Searle & Zinn 1978). Parts of GC systems may also have been built through the later accretion of the GCs of dwarf galaxies (Côté et al. 1998); indeed, the Sagittarius dwarf is falling into the Galaxy and being torn apart by tidal forces (Ibata et al. 1994), in the process contributing 4 globular clusters to the halo (Da Costa & Armandroff 1995). Each of these processes may perhaps be explained through the common framework of hierarchical structure formation (e.g. Beasley et al. 2002, Santos 2003, Kravtsov & Gnedin 2003).
The prominent roles of merging and accretion in the GC formation models suggest that it is very important that we measure the properties of GCs in galaxies with lower masses, such as dwarf galaxies and late-type spirals, in a range of environments. In the Local Group, the Large Magellanic Cloud (LMC) and M33 contain the largest GC systems outside the Milky Way and M31. The LMC’s 13 old GCs appear to be as old as the Milky Way’s oldest clusters (to within 1 Gyr; Mighell et al. 1996, Olsen et al. 1998, Johnson et al. 1999), and are metal-poor (Olszewski et al., 1991; Suntzeff et al., 1992). On the basis of Monte Carlo simulations of their kinematics, (Schommer et al., 1992) argued that the LMC’s oldest clusters follow the HI disk (Schommer et al., 1992). If correct, this result implies that the disks of some galaxies were already in place by the time of GC formation, as predicted by cosmological simulations (e.g. Kravtsov & Gnedin 2003). However, van den Bergh (2004) argues that the LMC old cluster sample is insufficient to rule out halo dynamics. In M33, the 48 known old GCs reside both in a disk and in a halo (Chandar et al., 2002; Schommer et al., 1991), while the bulk have red horizontal branches, suggesting ages younger than those of Milky Way GCs (Sarajedini et al., 1998). While these results are intriguing, global conclusions about GC systems in low-mass galaxies clearly require larger observational samples.
The Sculptor group is the Local Group’s nearest neighbor; its brightest seven members have luminosities similar to that of the LMC and M33 (Côté et al., 1997). The small distances of the galaxies (2 Mpc) make it possible to study their GC systems with integrated photometry and spectroscopy from the ground, and with resolved-star photometry from space. Finding the GCs is challenging, however. The expected surface density of GCs is lower than that of background galaxies and foreground stars, and the clusters are distributed over wide fields. Discovering the GCs thus requires a combination of wide-field imaging for candidate identification and follow-up spectroscopy for confirmation. Searches in NGC 55 and NGC 253, using photographic plates for candidate detection, have turned up a number of GCs (Da Costa & Graham, 1982; Liller & Alcaino, 1983a, b; Blecha, 1986; Beasley & Sharples, 2000; Kim, Sung, & Lee, 2002). While these pioneering searches have confirmed the existence of Sculptor group GCs, their conclusions remain limited by their small samples.
In this paper, we report on the discovery of GCs identified through a new wide-field CCD imaging (using the Washington filter set) and spectroscopic survey of six galaxies in the Sculptor group, the details of which are described in §2 and §4. We employ techniques similar to those described by Beasley & Sharples (2000) to identify candidate GCs; these are described in §3. In §5, we describe our analysis of the spectral ages and metallicities, the photometric metallicities, the kinematics of the GC systems, and the Sculptor group GC luminosity function. Our data allow us to perform the first detailed comparison between the GC systems of the Sculptor group and those of the Milky Way.
2 Imaging observations and reductions
We surveyed the six Sculptor group galaxies NGC 45, NGC 55, NGC 247, NGC 253, NGC 300, and NGC 7793 with the CTIO 4-m telescope, Mosaic II camera (Muller et al., 1998), and Washington and Harris filters during the nights 11-14 Nov 1999 (Table 1). As its name implies, the Mosaic II camera tiles the focal plane with 8 SITe 2K4K CCD chips, each of which we read out through a single amplifier per chip with total readout time of 160 s. The spaces between the chips leave blank columns and rows, each 15″ wide. In order to fill in these gaps and to aid in cosmic ray removal, we typically used a 3-point dither sequence with 38″ telescope offsets between exposures. The images were taken under seeing conditions; the last two nights were photometric, while the first was affected by some thin cirrus. We set our exposure times so as to achieve S/N100 in and in and for GCs with at a distance of 2 Mpc. The exposure times listed in Table 1 were calculated based on the distances listed in Côté et al. (1997). The distances to many Sculptor group galaxies have been revised since the time of our observations (Karachentsev et al., 2003); we use these updated distances throughout the analysis in this paper.
The Mosaic II data were reduced in IRAF through the MSCRED package (Valdes 1997). The reduction steps included removal of the effects of electronic crosstalk between neighboring chips, subtraction of the line-by-line median of the overscan regions of each chip, trimming to remove extraneous pixels, subtraction of an averaged nightly bias image, and division by averaged flat field frames produced each afternoon by illuminating the white spot in the 4-m dome. For the and filters, we found it necessary to correct for the differences between these dome flats and flats produced from observations of the dark sky. Because our deep images all contain galaxies measuring 10–20′ across, we used Mosaic II images of Galactic halo fields taken by Mario Mateo and Robbie Dohm-Palmer during the nights 29 - 30 Oct 1999, and kindly provided to us by them, for the dark sky illumination corrections. These data were first processed and flat-fielded using dome flats taken during the same run. We then used DoPHOT (Schechter, Mateo, & Saha, 1993) to mask out the astronomical sources and combined the masked images through a pixel-by-pixel median operation. For the data, we median filtered the combined dark sky image with an 11 pixel-wide box before dividing it into our Sculptor group and standard star images. For the data, we found that the differences in flat-field features between the dark sky and dome-illuminated flats were too great to be adequately corrected with a median-filtered dark sky illumination frame. We thus divided the dark sky illumination frame into our data without any filtering; the images are thus effectively only flattened with a dark sky flat frame. The total counts in the dark sky flat were 5000 ADU, or 10000 electrons; the flat field accuracy for the filter should thus be 1%.
We used an observation of a field near the galaxy NGC 55 to refine the astrometric solution that is automatically written to Mosaic II image headers. The astrometric solution, which was derived by matching sources from the USNO-A2 catalog (Monet et al., 1998) to sources found in our image through the task MSCTPEAK, consisted of a fourth order polynomial in two dimensions. After applying the solution to all of our data, we found typical RMS deviations of 03 when comparing the positions of sources in our images with those from the USNO-A2 catalog.
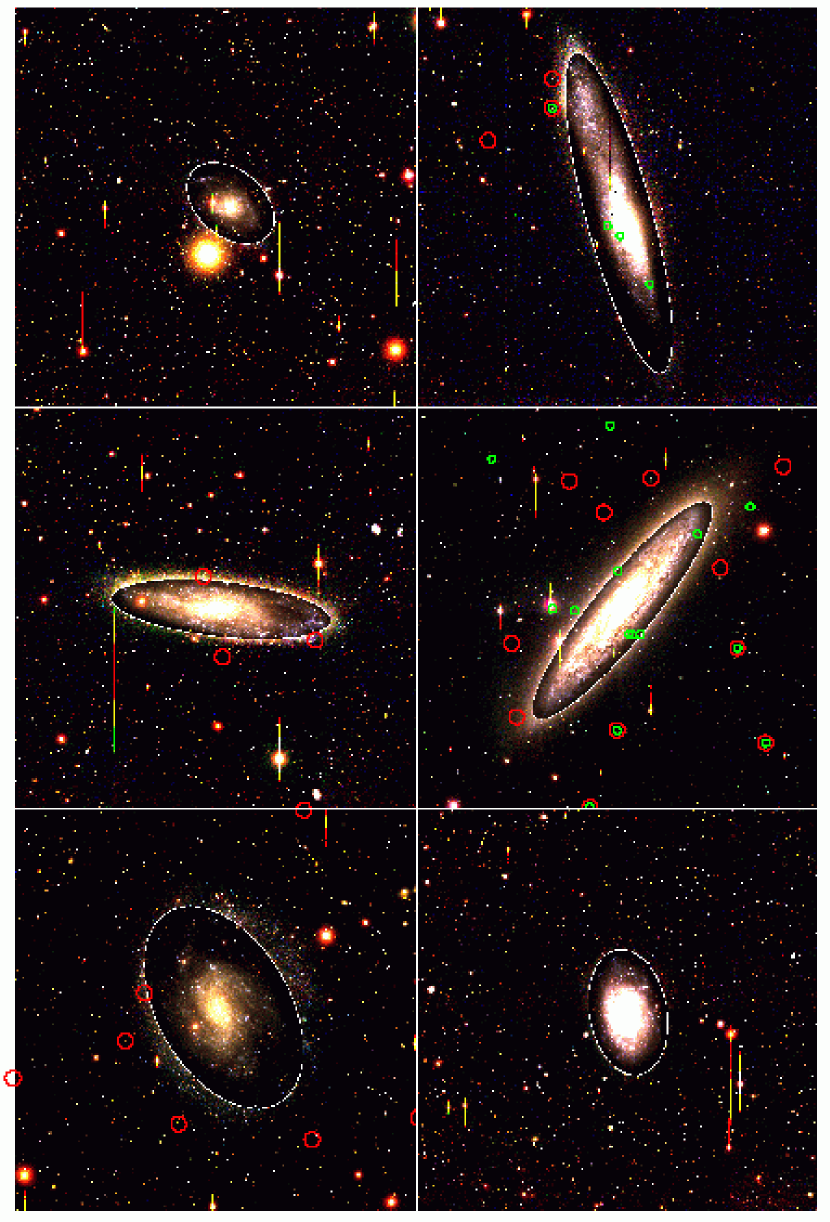
For the purpose of selecting candidate globular clusters, we produced single combined images for each Sculptor group galaxy through each filter. We first subtracted a single value of the sky background from each image, which we determined from the mode of the pixel intensity distribution taken by excluding pixels contaminated by light from the Sculptor group galaxies. We next created single-extension images from each of the multi-extension processed images using the task MSCIMAGE, which stitches together the images from individual chips using the astrometric information contained in the image headers and resamples the images to a uniform pixel scale. We then aligned the images of each galaxy and filter with the tasks MSCZERO and MSCCMATCH, scaled the individual image intensities with MSCIMATCH, and combined the images with MSCSTACK. Figure 1 shows a montage of the Sculptor group galaxy images.
For the purpose of measuring accurate photometry of objects found in the stacked images, we also worked with the individual reduced images on a chip-by-chip basis. In preparation for the single-CCD photometry, we accounted for the variation in effective pixel area produced by geometric distortion in the camera by multiplying by a pixel area image. This image was produced with the MSCRED task MSCPIXAREA; the task uses the astrometric information in the image headers to calculate the transformation of pixel areas to areas observed on the sky. Because MSCIMAGE resamples the images to a uniform pixel scale, this step was unnecessary for the production of the stacked images. Finally, we split each of the image mosaics into eight images, one for each CCD detector.
3 Photometry and selection of candidate globular clusters
The 36 field of our Mosaic II images is likely to capture the majority of Sculptor group GCs in a single snapshot of each galaxy. We selected candidate globular clusters from the deep, stacked images, using criteria based on photometry and object morphology. We conducted photometry on the combined galaxy images using the program SExtractor (Bertin & Arnouts, 1996). For object detection, we used a 33-pixel Gaussian filter with FWHM of 1.5 pixels. For all objects containing at least five pixels 5 above the local background, we measured the light from all contiguous pixels with values 5 above the background. Because the candidate GCs have a range of profiles, we used these “isophotal” magnitudes in place of fixed apertures. Profile-fitting photometry, such as done by Seth et al. (2004), would be necessary for measuring GC candidates projected against the crowded galaxy disks. However, in order to limit the number of candidates for spectroscopic followup, to mitigate against the effects of internal absorption by dust, and to simplify the photometric analysis, we chose to exclude the most heavily crowded regions from our analysis. The regions for exclusion were selected by eye (see Figure 1), and correspond roughly to the region where SExtractor failed to distinguish groups of point sources as composed of separate objects.
We calibrated the Sculptor group photometry through nightly observations of the Landolt (1992) fields that were standardized to the Washington system by Geisler (1996). The last two out of the three nights were photometric, while the first was useful but non-photometric. We typically observed a standard star field every 2 hours, with the standards usually centered on CCD #6. We observed standards over the magnitude range , the color range , and the range of airmass . Over the course of our three nights, we also observed the SA 98 field with standards placed on each of the 8 detectors in turn, so as to allow measurement of the individual zero points and color terms of each detector. We performed aperture photometry on the standard star frames using DAOPHOT (Stetson, 1987) and a sequence of apertures, the smallest having a diameter of 6″and the largest a diameter of 1575, close to the size used by Landolt (1992). We used DAOGROW to compute growth curves from the multi-aperture photometry, to select the best aperture for each star, and to extrapolate the photometry to a 30″aperture. For the 1575 aperture, the size of the extrapolation was magnitudes, while for the 6″aperture it was magnitudes. Given the total instumental magnitudes for the standard stars, we solved for the coefficients of the photometric transformation equations of the form (e.g. Stetson & Harris (1988)):
| (1) | |||
| (2) | |||
| (3) |
where is the airmass. As indicated by the third equation, we transformed our filter instrumental magnitudes to Washington standard magnitudes; as discussed by Geisler (1996), the filter is a close match to the filter, and has higher throughput. Table 2 gives the transformation coefficients for each detector.
In order to tie the SExtractor photometry to the standard system, we conducted aperture photometry of bright, uncrowded Sculptor group sources using DAOPHOT and the individual images. This photometry was perfomed in a fashion similar to that used for the standard star photometry, and is thus easily tied to the standard system. We used a single aperture with diameter 81 arcsec; the standard star photometry growth curves indicate that this aperture contains 99% of the total light from point sources. The measured magnitudes were transformed to , , and using equations 1–3, adopting the zero points and color terms calculated for each individual chip. All of the standard magnitude measurements were then averaged to produce a final magnitude for each bright Sculptor group source. We then matched these sources to objects found in the analysis of the stacked images, and applied an average zero point to the SExtractor , ,and photometry of each galaxy. Because the variations in the chip-to-chip zero points and color terms are small, we expect that the systematic error in the photometric calibration is no larger than 3–5%.
3.1 Selection of candidate globular clusters
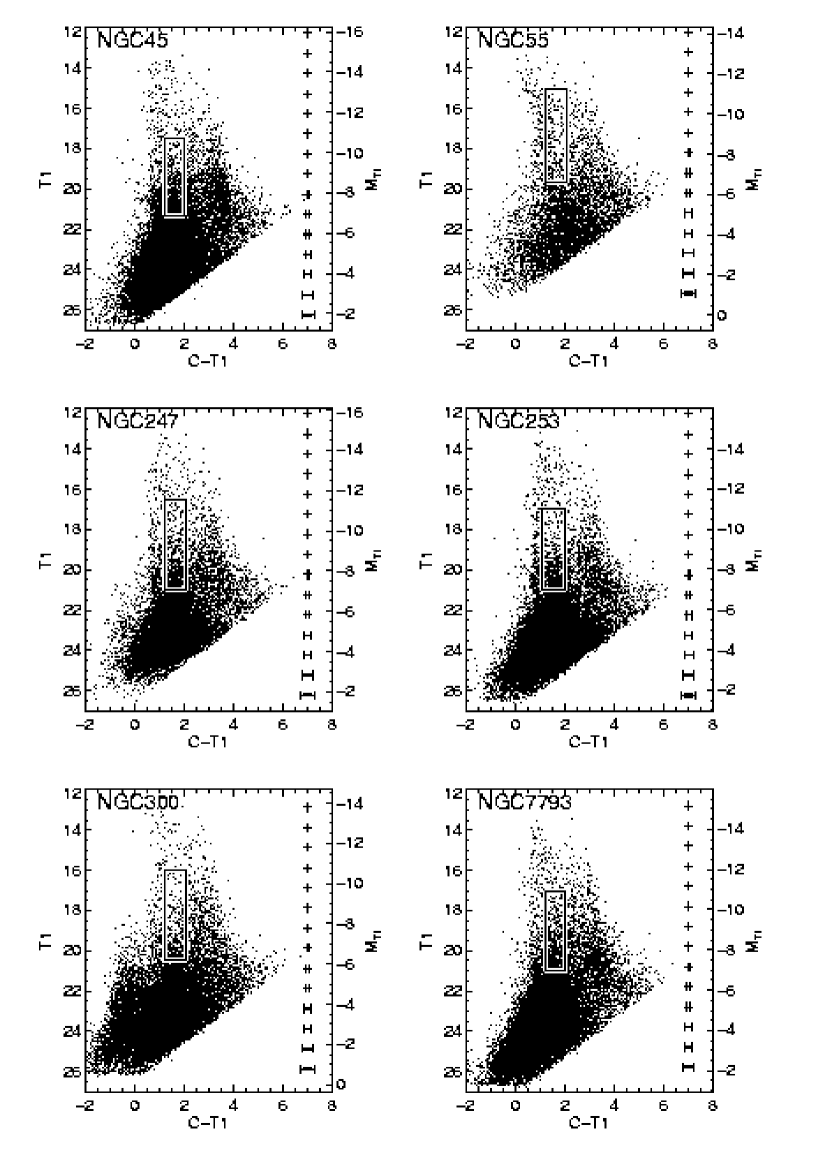
We corrected the magnitudes for reddening using the Galactic foreground measurements of Schlegel, Finkbeiner, & Davis (1998), with transformed to the Washington system following Harris & Canterna (1979); the typical towards the Sculptor group is 0.02 magnitudes. Because our candidate globular clusters all lie far outside the host galaxy disks, we expect that the effects of internal dust extinction are negligible. Using the Karachentsev et al. (2003) distances to compute from our photometry, we used the colors and magnitudes spanned by Milky Way globular clusters to help select candidates for spectroscopic followup; Milky Way globular clusters have (Geisler & Forte, 1990) and , with a peak in the GC luminosity function at (Harris, 1996). Figure 2 shows the color-magnitude diagrams of our fields, with the GC selection limits indicated. In NGC 55, NGC 247, and NGC 300, an unfortunate error in a preliminary photometric calibration resulted in the color selection limits being 0.2 magnitude redder than is desirable; nevertheless, our candidate lists are representative of the colors and magnitudes of the bulk of Milky Way GCs.
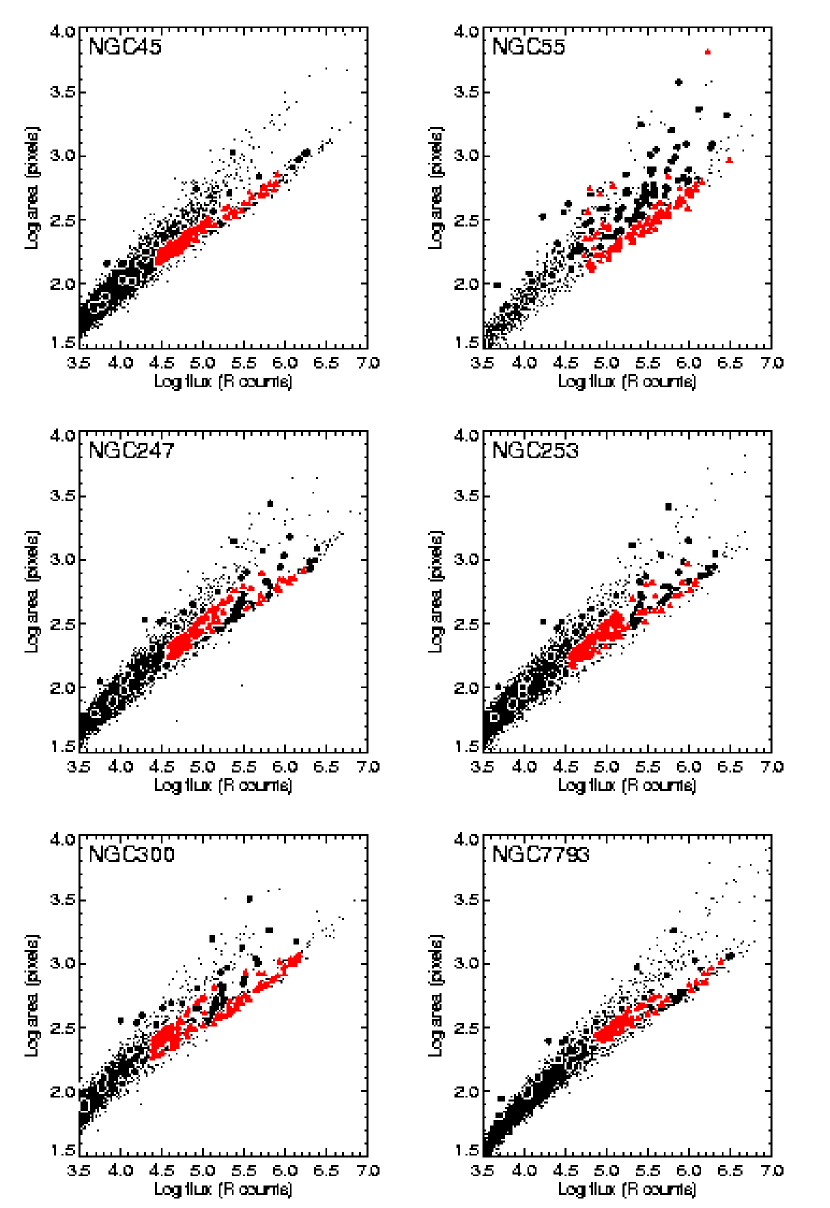
Next, we used the shapes and areas of the isophotes computed by SExtractor to make a further selection of likely globular cluster candidates. We guided our selection criteria based on 1) the properties, as measured from our images, of 10 of the 14 NGC 253 globular clusters spectroscopically identified by Beasley & Sharples (2000), and 2) the simulated appearance of Milky Way globular clusters in our images. From the known NGC 253 globular clusters, we established the rather loose criterion that globular cluster candidates should have isophotal ellipticities , where represents a circular isophote. To simulate the appearance of Milky Way globular clusters at the distances of the Sculptor group galaxies, we used DAOPHOT to measure the point-spread function (PSF) from stars found in each of our images. We then used the structural parameters from Harris (1996) to produce model King (1966) profiles for the Milky Way clusters, which we convolved with our PSFs. From the convolved profiles, we calculated the area contained within the isophote lying 5 above the background, as measured from our images. Figure 3, which is similar to Fig. 6 of Beasley & Sharples (2000), shows the isophotal areas and -band fluxes of objects found in our Sculptor group images compared with our simulated results for Milky Way clusters. In this diagram, we expect point sources to follow a tight, nearly linear sequence in (area) vs. (flux); stars with larger flux have larger area, because more of the wings of the PSF rise above the surface brightness limit. We expect background galaxies to follow a looser sequence, with larger area for a given flux than point sources. Globular clusters in the Sculptor group generally fall in between the point source and galaxy sequences, although clusters in the more nearby Sculptor group galaxies, such as NGC 55, have significant overlap with distant background galaxies in the diagram. While the most compact Milky Way globular clusters are indistinguishable from stars, many of the globular clusters would be visibly resolved. We considered all objects that obeyed the aforementioned color, magnitude, and ellipticity limits and that passed visual examination (to eliminate image artifacts and obvious background galaxies) as viable spectroscopic targets. We then used the detection of broadening to trim the candidate list to 100 objects per galaxy, which is a manageable number for followup with multi-object spectrographs. In the case of NGC 55, there were few enough candidates that we were able to include all point sources and extended objects in the approximate magnitude and color range of globular clusters in the candidate list. Table 3 lists the properties of our candidate globular clusters.
4 Spectroscopic observations and reductions
We observed GC candidates in NGC 55, NGC 247, NGC 253, and NGC 300 with the Hydra-CTIO multi-fiber spectrograph (Barden & Ingerson, 1998) during the nights 31 Oct - 3 Nov 2000 and 17 - 20 Oct 2001. The nights in 2000 were almost completely clouded out, and provided no useful data on the globular cluster candidates; they did, however, provide useful data on a number of bright Lick index (Worthey et al., 1994) standard stars. The nights in 2001 were all clear. Table 1 summarizes our spectroscopic observations.
Hydra-CTIO has 138 2.0 arcsec-diameter fibers that may be robotically positioned with high accuracy on a magnetic plate spanning a 40′-diameter circular field, providing an excellent match to the field size of Mosaic II. For the nights in 2001, we typically positioned 80 object fibers, 20 sky fibers, and 3 guide fibers per new field within 20 minutes. We used the atmospheric dispersion corrector, which compensates for the effects of differential atmospheric refraction. The fiber positioning was done on the flat surface of the magnetic plate; however, because the focal plane is curved, all observations were taken with the plate made curved by a vacuum chamber attached to the plate. Hydra-CTIO’s fibers feed a bench spectrograph located in an isolated room beneath the dome floor, a setup which allows for the stable measurement of radial velocities. The spectra taken in 2001 were imaged by a Schmidt camera with 400 mm focal length onto a SITe 2K4K CCD, which we used in its low-gain (0.84 e-/ADU), low read noise (3 e-) setting. The resolution of the camera is such that unless a slit plate is used to increase spectral resolution, the spectral profile is oversampled by a factor 2; we thus chose to bin the CCD by two pixels in the spectral direction, which reduced the effects of read noise and shorthened readout time, while preserving spectral resolution. We used the KPGL1 grating over the wavelength range 3700 – 5900Å, which provided 2Å spectral resolution. The spectra of bright Lick standard stars, taken in 2000, were imaged with a 229mm Schmidt camera and Loral 3K detector. While this camera had poorer image quality and read noise than the 400mm camera used in 2001, the grating, wavelength setting, and spectral resolution were all the same.
Calibration data taken at the telescope included bias frames, dark frames to monitor possible light leaks entering the open bench spectrograph, twilight sky frames, flat field frames taken while pointed at the illuminated dome white spot, flat field frames taken during the night while illuminating a projector screen located inside the telescope chimney, and comparison lamp exposures (using Hydra-CTIO’s He/Ne/Ar emission line sources) taken either immediately before or after an observation. We also took some exposures during the night with all fibers pointing at blank sky, to allow us to experiment with the sky subtraction procedure. During the second afternoon, we opened the dome and placed a diffusing filter in front of the row of fibers in the spectrograph; exposures taken in this configuration were relatively uniformly illuminated with light, and were used to construct a two-dimensional flat field image (“milk flat”).
Our observing routine in 2001 generally started in the afternoon with a sequence of 11 bias frames and a 10-minute dark exposure, after which we placed all of the available fibers in an 27′ diameter circle centered on the field. After pointing the telescope at the white spot in the dome and turning on the quartz lamps, we then took a sequence of three 10-minute flat field exposures, preceded and followed by a comparison lamp exposure. Next, we configured the fibers for the first Sculptor group field for that night, with the exception of the last night, when we started observations with a field in the Milky Way globular cluster 47 Tuc. Our evening twilight sky exposures were taken in these configurations, followed by projector flat and comparison lamp exposures; on the last night, we took morning twilight sky exposures in the NGC 247 configuration. We took observations of K giant radial velocity standards and spectrophotometric standards at the beginning and end of each night (again followed by projector flat and comparison lamp exposures), for which we placed a single fiber in the center of the field. The remainders of the nights we exposed on a single Sculptor group field per night, with occasional tweaking of the fiber positions to account for changes in airmass and frequent interruptions for project flat, comparison lamp, and blank sky exposures.
The data were processed in IRAF, using CCDPROC to subtract a polynomial fit to the overscan region, trim extraneous pixels from the image edges, and subtract the averaged nightly bias frame. Division of selected images by the processed milk flat image was found not to reduce the spectral noise, and so was not performed in the final reduction. Our long exposures contained a large number of cosmic rays; we used the routine L.A.Cosmic (van Dokkum 2001) to remove these from the individual object images with good results.
The spectra were extracted with the IRAF script DOHYDRA. We used the projector flats taken during the night to trace the individual fiber profiles and to set the extraction apertures, the afternoon dome flats to provide flat field vectors for each fiber, the twilight sky exposures to assign the fiber-to-fiber throughput values, and the nearest available He/Ne/Ar comparison lamp exposures to set the wavelength scales for each fiber. The trickiest aspect of the extraction procedure was the sky subtraction. We carried through the extractions using two sky subtraction options: 1) using the 20 sky fiber spectra per field, scaled to the throughput value for each fiber, we subtracted an average sky spectrum from each object spectrum, and 2) using the nearest dark sky observation, we subtracted the sky image from the on-object image before extracting the one-dimensional spectra. In practice, we found that the first option subtracted the sky as well as the second, while the second option slightly increased the random noise in the one-dimensional spectra; we thus chose to perform the sky subtraction using the sky fibers rather than the dark sky exposures. Following the extraction, we interpolated the spectra to a common linear wavelength scale. Because the continuum shapes varied from exposure to exposure with changing atmospheric conditions, we also matched all of the spectra of a given object to a single continuum before averaging them into single spectra for each object.
4.1 Radial velocities
We measured velocities for each Sculptor group object by cross-correlation (Tonry & Davis, 1979) with our spectra of stars with known radial velocities. The cross-correlation was done with the IRAF task FXCOR. First, we used FXCOR to perform continuum subtraction of the object spectra. Next, we applied a ramp filter to dampen the highest and lowest frequency Fourier components; if left unfiltered, these frequencies produced broad features that masked the narrow cross-correlation peaks. We fit the narrow cross-correlation peaks with Gaussians, which produced typical internal velocity errors per measurement of 30 km s-1 for objects with spectra similar to the templates. We cross-correlated each of the object spectra with 7 template spectra (taken over the course of our four nights) of objects with known velocities. When the measurements using each of the 7 templates were averaged, we found typical standard deviations of 7 km s-1, as expected by statistics. For a number of objects, no significant cross-correlation peak was found. Most of these objects contained emission lines at wavelengths other than the rest wavelengths of common strong lines (indicating that they are background galaxies), some had spectra that were too weak for analysis, while one had the spectrum of an HII region at the velocity of NGC 55. Table 3 summarizes the radial velocity results.
In order to assess our true velocity accuracy, we cross-correlated the spectra of the K4III star HD 223311 that were observed on different nights. From the 12 object/template combinations, we found a standard deviation of 5 km s-1. Thus, we think that a velocity error of km s-1 is an honest assessment of our true errors.
5 Results
5.1 Identifying the Sculptor group star clusters
The measured velocities easily remove contaminating background galaxies from our sample of globular cluster candidates. As a first step to identify likely foreground stars from objects in the Sculptor group, we used a combination of our measured velocities and the measured FWHM of our objects compared to the median FWHM of all point-like sources. Figure 4, which plots velocity vs. the ratio of the FWHM of the object to that of typical point sources in the images, demonstrates our technique. Because the Sculptor group lies near the South Galactic Pole, foreground stars have an average heliocentric velocity near 0 km s-1 and, as calculated for 568 stars in the direction of the Sculptor group taken from the General Catalog of mean radial velocities (Barbier-Brossat & Figon, 2000), a velocity dispersion of 40 km s-1. This is similar to the vertical velocity disperion of the thick disk, km s-1 (Gilmore, Wyse, & Kuijken 1989). The systemic velocities of NGC 55, NGC 247, NGC 253, and NGC 300, on the other hand, are in the range 125 – 245 km s-1 (Carignan & Puche, 1990; Puche, Carignan, & Bosma, 1990; Puche, Carignan, & Wainscoat, 1991a; Puche, Carignan, & van Gorkom, 1991b).
In addition, stars have profiles that vary by only 10% in their widths compared to the median PSF, as measured from the distribution of objects in Figure 4. Figure 4 contains a number of somewhat broader objects, many of which have velocities similar to the systemic velocities of the Sculptor group galaxies. We selected as likely Sculptor group star clusters those objects that either had velocities in excess of 2 of the mean foreground star velocity, or that were 2 broader than the mean PSF of the image in which they were found; the majority of our selected clusters have velocities or broadening factors in excess of 3 compared to stars. We were of course unable to identify compact GCs that have 100 km s-1, but we expect these to be relatively small in number.
We found that 31 objects obeyed our candidate selection criteria, and considered these excellent Sculptor group star cluster candidates. However, we needed to consider the possibility of further contamination from Galactic foreground stars. In our observed color and magnitude range, there is possible contamination from dwarf stars at distances of kpc, and by giants at distances 25 kpc. Because the Sculptor group galaxies lie near the South Galactic Pole, we expect that contaminating giants would lie in the halo, while the dwarf stars would be members of either the thick disk or halo. Since at the magnitudes of interest halo giants are outnumbered by foreground dwarfs by 100:1 (Morrison et al., 2000; Majewski, Ostheimer, Kunkel, & Patterson, 2000), dwarfs are the likeliest stellar contaminants. We thus used the gravity-sensitive features in our spectra, in particular the Mg and MgH features at 5200Å as well as Ca4227, to identify foreground dwarfs. Figure 5 shows the spectra of all of the candidates. Seven of the spectra–those of NGC 55 candidates #1, #2, #3, #5, and #6 and NGC 300 candidates #2 and #5–have the strong Mg and MgH absorption of dwarf stars. These spectra can be best fit by Kurucz (1993) models appropriate for solar-metallicity main sequence dwarfs (5.0), rather than lower-gravity models appropriate for integrated spectra of star clusters. Moreover, examining their position in the diagnostic diagram of Figure 4, we found that 3/7 lie near or below the 3 velocity limit, while the other four are broadened objects in NGC 55 that lie on the edge of the Mosaic 2 image and have near-zero heliocentric velocity. We thus removed these seven objects from the sample and considered the remaining 24 objects as likely Sculptor group star clusters. Table 4 summarizes the properties of the Sculptor group GCs.
5.2 Measurement of Lick indices
We measured Lick/IDS (Brodie & Huchra 1990) indices, as redefined by
Trager et al. (1998), for our star clusters and for the Lick/IDS
standards HD 3567, HD 22879, HD 23249, HD 196755, HD 218527, HD
219449, and HD 222368. We were primarily interested in the Balmer
indices, Mgb, Fe5270, Fe5335, and Ca4227; the Balmer indices are
useful as age indicators, while the combination
[Mg/Fe] (Thomas, Maraston, & Bender 2003) provides
a tracer of total metallicity that is independent of /Fe.
Because our spectra are of much higher resolution than those used to define the Lick/IDS system, we smoothed our spectra to the Lick/IDS resolution before measuring the equivalent widths of the indices. To do this, we smoothed our spectra with a variable-width Gaussian having FWHM linearly interpolated from Worthey & Ottaviani (1997)’s Table 8, which lists the Lick/IDS resolution as a function of wavelength. We then measured the equivalent widths following the prescription of Trager et al. (1998). The index definitions were first shifted to account for the radial velocity shifts measured in section §4.1; distortions in the wavelength scale were previously removed by our spectral reduction procedure. For each index, we then fit a straight line between the fluxes of the blue and red pseudocontinuum regions. The equivalent widths were measured by integrating the ratio of the observed flux to that of the local continuum fit over the wavelength regions of the indices. We computed errors in the equivalent widths by adding in quadrature the contributions from Poisson noise and the error introduced by our radial velocity uncertainities. Comparison of our measured equivalent widths and the standard values for the Lick/IDS standard stars provide an external measure of our errors. Figure 6 shows that the scatter in the residuals of the measured and standard index values is much larger than our internal estimates. We thus adopt the standard deviation of the residuals, which are 0.2Å, as the minimum true errors in equivalent width. Worthey et al. (1994) note that flat-fielding errors generally provide the dominant contribution to the errors in equivalent width; as this source of error is difficult to estimate, we did not account for it in our internal error budget. Figure 6 shows that of all the indices, only Ca4227 shows a bias in the equivalent width that is appreciably larger than the internal scatter. We subtracted this 0.2Å bias from the Ca4227 measurements.
Our observations of Lick standard stars were taken with much higher signal-to-noise ratio (S/N) than were the Sculptor group observations. To evaluate the effect of lower S/N on the measurement of the equivalent widths, we added various levels of Gaussian random noise to the Lick standard spectra and remeasured the equivalent widths. We found that above , the effect of lower S/N is to increase the scatter in equivalent width by 10%, which is typically equal to or smaller than the 0.2Å intrinsic error. Below , the error introduced by lower S/N increases dramatically, approaching 50% at S/N10. We thus analyzed the Lick indices of only those six Sculptor group star cluster spectra with S/N independently. For the remaining 18 lower S/N spectra, we shifted each to zero heliocentric velocity and measured the Lick indices of the single combined spectrum (Figure 7). Table 5 summarizes our Lick index measurements.
5.3 Ages and metallicities of Sculptor group star clusters
As mentioned previously, the combined index [Mg/Fe]′ (Thomas et al. 2003) is a useful total metallicity indicator, while the Balmer indices provide an indication of age. Figure 8 shows the Balmer indices and [Mg/Fe]′ for our 6 high-S/N spectra of Sculptor group candidate star clusters and for our combined spectrum of 18 clusters, compared to the single stellar population models of Thomas et al. (2003).
The comparison of the points with the models indicates that all of the star clusters of the Sculptor group have [Fe/H]. All of the candidates also have H strengths consistent with old age (12 Gyr), except perhaps one, NGC 247 #1, which may be intermediate in age, or has a very blue horizontal branch (cf. Beasley, Hoyle, & Sharples 2002). Using H or H (Worthey & Ottaviani 1997) in place of H yields similar results; most, if not all, clusters are compatible with old ages. As happens even in cases with excellent S/N spectra (e.g. Beasley, Hoyle, & Sharples 2002), some of the points fall outside the ranges predicted by the models; one might thus argue that we know little about the absolute ages and metallicities. However, given the small dispersion in [MgFe]′ and, to a lesser extent, the Balmer indices, we conclude that the metallicity and age range spanned by the clusters is small. Moreover, the qualitative agreement of our measured indices with those measured by Beasley, Hoyle, & Sharples (2002) for the LMC’s old globular clusters argues that our star clusters are likely old, metal-poor Sculptor group globular clusters.
We also used the Lick index measurements to investigate the [/Fe] element abundance ratios of the clusters. Figure 8 shows our measured Mg/Fe ratios compared to [MgFe]′, where FeFe5270 + Fe5335, compared to the Thomas et al. (2003) predictions. The individually measured clusters are consistent with , while the [/Fe] ratio of the combined GC spectrum appears to be 0.15. The average and standard deviation of our Mg/Fe measurements are 0.9 and 0.4 respectively, which corresponds to [/Fe] in the Thomas et al. (2003) model. This value is low compared to that of Milky Way globular clusters, which have [/Fe]0.3 (Kraft, 1994).
How do the spectroscopic metallicities agree with those expected from our Washington photometry? We used the relationship of Harris & Harris (2002), which is based on the Harris (1996) catalog of Galactic globular clusters and Harris & Canterna (1977)’s photometry, to derive [Fe/H] from our colors. Figure 9 shows the comparison between the metallicities expected from and those from [MgFe]′. The agreement between [Fe/H] and [Fe/H] is within the errors; we thus feel justified in providing estimates of the abundances of each of the individual 24 globular cluster candidates through our Washington photometry in Table 4.
5.3.1 Comparison with the Milky Way
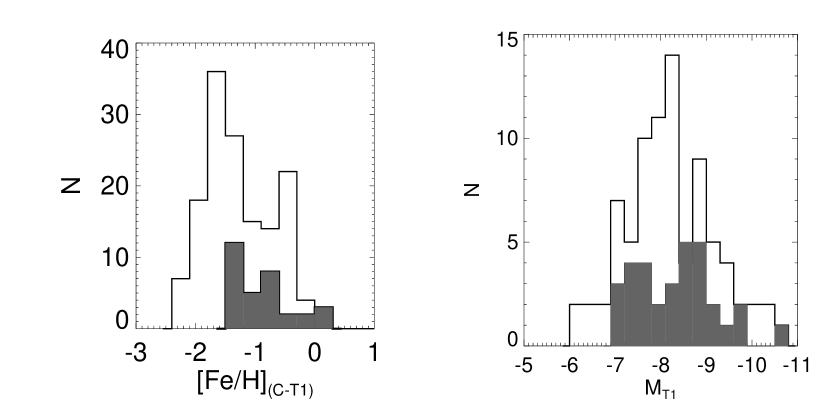
Figure 10 shows the luminosity function (LF) and [Fe/H] distribution of the combined Sculptor group GCs compared to those of the Milky Way (Harris, 1996). The Sculptor group distributions include the two NGC 55 GCs discovered by Da Costa & Graham (1982) and 6 out of 10 of the Beasley & Sharples (2000) GCs for which we have photometry but no spectra; the photometric measurements are listed at the end of Table 4. Three of the Beasley & Sharples (2000) GCs were found to have colors either too blue or too red compared to Milky Way GCs, and are not included in Figure 10. The LFs appear similar in the Milky Way and in the Sculptor group. Applying a Kolmogorov-Smirnov (K-S) test to the unbinned luminosity distributions, we found that the LFs have a 30% probability of being drawn from the same parent distribution. While the Sculptor group [Fe/H] distribution appears somewhat more metal rich, this difference may be the result of our inadvertent exclusion of GC candidates with . We thus conclude that there is no strong evidence to suggest different LFs or [Fe/H] distributions in the Sculptor group and Milky Way.
5.4 Kinematics of the globular cluster systems
To analyze the kinematics of the Sculptor group globular cluster systems, we combined our sample of GCs with those found by Beasley & Sharples (2000) in NGC 253 and NGC 55 and by Da Costa & Graham (1982) in NGC 55. Figure 11 shows the velocities of the GCs compared to the HI rotation curves Carignan & Puche (1990); Puche, Carignan, & Bosma (1990); Puche, Carignan, & Wainscoat (1991a); Puche, Carignan, & van Gorkom (1991b), where we have projected their rotation curves to the line-of-sight using their derived inclinations. To test for possible rotation in the GC systems, we fit the error-weighted GC velocities with a sinusoid of the form:
| (4) |
We computed two sets of solutions, one in which we allowed be a free parameter and one in which we fixed to the value derived from the H I observations; the solutions are summarized in Table 6. For NGC 253, these two fits were nearly identical, while we concluded that the other galaxies do not have enough GCs to warrant the extra degree of freedom introduced by allowing to vary, as witnessed by the large discrepancies in the systemic velocities calculated from the GCs vs. those from the H I. In all of the galaxies, we found that the position angles of the fits to the GC velocities agree closely with the position angle of the HI rotation curve. Indeed, Monte Carlo simulations show that there is only a 5% probability that such closely aligned position angles could occur by chance in NGC 55, NGC 247, and NGC 253, with 15% probability in NGC 300. We thus suggest that the globular cluster systems of the Sculptor group appear to have significant rotation, with . However, for NGC 55, NGC 247, and NGC 300, which have only a few identified GCs, this conclusion is only tentative. We also acknowledge that we likely have missed those compact GCs that have approaching velocities 100 km s-1, which may also affect these conclusions.
In NGC 55, the projected radii of the GCs all lie inside the outer boundary of the H I, while in NGC 300, the most distant cluster lies 2 kpc beyond the limit of the H I. Taking the rotation solutions at face value, we find that the NGC 55 and and NGC 300 GC systems are consistent with having circular orbits and flat rotation curves out to radii of 7.8 and 12.7 kpc, respectively, in agreement with the H I kinematics. In NGC 253, the GCs lie at projected radii of up to 22 kpc, a factor of 1.6 larger than the outer extent of the H I, once the distance used by Puche, Carignan, & Wainscoat (1991a) is adjusted to agree with Karachentsev et al. (2003). Assuming that the NGC 253 GCs all lie in the plane of the disk, we find deprojected radii of up to 65 kpc. As seen in Fig. 12, the GC system rotational velocity is a factor of 2 lower than that of the H I; indeed, the sum of the rotational kinetic energy and energy in random motions in NGC 253 falls a factor of 52 short of that expected from a flat rotation curve extending to a radius of 15 kpc. A possible explanation may be that we have missed a number of compact GCs with low line-of-sight velocities. However, the close agreement between the systemic velocities derived from our GCs and from the HI implies that we must then have missed an equally large number of GCs with high recessional velocities, for which we have no explanation. The only other explanation is that the NGC 253 GC sample suffers from asymmetric drift, in which the clusters we observe (which were selected to lie outside the disk of NGC 253) are on elliptical disk orbits with guiding centers preferentially located inside their observed radii. In an exponential disk, van der Marel et al. (2002) find that , where is the disk scale length; we can thus use the NGC 253 GC kinematics to estimate the disk scale length of the GC system. Taking km s-1, km s-1, kpc, and km s-1, we find kpc. For comparison, (Puche, Carignan, & van Gorkom, 1991b) measured the H I disk scale length to be 2.4 kpc; thus, the scale length of the NGC 253 disk appears to have remained unchanged, within a factor of 2, between the time of GC formation and the present.
5.5 Specific frequencies
Comparing the properties of the Sculptor group GC populations with those of other galaxies rests on our ability to estimate the completeness of our GC samples. Some GCs may have been lost because they lie either outside our images or within the elliptical masked regions of Figure 1, while others could fall outside our color and magnitude selection region. We also did not obtain useful spectra of all of the objects identified as GC candidates, such that some GCs may remain undiscovered within our survey area.
We calculated the completeness of our Sculptor group GC samples using the Milky Way as representative of the complete GC population. First, we placed the Milky Way GCs in the Harris (1996) catalog at the distances of the Sculptor group galaxies and calculated the fraction falling outside our images or within our masked-out regions. Second, we multiplied this fraction by the fraction of Milky Way GCs from Harris & Canterna (1977) that obeyed our color and magnitude selection criteria. Finally, we multiplied by the fraction of GCs for which we obtained useful spectra, assuming that the GCs for which we do not have spectra have the same luminosity function as those for which we do have spectra. Our estimated completeness fractions are listed in Table 7.
The traditional measure of a galaxy’s globular cluster content, the specific frequency , where is the total number of GCs and is the absolute magnitude of the host galaxy, is not well-suited to late-type galaxies because of the presence of populations much younger than those that formed the globular clusters that contribute to the total galaxy luminosities (e.g. Harris 2003). Nevertheless, it is a useful number to report for comparison with other studies of spiral galaxies. We list our measured in Table 7, where we have used the reddening-corrected galaxy magnitudes from the RC3 catalog (de Vaucouleurs et al., 1995) and the distances of Karachentsev et al. (2003) to calculate . We find 1 for the Sculptor group as a whole, compared to for the late-type galaxies listed in Ashman & Zepf (1998) and in Goudfrooij et al. (2003). The Sculptor group galaxies thus appear to have typical for late-type galaxies. Nevertheless, there is considerable diversity among the four galaxies in our sample, as NGC 253 appears to have the poorest GC system of all comparable late-type galaxies, while NGC 300 has among the richest (Figure 13).
Near-infrared bands, while still affected by the presence of young populations, are known to be more sensitive to the light from the red giants of older populations than are optical bands. We thus also calculated -band normalized GC specific frequencies, where we defined:
| (5) |
The zero point of was chosen to account for the typical color of E galaxies. The values of are listed in Table 7 and shown in Figure 13, in comparison with those galaxies in Ashman & Zepf (1998) that have -band magnitudes in Jarrett et al. (2003). For consistency with the way the were derived, we corrected the -band magnitudes using the internal and foreground extinction values from de Vaucouleurs et al. (1995), where we took (Schlegel et al. 1998); the largest correction for -band extinction was 0.13 magnitudes. Normalized to the -band, the average specific frequency of the Ashman & Zepf (1998) and Goudfrooij et al. (2003) late-type galaxies is 50% higher than if normalized to , while that in elliptical or S0 galaxies is only 10% higher, suggesting that the GC specific frequencies of late-type galaxies are indeed supressed by contamination from the light of young stars. Although much less powerful, the gist of this result is in agreement with McLaughlin (1999), who found similar GC formation efficiencies in the Milky Way halo and in giant elliptical galaxies. The specific frequency of NGC 253 remains almost unchanged, however, suggesting that it simply has a very poor GC population. The specific frequencies of the other three Sculptor group galaxies are greatly boosted once normalized in . Although the error bars are large, their specific frequencies are more typical of early-type galaxies than late-type galaxies.
6 Conclusions
Previous searches for globular clusters in the Sculptor group have found 17 GCs in NGC 55 and NGC 253 (Da Costa & Graham, 1982; Beasley & Sharples, 2000). Through our survey, we have discovered additional GCs in NGC 55 and NGC 253 and confirmed the existence of the first GCs in NGC 247 and NGC 300; in all, we have found 19 new Sculptor group globular clusters. We have also produced Washington photometry of 16 of the 17 previously known GCs and new spectroscopy for 5 of these. In addition, we have presented lists of unconfirmed candidate GCs in NGC 45, NGC 55, NGC 247, NGC 253, NGC 300, and NGC 7793; these candidates supplement those published by Liller & Alcaino (1983a),Liller & Alcaino (1983b), Blecha (1986), Beasley & Sharples (2000), Kim, Sung, & Lee (2002).
From our photometry, we have found that the bulk of the Sculptor group GCs are metal-poor. Our measurements of spectroscopic indices in 6 high signal-to-noise spectra and in the combined spectrum of 18 other GCs indicate that they have [Fe/H] and ages consistent with those of old Milky Way GCs. The combined luminosity function of the Sculptor group GCs has high statistical probability of being drawn from the same parent distribution as the Milky Way GCs.
Despite these strong similarities between the Sculptor group GCs and those of the Milky Way, our data indicate some important distinctions. First, our spectroscopic analysis indicates that the [/Fe] element ratio is in the Sculptor group GCs, which is 2 lower than the average [/Fe] ratio in Milky Way GCs. This may mean that the timescale for GC formation in the Sculptor group was longer than that for the appearance of type Ia supernovae. Second, all of the Sculptor group GC systems have kinematics consistent with rotation with the H I disk, although only in NGC 253 is this result based on more than a handful of objects. Whiting (1999) presented dynamical evidence that the Sculptor group galaxies acquired their spin in tidal interactions early in their history; the disk kinematics of the GC systems fit with this suggestion, as the GCs must have been present before or formed as a result of these interactions. Disk kinematics may also be seen in the old GC system of the LMC (Schommer et al. 1992, although note the argument to the contrary by van den Bergh 2004), whose members have ages within 1 Gyr of those of the oldest Milky Way GCs (Mighell et al., 1996; Olsen et al., 1998; Johnson et al., 1999). Thus, it may be that the formation sites of many of the first generation GCs were the disks of galaxies, rather than halos, as appears to be seen in cosmological simulations (e.g. Kravtsov et al. 2003). This suggestion would naturally fit into a picture where halo GCs represent the combination of the GC systems of many smaller merger fragments, such as in the scenario proposed by Côté et al. (1998).
The kinematics of the NGC 55 and NGC 300 GC systems are consistent with having circular orbits following the flat rotation curves derived from H I observations (Puche, Carignan, & Bosma, 1990; Puche, Carignan, & Wainscoat, 1991a). The kinematics of the NGC 253 GC system show evidence for asymmetric drift; we used this observation to show that the NGC 253 disk at the time of GC system formation had roughly the same scale length as it does now.
The globular cluster specific frequencies () of the Sculptor group galaxies appear similar to those of other late-type galaxies, although NGC 253 appears unusually poor in GCs, while NGC 300 appears unusually rich. We suggest that normalizing the specific frequencies to the near-infrared luminosities of the host galaxies (), rather than to the traditionally used -band luminosities, is more appropriate for late-type galaxies. We find that of a sample of late-type galaxies is a factor 1.5 larger than their , suggesting less contamination by the light from young stars in the infrared. In NGC 253, we find that is as low as , while in NGC 55, NGC 247, and NGC 300 it is a factor 2 higher. Indeed, in NGC 55, NGC 247, and NGC 300, is more typical of early-type than late-type galaxies. Similarly large specific frequencies have been found by Seth et al. (2004) in a sample of Virgo/Fornax dIrr galaxies; thus, some late-type galaxies may be as rich in GCs as are elliptical galaxies.
Finally, Many of our conclusions are tempered by fact that we have discovered only 520% of the Sculptor group’s globular clusters. We expect that many more GCs lie projected against the crowded galaxy disks, which we avoided in our survey; a number may also be bluer than our inadvertently red color selection. Other GCs may be in our candidate lists but not yet confirmed spectroscopically, while a handful may be found at large radii from the host galaxies. Additional spectroscopy of Sculptor group globular cluster candidates should yield valuable results.
References
- Ashman & Zepf (1998) Ashman, K. M. & Zepf, S. E. 1998, Globular cluster systems / Keith M. Ashman, Stephen E. Zepf. Cambridge, U. K. ; New York : Cambridge University Press, 1998. (Cambridge astrophysics series ; 30)
- Barbier-Brossat & Figon (2000) Barbier-Brossat, M. & Figon, P. 2000, A&AS, 142, 217
- Barden & Ingerson (1998) Barden, S. C. & Ingerson, T. E. 1998, ASP Conf. Ser. 152: Fiber Optics in Astronomy III, 60
- Barmby et al. (2001) Barmby, P., Huchra, J.P., Brodie, J.P. 2001, AJ, 121, 1482
- Beasley & Sharples (2000) Beasley, M. A. & Sharples, R. M. 2000, MNRAS, 311, 673
- Beasley et al. (2002) Beasley, M. A., Baugh, C. M., Forbes, D. A., Sharples, R. M., & Frenk, C. S. 2002, MNRAS, 333, 383
- Beasley, Hoyle, & Sharples (2002) Beasley, M. A., Hoyle, F., & Sharples, R. M. 2002, MNRAS, 336, 168
- Bertin & Arnouts (1996) Bertin, E. & Arnouts, S. 1996, A&AS, 117, 393
- Blecha (1986) Blecha, A. 1986, A&A, 154, 321
- Brodie & Huchra (1990) Brodie, J. P. & Huchra, J. P. 1990, ApJ, 362, 503
- Carignan & Puche (1990) Carignan, C. & Puche, D. 1990, AJ, 100, 641
- Chandar et al. (2002) Chandar, R., Bianchi, L., Ford, H. C., & Sarajedini, A. 2002, ApJ, 564, 712
- Côté et al. (1997) Côté, S., Freeman, K. C., Carignan, C., & Quinn, P. J. 1997, AJ, 114, 1313
- Côté et al. (1998) Côté, P., Marzke, R. O., & West, M. J. 1998, ApJ, 501, 554
- Côté et al. (2000) Côté, P., Marzke, R. O., West, M. J., & Minniti, D. 2000, ApJ, 533, 869
- Da Costa & Graham (1982) Da Costa, G. S. & Graham, J. A. 1982, ApJ, 261, 70
- de Vaucouleurs et al. (1995) de Vaucouleurs, G., de Vaucouleurs, A., Corwin, H. G., Buta, R. J., Paturel, G., & Fouque, P. 1995, VizieR Online Data Catalog, 7155
- Forbes et al. (2000) Forbes, D. A., Masters, K. L., Minniti, D., & Barmby, P. 2000, A&A, 358, 471
- Geisler (1996) Geisler, D. 1996, AJ, 111, 480
- Geisler & Forte (1990) Geisler, D. & Forte, J. C. 1990, ApJ, 350, L5
- Gilmore, Wyse, & Kuijken (1989) Gilmore, G., Wyse, R. F. G., & Kuijken, K. 1989, ARA&A, 27, 555
- Goudfrooij et al. (2003) Goudfrooij, P., Strader, J., Brenneman, L., Kissler-Patig, M., Minniti, D., & Huizinga, J. E. 2003, MNRAS, 343, 665
- Harris & Canterna (1977) Harris, H. C. & Canterna, R. 1977, AJ, 82, 798
- Harris & Canterna (1979) Harris, H. C. & Canterna, R. 1979, AJ, 84, 1750
- Harris (1996) Harris, W. E. 1996, AJ, 112, 1487
- Harris & Harris (2002) Harris, W. E. & Harris, G. L. H. 2002, AJ, 123, 3108
- Harris (2003) Harris, W. E. 2003, in Extragalactic Globular Cluster Systems, ed. M. Kissler-Patig (Berlin: Springer), 317
- Jarrett et al. (2003) Jarrett, T. H., Chester, T., Cutri, R., Schneider, S. E., & Huchra, J. P. 2003, AJ, 125, 525
- Johnson et al. (1999) Johnson, J. A., Bolte, M., Stetson, P. B., Hesser, J. E., & Somerville, R. S. 1999, ApJ, 527, 199
- Karachentsev et al. (2003) Karachentsev, I. D. et al. 2003, A&A, 404, 93
- Kim, Sung, & Lee (2002) Kim, S. C., Sung, H., & Lee, M. G. 2002, Journal of the Korean Astronomical Society, 35, 9
- King (1966) King, I. R. 1966, AJ, 71, 64
- Kraft (1994) Kraft, R. P. 1994, PASP, 106, 553
- Kravtsov & Gnedin (2003) Kravtsov, A. V., Gnedin, O. Y. 2003, astro-ph/0305199
- Kurucz (1993) Kurucz, R. L. 1993, Kurucz CD-ROM, Cambridge, MA: Smithsonian Astrophysical Observatory
- Landolt (1992) Landolt, A. U. 1992, AJ, 104, 340
- Liller & Alcaino (1983a) Liller, W. & Alcaino, G. 1983a, ApJ, 264, 53
- Liller & Alcaino (1983b) Liller, W. & Alcaino, G. 1983b, ApJ, 265, 166
- Majewski, Ostheimer, Kunkel, & Patterson (2000) Majewski, S. R., Ostheimer, J. C., Kunkel, W. E., & Patterson, R. J. 2000, AJ, 120, 2550
- McLaughlin (1999) McLaughlin, D. E. 1999, AJ, 117, 2398
- Mighell et al. (1996) Mighell, K.J., Rich, R.M., Shara, M., Fall, S.M. 1996, AJ, 111, 2314
- Monet et al. (1998) Monet, D. et al. 1998, USNO-A2.0 (Flagstaff: US Nav. Obs.)
- Morrison et al. (2000) Morrison, H. L., Mateo, M., Olszewski, E. W., Harding, P., Dohm-Palmer, R. C., Freeman, K. C., Norris, J. E., & Morita, M. 2000, AJ, 119, 2254
- Muller et al. (1998) Muller, G. P., Reed, R., Armandroff, T., Boroson, T. A., & Jacoby, G. H. 1998, Proc. SPIE, 3355, 577
- Olsen et al. (1998) Olsen, K. A. G., Hodge, P. W., Mateo, M., Olszewski, E. W., Schommer, R. A., Suntzeff, N. B., & Walker, A. R. 1998, MNRAS, 300, 665
- Olszewski et al. (1991) Olszewski, E. W., Schommer, R. A., Suntzeff, N. B., & Harris, H. C. 1991, AJ, 101, 515
- Puche, Carignan, & Bosma (1990) Puche, D., Carignan, C., & Bosma, A. 1990, AJ, 100, 1468
- Puche, Carignan, & Wainscoat (1991a) Puche, D., Carignan, C., & Wainscoat, R. J. 1991, AJ, 101, 447
- Puche, Carignan, & van Gorkom (1991b) Puche, D., Carignan, C., & van Gorkom, J. H. 1991, AJ, 101, 456
- Santos (2003) Santos, M. R. 2003, in Extragalactic Globular Cluster Systems, ed. M. Kissler-Patig (Berlin: Springer), 348
- Sarajedini et al. (1998) Sarajedini, A., Geisler, D., Harding, P., & Schommer, R. 1998, ApJ, 508, L37
- Schechter, Mateo, & Saha (1993) Schechter, P. L., Mateo, M., & Saha, A. 1993, PASP, 105, 1342
- Schlegel, Finkbeiner, & Davis (1998) Schlegel, D. J., Finkbeiner, D. P., & Davis, M. 1998, ApJ, 500, 525
- Schommer et al. (1991) Schommer, R. A., Christian, C. A., Caldwell, N., Bothun, G. D., & Huchra, J. 1991, AJ, 101, 873
- Schommer et al. (1992) Schommer, R. A., Suntzeff, N. B., Olszewski, E. W., & Harris, H. C. 1992, AJ, 103, 447
- Schweizer et al. (1996) Schweizer, F., Miller, B. W., Whitmore, B. C., & Fall, S. M. 1996, AJ, 112, 1839
- Searle & Zinn (1978) Searle, L. & Zinn, R. 1978, ApJ, 225, 357
- Seth et al. (2004) Seth, A., Olsen, K., Miller, B., Lotz, J., & Telford, R. 2004, AJ, in press (astro-ph/0311106)
- Stetson (1987) Stetson, P. B. 1987, PASP, 99, 191
- Stetson & Harris (1988) Stetson, P. B. & Harris, W. E. 1988, AJ, 96, 909
- Suntzeff et al. (1992) Suntzeff, N. B., Schommer, R. A., Olszewski, E. W., & Walker, A. R. 1992, AJ, 104, 1743
- Thomas, Maraston, & Bender (2003) Thomas, D., Maraston, C., & Bender, R. 2003, MNRAS, 339, 897
- Tonry & Davis (1979) Tonry, J. & Davis, M. 1979, AJ, 84, 1511
- Trager et al. (1998) Trager, S. C., Worthey, G., Faber, S. M., Burstein, D., & Gonzalez, J. J. 1998, ApJS, 116, 1
- Valdes (1997) Valdes, F. 1997, ASP Conf. Ser. 125: Astronomical Data Analysis Software and Systems VI, 6, 455
- van den Berg (2004) van den Bergh, S. 2004, AJ, in press
- van der Marel et al. (2002) van der Marel, R. P., Alves, D. R., Hardy, E., & Suntzeff, N. B. 2002, AJ, 124, 2639
- van Dokkum (2001) van Dokkum, P. G. 2001, PASP, 113, 1420
- Whiting (1999) Whiting, A. B. 1999, AJ, 117, 202
- Worthey et al. (1994) Worthey, G., Faber, S. M., Gonzalez, J. J., & Burstein, D. 1994, ApJS, 94, 687
- Worthey & Ottaviani (1997) Worthey, G. & Ottaviani, D. L. 1997, ApJS, 111, 377


| Target | Instrument | Filter | Date observed | Exposure time (s) |
|---|---|---|---|---|
| NGC 55 | Mosaic 2 | 1999 Nov 11 | 250 | |
| NGC 55 | Mosaic 2 | 1999 Nov 11 | 250 | |
| NGC 55 | Mosaic 2 | 1999 Nov 11 | 250 | |
| NGC 247 | Mosaic 2 | 1999 Nov 11 | 1410 | |
| NGC 247 | Mosaic 2 | 1999 Nov 11 | 1410 | |
| NGC 247 | Mosaic 2 | 1999 Nov 11 | 1410 | |
| NGC 253 | Mosaic 2 | 1999 Nov 11 | 1410 | |
| NGC 253 | Mosaic 2 | 1999 Nov 11 | 1410 | |
| NGC 300 | Mosaic 2 | 1999 Nov 11 | 600 | |
| NGC 300 | Mosaic 2 | 1999 Nov 11 | 600 | |
| NGC 300 | Mosaic 2 | 1999 Nov 11 | 600 | |
| NGC 253 | Mosaic 2 | 1999 Nov 12 | 1410 | |
| NGC 45 | Mosaic 2 | 1999 Nov 12 | 2000 | |
| NGC 45 | Mosaic 2 | 1999 Nov 12 | 2000 | |
| NGC 45 | Mosaic 2 | 1999 Nov 12 | 2000 | |
| NGC 55 | Mosaic 2 | 1999 Nov 12 | 80 | |
| NGC 55 | Mosaic 2 | 1999 Nov 12 | 80 | |
| NGC 55 | Mosaic 2 | 1999 Nov 12 | 80 | |
| NGC 300 | Mosaic 2 | 1999 Nov 12 | 200 | |
| NGC 300 | Mosaic 2 | 1999 Nov 12 | 200 | |
| NGC 300 | Mosaic 2 | 1999 Nov 12 | 200 | |
| NGC 247 | Mosaic 2 | 1999 Nov 12 | 300 | |
| NGC 247 | Mosaic 2 | 1999 Nov 12 | 300 | |
| NGC 247 | Mosaic 2 | 1999 Nov 12 | 300 | |
| NGC 7793 | Mosaic 2 | 1999 Nov 12 | 850 | |
| NGC 7793 | Mosaic 2 | 1999 Nov 13 | 2550 | |
| NGC 7793 | Mosaic 2 | 1999 Nov 13 | 2550 | |
| NGC 7793 | Mosaic 2 | 1999 Nov 13 | 2550 | |
| NGC 253 | Mosaic 2 | 1999 Nov 13 | 200 | |
| NGC 253 | Mosaic 2 | 1999 Nov 13 | 200 | |
| NGC 253 | Mosaic 2 | 1999 Nov 13 | 200 | |
| HD 3567 | Hydra-CTIO/Air Schmidt | 2000 Oct 31 | 300 | |
| HD 22879 | Hydra-CTIO/Air Schmidt | 2000 Oct 31 | 300 | |
| HD 23249 | Hydra-CTIO/Air Schmidt | 2000 Oct 31 | 25 | |
| HD 196755 | Hydra-CTIO/Air Schmidt | 2000 Nov 2 | 110 | |
| HD 218527 | Hydra-CTIO/Air Schmidt | 2000 Nov 2 | 80 | |
| HD 219449 | Hydra-CTIO/Air Schmidt | 2000 Nov 2 | 50 | |
| HD 222368 | Hydra-CTIO/Air Schmidt | 2000 Nov 2 | 50 | |
| NGC 55 | Hydra-CTIO/400mm | 2001 Oct 17 | 13500 | |
| HD195633 | Hydra-CTIO/400mm | 2001 Oct 17 | 10 | |
| HD223311 | Hydra-CTIO/400mm | 2001 Oct 17 | 5 | |
| NGC 253 | Hydra-CTIO/400mm | 2001 Oct 18 | 16200 | |
| HD223311 | Hydra-CTIO/400mm | 2001 Oct 18 | 5 | |
| NGC 300 | Hydra-CTIO/400mm | 2001 Oct 19 | 16200 | |
| HD217877 | Hydra-CTIO/400mm | 2001 Oct 19 | 3 | |
| HD223311 | Hydra-CTIO/400mm | 2001 Oct 19 | 90 | |
| NGC 247 | Hydra-CTIO/400mm | 2001 Oct 20 | 13500 | |
| 47 Tuc | Hydra-CTIO/400mm | 2001 Oct 20 | 600 | |
| HD223311 | Hydra-CTIO/400mm | 2001 Oct 20 | 10 |
| Chip # | |||
|---|---|---|---|
| 1 | 0.505(14) | -0.142(11) | 0.32(3) |
| 2 | 0.497(20) | -0.141(15) | 0.32(3) |
| 3 | 0.494(22) | -0.153(17) | 0.32(3) |
| 4 | 0.492(17) | -0.149(9) | 0.32(3) |
| 5 | 0.467(24) | -0.159(29) | 0.32(3) |
| 6 | 0.473(9) | -0.147(11) | 0.32(3) |
| 7 | 0.516(15) | -0.163(20) | 0.32(3) |
| 8 | 0.489(13) | -0.140(18) | 0.32(3) |
| 1 | -0.884(16) | -0.160(17) | 0.19(2) |
| 2 | -0.853(11) | -0.141(17) | 0.19(2) |
| 3 | -0.856(14) | -0.128(12) | 0.19(2) |
| 4 | -0.856(15) | -0.122(24) | 0.19(2) |
| 5 | -0.867(15) | -0.133(23) | 0.19(2) |
| 6 | -0.852(13) | -0.150(13) | 0.19(2) |
| 7 | -0.863(16) | -0.123(21) | 0.19(2) |
| 8 | -0.864(12) | -0.119(16) | 0.19(2) |
| 1 | -0.649(7) | -0.018(5) | 0.14(3) |
| 2 | -0.640(13) | -0.020(10) | 0.14(3) |
| 3 | -0.633(6) | -0.016(4) | 0.14(3) |
| 4 | -0.623(15) | -0.010(12) | 0.14(3) |
| 5 | -0.657(11) | -0.016(9) | 0.14(3) |
| 6 | -0.608(15) | -0.026(3) | 0.14(3) |
| 7 | -0.623(6) | -0.024(4) | 0.14(3) |
| 8 | -0.644(8) | -0.012(6) | 0.14(3) |
| Number | R.A. | Dec. | log area | Note | |||||||||
|---|---|---|---|---|---|---|---|---|---|---|---|---|---|
| (2000.0) | (pixel2) | (km s-1) | (km s-1) | ||||||||||
| NGC 247 | |||||||||||||
| 1 | 0:45:48.756 | -20:27:12.19 | 2.32 | 0.08 | 21.927 | 0.017 | 21.260 | 0.009 | 20.550 | 0.007 | no spectrum | ||
| 2 | 0:45:51.535 | -20:46:55.88 | 2.28 | 0.13 | 22.035 | 0.019 | 21.291 | 0.009 | 20.606 | 0.007 | weak spectrum | ||
| 3 | 0:45:51.652 | -20:59:51.26 | 2.37 | 0.18 | 22.445 | 0.025 | 21.508 | 0.011 | 20.563 | 0.007 | no spectrum | ||
| 4 | 0:45:52.098 | -21:03:36.51 | 2.45 | 0.08 | 20.828 | 0.009 | 20.159 | 0.005 | 19.549 | 0.004 | no spectrum | ||
| 5 | 0:45:52.528 | -20:36:06.72 | 2.35 | 0.13 | 22.366 | 0.022 | 21.407 | 0.010 | 20.481 | 0.007 | no spectrum | ||
| 6 | 0:45:52.971 | -20:53:13.42 | 2.32 | 0.10 | 22.778 | 0.029 | 21.752 | 0.013 | 20.781 | 0.008 | no spectrum | ||
| 7 | 0:45:54.488 | -20:31:44.65 | 2.33 | 0.05 | 22.077 | 0.020 | 21.406 | 0.010 | 20.416 | 0.006 | no spectrum | ||
| 8 | 0:45:54.994 | -20:41:01.00 | 2.29 | 0.13 | 22.410 | 0.024 | 21.805 | 0.014 | 20.741 | 0.008 | no spectrum | ||
| 9 | 0:45:55.280 | -20:33:19.49 | 2.43 | 0.04 | 21.196 | 0.011 | 20.605 | 0.006 | 19.936 | 0.005 | no spectrum | ||
| 10 | 0:45:57.405 | -20:56:32.82 | 2.40 | 0.08 | 21.692 | 0.015 | 21.035 | 0.008 | 20.365 | 0.006 | galaxy | ||
| …… |
| NameaaDGDa Costa & Graham (1982); BSBeasley & Sharples (2000) | OriginalbbBBlecha (1986); LALiller & Alcaino (1983a, b) | NumberccCorresponds to number in column 1 of Table 3 | [Fe/H] | [Fe/H]Lick | Broad | Significance | ||||
|---|---|---|---|---|---|---|---|---|---|---|
| Name | (mag) | (mag) | (mag) | (km s-1) | () | |||||
| NGC55-4 | 83 | -7.4 | 0.015 | 1.249 | -1.38 0.16 | 131.1 13.6 | 1.05 | 3 | ||
| NGC55-7 | LA43 | 27 | -9.2 | 0.014 | 1.341 | -1.16 0.16 | -1.76 0.43 | 242.3 4.8 | 1.26 | 3 |
| NGC55-8 | 71 | -7.0 | 0.015 | 1.468 | -0.88 0.16 | 163.3 12.5 | 1.02 | 3 | ||
| NGC247-1 | 64 | -9.7 | 0.018 | 1.353 | -1.13 0.16 | -1.04 0.29 | 87.3 4.4 | 0.86 | 2 | |
| NGC247-2 | 53 | -7.5 | 0.018 | 1.725 | -0.41 0.16 | 117.4 17.6 | 0.92 | 2 | ||
| NGC247-3 | 73 | -8.5 | 0.018 | 1.460 | -0.89 0.16 | 172.9 12.9 | 1.08 | 3 | ||
| NGC253-1 | LA40 | 46 | -9.6 | 0.019 | 1.522 | -0.77 0.16 | -0.88 0.25 | 166.0 4.7 | 1.00 | 3 |
| NGC253-2 | 26 | -8.5 | 0.019 | 1.330 | -1.18 0.16 | 361.2 5.0 | 1.31 | 3 | ||
| NGC253-3 | 92 | -8.2 | 0.019 | 1.585 | -0.65 0.16 | 249.8 7.7 | 1.13 | 3 | ||
| NGC253-4 | 114 | -7.6 | 0.020 | 1.571 | -0.67 0.16 | 191.6 17.1 | 1.02 | 3 | ||
| NGC253-5 | B15 | 19 | -8.4 | 0.019 | 1.271 | -1.33 0.16 | 205.1 10.3 | 1.06 | 3 | |
| NGC253-6 | 109 | -8.0 | 0.019 | 1.286 | -1.29 0.16 | 177.5 4.6 | 0.94 | 3 | ||
| NGC253-7 | 73 | -7.6 | 0.019 | 1.845 | -0.23 0.16 | 176.2 2.4 | 1.20 | 3 | ||
| NGC253-8 | 110 | -8.6 | 0.019 | 1.264 | -1.34 0.16 | 186.2 12.7 | 1.03 | 3 | ||
| NGC253-9 | LA35 | 5 | -10.6 | 0.019 | 1.305 | -1.24 0.16 | -1.07 0.30 | 254.2 8.1 | 1.09 | 3 |
| NGC253-10 | LA57 | 15 | -8.6 | 0.020 | 1.665 | -0.51 0.16 | 265.4 10.0 | 1.17 | 3 | |
| NGC253-11 | 48 | -8.6 | 0.019 | 1.530 | -0.75 0.16 | 271.3 8.8 | 0.95 | 3 | ||
| NGC300-1 | 48 | -8.1 | 0.013 | 1.276 | -1.31 0.16 | -1.87 0.45 | 115.2 12.2 | 1.63 | 3 | |
| NGC300-3 | 121 | -8.9 | 0.011 | 1.209 | -1.48 0.16 | -1.25 0.35 | 248.3 3.1 | 1.00 | 3 | |
| NGC300-4 | 23 | -7.3 | 0.015 | 1.936 | -0.12 0.16 | 249.1 21.1 | 0.87 | 3 | ||
| NGC300-6 | 29 | -7.2 | 0.013 | 1.208 | -1.48 0.16 | 81.9 9.0 | 0.88 | 2 | ||
| NGC300-7 | 44 | -7.6 | 0.016 | 1.284 | -1.29 0.16 | 120.2 10.0 | 1.06 | 3 | ||
| NGC300-8 | 63 | -7.6 | 0.013 | 2.069 | 0.02 0.16 | 141.2 55.0 | 1.14 | 3 | ||
| NGC300-9 | 32 | -7.0 | 0.014 | 1.486 | -0.84 0.16 | 118.1 32.6 | 0.89 | 2 | ||
| DG2 | -8.8 | 0.013 | 1.379(40) | -1.07 0.16 | 11914ddVelocity from Da Costa & Graham (1982) | |||||
| DG3 | -8.9 | 0.013 | 1.246(40) | -1.39 0.16 | 12513ddVelocity from Da Costa & Graham (1982) | |||||
| BS7 | B1 | -7.7 | 0.019 | 0.370(52) | 212 74eeVelocity from Beasley & Sharples (2000) | |||||
| BS8 | LA26 | -8.7 | 0.019 | 1.273(22) | -1.3202 0.16 | 235 28eeVelocity from Beasley & Sharples (2000) | ||||
| BS28 | LA11 | -8.4 | 0.019 | 0.739(14) | 228 85eeVelocity from Beasley & Sharples (2000) | |||||
| BS40 | LA24 | -9.7 | 0.019 | 1.571(80) | -0.6741 0.16 | 401 117eeVelocity from Beasley & Sharples (2000) | ||||
| BS42 | B24 | -8.4 | 0.019 | 1.248(54) | -1.3834 0.16 | 313 85eeVelocity from Beasley & Sharples (2000) | ||||
| BS44 | LA3 | -9.3 | 0.019 | 2.052(28) | 0.0029 0.16 | 447 102eeVelocity from Beasley & Sharples (2000) | ||||
| BS57 | B12 | -8.8 | 0.019 | 1.402(31) | -1.0181 0.16 | 361 45eeVelocity from Beasley & Sharples (2000) | ||||
| BS58 | B13 | -7.5 | 0.019 | 2.972(319) | 261 52eeVelocity from Beasley & Sharples (2000) | |||||
| BS61 | B14 | -8.9 | 0.019 | 0.717(32) | 302 22eeVelocity from Beasley & Sharples (2000) |
| ID | Ca4227 | H | H | H | H | H | Mgb | Fe5270 | Fe5335 | [MgFe]′ |
|---|---|---|---|---|---|---|---|---|---|---|
| (Å) | (Å) | (Å) | (Å) | (Å) | (Å) | (Å) | (Å) | (Å) | (Å) | |
| NGC55-7 | 0.056 | 2.656 | 2.454 | 1.518 | 2.487 | 0.223 | 0.679 | 1.353 | 1.406 | 0.964 |
| 0.230 | 0.240 | 0.450 | 0.450 | 1.300 | 0.600 | 0.250 | 0.310 | 0.150 | 0.200 | |
| NGC247-1 | 0.147 | 3.766 | -0.348 | 1.335 | -1.146 | -4.572 | 1.130 | 2.546 | 1.211 | 1.567 |
| 0.230 | 0.240 | 0.450 | 0.450 | 1.300 | 0.600 | 0.250 | 0.310 | 0.150 | 0.200 | |
| NGC253-1 | 1.730 | 2.361 | 0.906 | 1.088 | -2.232 | -0.771 | 2.007 | 1.365 | 2.149 | 1.783 |
| 0.230 | 0.240 | 0.450 | 0.450 | 1.300 | 0.600 | 0.250 | 0.310 | 0.150 | 0.200 | |
| NGC253-9 | 1.179 | 2.102 | 6.695 | 1.390 | 4.856 | -1.681 | 1.357 | 1.825 | 1.478 | 1.531 |
| 0.230 | 0.240 | 0.450 | 0.450 | 1.300 | 0.600 | 0.250 | 0.310 | 0.150 | 0.200 | |
| NGC300-1 | 0.404 | 2.848 | 1.970 | -1.113 | 1.110 | -2.970 | 0.738 | 1.079 | 1.274 | 0.915 |
| 0.230 | 0.240 | 0.450 | 0.450 | 1.300 | 0.600 | 0.250 | 0.310 | 0.150 | 0.200 | |
| NGC300-3 | 0.727 | 1.545 | 0.510 | -0.790 | -0.982 | -3.734 | 1.379 | 1.210 | 1.162 | 1.285 |
| 0.230 | 0.240 | 0.450 | 0.450 | 1.300 | 0.600 | 0.250 | 0.310 | 0.150 | 0.200 | |
| Low S/N | 0.802 | 0.801 | 0.897 | -0.198 | 1.061 | -2.945 | 2.114 | 1.181 | 1.743 | 1.682 |
| spectra (combined) | 0.230 | 0.240 | 0.450 | 0.450 | 1.300 | 0.600 | 0.250 | 0.310 | 0.150 | 0.200 |
| Galaxy | ||||||
|---|---|---|---|---|---|---|
| (km s-1) | (km s-1) | (km s-1) | (°) | (°) | ||
| NGC 55 | 45.7 | 185.1 22.6 | 111.6 45.6 | -35.3 25.3 | -54.3 25.3 | 2.4 1.0 |
| 125.0 | 96.8 39.1 | 10.2 25.7 | -8.8 25.7 | 1.4 0.6 | ||
| NGC 247 | 35.4 | 142.5 10.0 | 55.2 10.9 | 73.9 16.8 | -7.1 16.8 | |
| 161.0 | 76.1 15.6 | 87.1 12.0 | 6.1 12.0 | 6.3 1.3 | ||
| NGC 253 | 76.1 | 235.9 8.8 | 71.8 21.5 | 129.8 17.9 | -9.2 17.9 | 1.2 0.4 |
| 245.0 | 77.9 18.1 | 128.6 13.6 | -10.4 13.6 | 1.3 0.3 | ||
| NGC 300 | 62.4 | 174.1 11.6 | 77.0 19.6 | -37.9 15.0 | -53.5 15.0 | 2.3 0.6 |
| 145.0 | 95.5 21.4 | -16.9 13.3 | -32.5 13.3 | 2.5 0.6 |
| Galaxy | Completeness | |||
|---|---|---|---|---|
| NGC 55 | 5 | 0.14 | 0.74 0.36 | 5.09 2.33 |
| NGC 247 | 3 | 0.05 | 0.84 0.49 | 5.21 3.02 |
| NGC 253 | 21 | 0.21 | 0.25 0.06 | 0.30 0.07 |
| NGC 300 | 7 | 0.10 | 2.19 0.85 | 8.33 3.17 |