Further Clues to the Nature of Composite LINER/H II Galaxies
We have analyzed new, archival and published high resolution radio and X-ray observations of a sample of composite LINER/H ii galaxies known to exhibit AGN-like properties. Five of the 16 AGN candidates have milliarcsecond-scale detections and are found to display a compact, flat spectrum, high brightness temperature radio core, four of which also exhibit extended radio emission. Five of the eight AGN candidates with available high resolution X-ray observations were found to possess a hard X-ray nuclear source, two of which have no milliarcsecond radio detection. The combined high resolution radio and X-ray data yield a 50% detection rate of low luminosity AGN among the AGN candidates, which translates into a 12% detection rate for the entire composite LINER/H ii sample. In the sources where the AGN has been unambiguously detected, the ionizing power of the AGN is not sufficient to generate the observed emission lines, unless the hard X-rays are heavily obscured. We attempt to apply a canonical advection-dominated accretion flow (ADAF) and jet model to the sample sources in order to explain the observed radio and X-ray emission. While ADAFs may be responsible for the observed emission in submillijansky radio cores like NGC 7331, they do not appear consistent with the radio emission observed in the milliarcsecond-scale radio detected cores; the latter sources are more likely to have an energetically important contribution from a radio-emitting jet.
Key Words.:
galaxies: active — galaxies: nuclei — radiation mechanisms: general1 Introduction
The radio emission observed in nearby galaxies can be attributed to stellar and interstellar processes – non-thermal synchrotron radiation from electrons accelerated by supernova remnants (SNRs) and thermal emission from H ii regions – or to the presence of accreting black holes. In the former case, the radio emission coincides with the infrared and optical emission-line sources, which are themselves tracers of young stars and supernovae. The radio emission originates in diffuse, low surface brightness regions that do not extend beyond the stellar light distribution. On the other hand, radio sources produced by accreting black holes are generally characterized by compact, nuclear radio cores, sometimes associated with jets and lobes. In many instances circumnuclear starburst regions and black holes coexist spatially, making it difficult to disentangle the two components in the optical regime and also in the radio. Furthermore, at high resolution, even star-forming galaxies may show compact radio sources, associated with radio supernovae (RSN) and SNRs (e.g. Weiler et al. 1986). In an active galactic nucleus (AGN), the presence of a flat radio spectrum source (0.5; F) indicates synchrotron self-absorption in components whose brightness temperatures are comparable to the kinetic temperatures (mc2/k; TB105 K) of the relativistic electrons producing the synchrotron radiation. Steep spectrum emission in star-forming galaxies (0.5) arises from the non-thermal emission of SNRs, whereas flat spectra are consistent with free-free absorption of optically thin synchrotron radiation and/or thermal emission (TB104 K) originating from the electrons in H ii regions. So, while the spectra of thermal emitters may mimic those of partially opaque synchrotron sources, a combination of brightness temperature and radio spectral index of the strong nuclear radio components can indicate whether the emission is thermal (TB104 K; Condon 1992) or non-thermal (TB105 K) and whether optically thin thermal (0.1), self-absorbed synchrotron (0.5), or optically thin synchrotron (0.5–0.8) radiation dominates.
We have therefore applied this radio technique to a sample of mildly active galaxies – composite LINER/H ii galaxies – known to exhibit both starburst and AGN characteristics in their optical spectra. The motivation for studying this class of galaxies is to study the demographics of black hole accretion in cases suspected of weak AGN activity. This is an important issue because, if composite sources do indeed harbour a genuine active nucleus, then their considerable number (13% of emission-line nuclei with B 12.5 mag; Ho, Filippenko & Sargent 1997) will imply a significant contribution to the AGN population.
2 Sample Selection
In Filho, Barthel & Ho (2000, 2002) we have presented a study of the radio characteristics of a complete sample of composite LINER/H ii galaxies, i.e., galaxies that are hypothesized to be LINERs spatially contaminated by circumnuclear star-forming regions (Ho 1996). The first part of our project consisted in gathering arcsecond-scale radio information (published or new) of the 65 composite sources contained in the magnitude-limited Palomar survey (Ho, Filippenko & Sargent 1995, 1997a). Their radio properties (Filho, Barthel & Ho 2000, 2002) indicate composite sources come in two types: AGN-like sources with compact cores and starburst-like sources dominated by diffuse emission, co-spatial with the projected galactic disk. The complete composite source sample contained 14 (25%) AGN candidates as revealed by compact, flat/inverted radio spectrum cores on arcsecond scales, with peak flux densities above 1 mJy. NGC 660 and NGC 7331 have been included in the AGN candidate sample although they have sub-mJy radio peaks as explained in Filho, Barthel & Ho (2002). These sixteen sources comprise the present sample of candidate AGN-driven composite LINER/H ii galaxies.
3 New and Published Radio Observations
Radio imaging at sub-arcsec and mas resolution of several of the sample sources have already been published. Our observations, using the Very Large Array (VLA) and the Very Large Baseline Array (VLBA), complement these observations and yield a complete picture of the occurrence of compact nuclei in the sample.
In this section we report on high resolution VLA observations of 12 (four new and eight published) and multiwavelength VLBA observations of 15 (13 new and two published) out of the 16 sample sources. Regarding the former, of the possible eight galaxies with no published sub-arcsec-scale radio information, four were chosen to fit the observational window assigned to us by the VLA. As for the latter, NGC 7331 was not observed with the VLBA because its radio core flux density at 1 .5 resolution is well below 1 mJy at both 1.4 and 5 GHz (Cowan, Romanishin & Branch 1994) and NGC 5866 and NGC 4552 because they had been previously observed and detected with the VLBA by Falcke et al. (2000) and Nagar et al. (2002), respectively. Following a description of our observations, we will combine the new and published data in a coherent analysis of the sample.
3.1 Observations and Data Reduction
VLA observations of four sources in the sample were performed on 1999 September 5 with the A-array, X-band system (8.4 GHz). Two IFs of 50 MHz each were combined to give a total bandwidth of 100 MHz. In its A-array configuration, the VLA yields typical resolutions of 0 .25 at 8.4 GHz (which corresponds to 12 pc at D=10 Mpc). Observations of the sample sources were interspersed with observations of nearby phase calibrators, for a total integration time of about 10 minutes per galaxy. The primary flux calibrator was 3C 286 (1328+307) with adopted 8.4 GHz flux densities of 5.1915 Jy and 5.1702 Jy for IF1 and IF2, respectively. The uncertainty associated with the flux calibration procedure is mainly due to the uncertainty in the absolute flux density of 3C 286, which is conservatively set to 5%. Antenna gains were found to behave well throughout the observations.
VLBA observations of 13 out of the 16 sample galaxies were obtained in five sessions – 2000 June 22, 2001 September 1, 2001 September 8, 2001 September 17 and 2001 October 6 – with the standard ten VLBA antennas. The standard observing frequency was 5 GHz, although some sources have multi-wavelength observations. The four 8 MHz IFs yielded a total bandwidth of 32 MHz. Typical resolutions for the VLBA at 5 GHz are 2 mas (which corresponds to 0.1 pc at D=10 Mpc). Phase referencing was performed, which includes several minute on-source scans alternated with scans of nearby phase calibrators, yielding generally 180 (in some cases 45) minutes total integration time on each target source.
Reduction of both the VLA and VLBA data was performed using standard NRAO AIPS (version 15Oct99) image processing routines. After initial deleting of bad data points and calibration, the data were ‘cleaned’. The AIPS ‘cleaning’ task IMAGR was employed to Fourier transform the data and remove sidelobes from the maps in an interactive and iterative mode. Some sources were observed in multiple VLBA runs separated by several days. For these sources, maps were made for each run separately, since combining the data did not result in a better map. Full resolution images, having a 0 .25 synthesized beam, were obtained for the VLA data and 2 mas synthesized beam at 5 GHz for the VLBA data. The image noise level reached the theoretical level of 0.07 mJy/beam (uniform weighting; Perley, Schwab & Bridle 1989) to within a factor of two for the VLA data and 0.05 mJy/beam for the VLBA data. Phase self-calibration was employed on the strongest sources, leading to some reduction in the image noise level. The 8.4 GHz VLA calibrated data provided by Dr. Jim Ulvestad for NGC 660 have been re-analysed, yielding slightly different radio parameters than those presented in Filho, Barthel & Ho (2002).
The image noise levels were measured with the AIPS task IMSTAT in a source-free region. Using the AIPS task IMFIT, the brightness peaks of the radio sources were fitted with single bi-dimensional Gaussians.
3.2 Results of the Radio Observations
Four of four VLA and three of 13 newly observed VLBA sample sources were detected. Table 1 at the end of the paper lists image parameters for the new data, where we have also included relevant published radio data from Nagar et al. (2000, 2002), Cowan, Romanishin & Branch (1994; NGC 7331) and Falcke et al. (2000; NGC 5866). We refer to Filho, Barthel & Ho (2000, 2002) for an extensive discussion on the radio properties of the sample sources. Undetected sources have been given 5 upper limits for the VLA and VLBA data. We estimate the radio peak positions to be accurate to within 0 .2 for the VLA and 1 mas for the VLBA data, due to the good phase solutions and accurate positions of the phase calibrators. Sources are considered unresolved if their deconvolved source sizes are less than half the beamwidth in any component.
Fig. 1–2 at the end of the paper show the highest signal-to-noise radio maps of the newly detected VLBA sources. The contour levels are the following multiples of the noise (Table 1) in the map: 3, 2.1, 2.1, 3, 4.2, 6, 8.4, 12, 16.8, 24.
3.2.1 Radio Core Properties
In Table 2 we list the radio properties of the detected mas-scale sample sources (from new or published data). Unless otherwise mentioned, we have used the longest integration time VLBA 5 GHz radio flux densities to calculate the spectral indices and brightness temperatures. Radio spectral indices should be taken with caution, due to non-simultaneity and mismatch in resolution. For the multiple radio components in NGC 5846, we have given 5 limits to any 5 GHz emission in order to obtain upper limits for the spectral indices. We calculate the brightness temperature as:
TB=7.810
where Fν is the peak flux density at 5 GHz in the VLBA maps (Table 1) and is the FWHM of the Gaussian beam, taken to be typically 2.5 mas at 5 GHz. For unresolved sources, the quoted brightness temperatures should be considered lower limits.
| Fradio | TB | |||||
|---|---|---|---|---|---|---|
| Galaxy | (mJy) | (GHz) | var. | (K) | Note | |
| (1) | (2) | (3) | (4) | (5) | (6) | (7) |
| NGC 524 | 1.95/1.5 | 8.4/5 | 0.5 | … | 7.0106 | a |
| NGC 4552 | 102.1/99.5 | 8.4/5 | 0.0 | yes | 7.8108 | b,c |
| NGC 5354 | 8.6/8.7 | 5/2.3 | 0.0 | yes? | 1.9107 | … |
| NGC 5846A | 1.5/2.8 | 5/2.3 | 0.8 | yes? | 4.7106 | … |
| NGC 5846B | 0.6/0.8 | 5/2.3 | 0.4 | … | 2.3106 | … |
| NGC 5846C | 0.7/0.8 | 5/2.3 | 0.2 | … | 2.3106 | … |
| NGC 5846D | 1.9/0.3 | 15/5 | 1.8 | yes? | 7.6106 | d |
| NGC 5866 | 7.5/8.4 | 15/5 | 0.1 | … | 1.0108 | e |
| NGC 7331 | 0.121/0.234 | 5/1.5 | 0.5 | … | … | f |
Notes – (a) spectral index calculated using the 8.4 GHz, 2 .5 resolution peak flux density (Filho, Barthel & Ho 2002) and VLBA 5 GHz integrated flux density (this paper); (b) spectral index calculated using the 8.4 GHz, 2 .5 resolution peak flux density (Filho, Barthel & Ho 2002) and VLBA 5 GHz integrated flux density (Nagar et al. 2002); (c) brightness temperature calculated using the VLBA 5 GHz peak flux density (Nagar et al. 2002); (d) brightness temperature calculated using the VLBA 15 GHz peak flux density (this paper); (e) spectral index calculated using the VLA, 15 GHz, 0.15 resolution (Nagar et al. 2002) and VLBA 5 GHz integrated flux density (Falcke et al. 2000); (f) spectral index calculated using the VLA, 1.5 and 5 GHz, 2 resolution integrated flux density (Cowan, Romanishin & Branch 1994).
In a distance-limited sample of low luminosity Seyferts, LINERs and composite LINER/H ii galaxies imaged with the VLA (150 mas resolution), 50% of the sources showed flat spectrum radio cores (Nagar et al. 2002, 2000). Subsequent VLBA 5 GHz observations of a flux-limited subsample (16 sources with flux densities 3 mJy) yielded a 100% detection rate of low luminosity AGN (LLAGN; Nagar et al. 2002; see also Falcke et al. 2000). In comparison, the present sample of AGN candidates yielded a VLA radio core detection rate of 83% (ten of 12 sources with VLA data, Table 1). Follow-up VLBA observations (including NGC 4552; Nagar et al. 2002 and NGC 5866; Falcke et al. 2000) have revealed that 33% (five of 15) of the sources have mas-scale radio cores. These results translate to an overall radio detection rate of 8% (five of 65) among the entire composite LINER/H ii sample. The mas-scale non-detections were sources with VLA flux densities 3 mJy; thus, our results are consistent with those of Falcke et al. (2000) and Nagar et al. (2002). Moreover, as has been pointed out in these papers and discussed also in Filho et al. (2002), scaling arguments suggest that the radio non-detections could well be lower power versions of the radio detections and thus harder to detect. The true AGN fraction in composite LINER/H ii galaxies is likely to be higher.
Of the four VLA observed sample sources, only NGC 660 was slightly resolved at VLA A-array resolution. The present new and published VLBA data show unresolved cores in NGC 524 (Fig. 1a), NGC 4552 (Nagar et al. 2002) and NGC 5354 (Fig. 1b,c). Some sources also show evidence of radio variability, as seems the case for NGC 4552 (see discussion in Filho, Barthel & Ho 2000). Furthermore, all VLBA detected sample sources (including NGC 4552; Nagar et al. 2002 and NGC 5866; Falcke et al. 2000) show flat spectrum radio cores, although the inverted spectrum in NGC 524 is most probably an effect of resolution mismatch. The origin of the mas-scale radio emission is unlikely to be free-free emission. The detected radio cores show brightness temperatures several orders of magnitude above the thermal limit (104 K; Condon 1992). Moreover, as argued in Falcke et al. (2001), a thermal origin for the radio emission would imply much higher X-ray fluxes than those observed (see Section 4). Therefore, the combination of brightness temperatures in excess of 107 K and spectral indices 0.5 shows that the radio emission can be identified with (multi-component) non-thermal, self-absorbed synchrotron emission related to an accreting black hole.
On the other hand, the nature of the radio components associated with NGC 5846 is more complex. Our 2.3, 5, and 15 GHz VLBA maps of NGC 5846 show a multiple radio source roughly aligned in the North-South direction (Fig. 2a,b,c) – components NGC 5846A, NGC 5846B, NGC 5846C and NGC 5846D. Apparently we have resolved the single core observed with the VLA A-array (0 .25 resolution) and VLA C-array (2 .5 resolution; Filho, Barthel & Ho 2002). At 5 GHz, 11 mas separate the Southernmost (component A) from the Northern ones (components B and C). Component A appears in both the 2.3 GHz and 5 GHz maps (Fig 2.a,b), remaining unresolved at the latter frequency. However, it is not detected at 15 GHz (Fig 2.c), showing the source to be steep spectrum and/or variable. The steepness of the spectrum and high brightness temperature (Table 2) make it a candidate RSN (e.g. Tarchi et al. 2000). However, the compactness of the source, associated with the high brightness temperature and given its linear radio structure, suggests that component A is the variable radio core of NGC 5846.
3.2.2 Extended Radio Nuclear Components
There are three (NGC 5354, NGC 5846 and also NGC 4552; Nagar et al. 2002), perhaps four (see discussion on NGC 5866 in Falcke et al. 2000) sources in the sample which show extended structure on mas-scales.
Although unresolved on arcsec-scales (Filho, Barthel & Ho 2000; Nagar et al. 2000), and in our VLBA maps, a recent high signal-to-noise VLBA image of NGC 4552 (Nagar et al. 2002) revealed a core plus two-sided emission in the East and West direction.
Our 0 .2 resolution VLA map of NGC 5354 shows an unresolved core, whereas our longer integration VLBA map of this source shows about 4 mJy in symmetric double-sided emission to the East and West (Fig. 1c), suggesting the presence of jets cradling an AGN core. This extended emission is not seen, however, on our other VLBA shorter exposure maps, most probably due to low signal-to-noise.
Our first epoch 5 GHz VLBA map shows a triple source which we have designated as components NGC 5846A, B, and C. Furthermore, at 15 GHz we detect another component (NGC 5846D; Fig. 2c), about 60 mas from the 5 GHz radio position of NGC 5846A and which cannot be identified with any of the components in the 5 GHz map. NGC 5846A has been discussed in the previous subsection, but the nature of the latter three components is more difficult to constrain. Components B, C and D appear only at one frequency each, and most probably have an inverted (NGC 5846D)or steep spectrum (NGC 5846B and NGC 5846C), suggestive of optically thin synchrotron emission. The apparent inverted nature of the spectrum of NGC 5846D could also be due to radio variability. All three components also appear to have a somewhat amorphous, resolved morphology and high brightness temperatures typical for non-thermal sources (Table 2). Furthermore, they are more or less aligned with component A in the North-South direction. One scenario is that these components are compact SNRs near the center of the galaxy (e.g. Tarchi et al. 2000) or they may be emission associated with a radio jet.
4 Archival and Published X-ray Observations
For most of our sample sources, published X-ray data are available – they mainly refer to low resolution observations not suited to our purposes. Therefore, in this section we present the results of the analysis of archival and/or published high resolution X-ray Chandra data for the sample sources.
4.1 Observations and Data Reduction
Public Chandra ACIS-S archival data are available for seven of the sample sources, three of which have already been published (NGC 1055 and NGC 3627; Ho et al. 2001 and NGC 5846; Trinchieri & Goudfrooij 2002). NGC 5866 Chandra data have been published (Terashima & Wilson 2003) but are not as yet publicly available.
For reasons of self-consistency and homogeneity, all publicly available Chandra data were reduced and analyzed using the CIAO (version 2.2) and XSPEC (version 11.2) packages. We removed high background time by excluding events exceeding 3 of the mean image count rate. The energy range was restricted to the 0.410 keV band. We searched for X-ray nuclei coincident with the radio core positions (Filho, Barthel & Ho 2000, 2002; Nagar et al. 2000, 2002; Section 3) to within the positional accuracy of Chandra ( 1 ). When found, spectra were extracted from a circular region with a diameter of 2.5 (5 pixels on the ACIS image) in order to spatially match both the VLA C-array radio maps (Filho, Barthel & Ho 2000, 2002) and the regions from where the H luminosities were obtained (Ho, Filippenko & Sargent 1997). The background was extracted from an annulus around the source with an inner diameter of 5 .
Possible difficulties in pinpointing a hard X-ray nucleus can arise from the presence of ultraluminous X-ray sources (ULXs). Such confusion is minimized by the high resolution of Chandra. However, this possibility can not be totally excluded for galaxies like NGC 5846 (see Section 4.2), where several X-ray sources are detected in the nuclear region. With the possible exception of NGC 4552, pile-up effects should not be a problem, given the relatively low count rates. Even in the case of NGC 4552, a pile-up correction with a subsequent factor 2 difference in flux would not alter the following results.
For three of the X-ray sources (NGC 4552, NGC 5846, NGC 7331), the longer exposure times (30 ks), allowed a spectral analysis. We considered a power law model plus, for NGC 4552, a thermal plasma component (Raymond & Smith 1977). The column densities have been fixed to the Galactic values (Dickey & Lockman 1990). The fitted photon indices (1.5 – 2.3) are consistent with values obtained for LLAGN (Terashima & Wilson 2003). For sources observed with shorter exposure times, the count rates were converted to X-ray fluxes assuming a simple power-law spectrum with a photon index of 1.7 and Galactic absorption. Upper limits for non-detections were calculated after running a source detection procedure () on the full resolution Chandra image, with a threshold of 10-6 (4.7 level). Assuming a power-law (=1.7) and Galactic absorption, the upper limits were calculated to be equal to the flux of the weakest detected source on the image. Our results are consistent with those obtained by Ho et al. (2001) for NGC 1055 and NGC 3627 and Trinchieri & Goudfrooij (2002) for NGC 5846 (see Section 4.2).
4.2 Results of the X-ray Observations
The X-ray parameters as given by Chandra archival or published data are specified in Table 3.
Five of eight (63%) sample sources with available Chandra data were detected as having hard X-ray nuclear cores. Given the hypothetical weakness of the hard X-ray core, the three non-detections are most likely related to the low integration time compared to the observations of the other sources; these have = 1–2 ks (Table 3).
Below we give a brief description of the X-ray properties of the AGN candidates.
| Model | Fsoft | Fhard | log Lsoft | log Lhard | |||
|---|---|---|---|---|---|---|---|
| Galaxy | (ks) | (+kT) | (erg cm-2 s-1) | (erg cm-2 s-1) | (erg s-1) | (erg s-1) | Note |
| (1) | (2) | (3) | (4) | (5) | (6) | (7) | (8) |
| N 660 | 1.92 | 1.7 | 7.1210-15 | 1.3010-14 | 38.07 | 38.33 | a |
| N 1055 | 1.14 | 1.7 | 7.1110-15 | 1.3010-14 | 38.13 | 38.39 | a,b |
| N 3245 | 9.63 | 1.7 | 7.4310-15 | 1.3610-14 | 38.63 | 38.89 | a |
| N 3627 | 1.75 | 1.7 | 1.2010-14 | 2.1910-14 | 37.79 | 38.06 | a,b |
| N 4552 | 54.42 | 1.51 (0.95) | 4.8110-14 | 7.5810-14 | 39.21 | 39.41 | c |
| N 5846 | 29.86 | 2.29 | 3.3510-15 | 2.4410-15 | 38.51 | 38.37 | d,e |
| N 5866 | 2.25 | 2.0 | … | 6.3710-15 | … | 38.26 | a,f |
| N 7331 | 29.46 | 1.46 | 4.4610-15 | 1.1610-14 | 38.04 | 38.45 | g |
Notes – (a) Photon index fixed to the respective value; (b) also in Ho et al. (2001); (c) error in the photon index is 0.09; (d) also in Trinchieri & Goudfrooij (2002); (e) error in the photon index is 0.38; (f) quoted Chandra ACIS-S data from Terashima & Wilson (2003); (g) error in the photon index is 0.32.
NGC 660 The soft X-ray region is about 0 .5 in extent in the Northeast-Southwest direction, about the size and orientation of the radio emitting region (see Filho, Barthel & Ho 2002). The hard X-ray nuclear region, spatially coincident with the radio core (Filho, Barthel & Ho 2002), comprises only about 10 counts, such that no spectral fit was possible.
NGC 1055 No obvious X-ray source – hard or soft – was found on the Chandra image (see also Ho et al. 2001). A source detection procedure () was run in order to obtain an upper limit to the X-ray emission.
NGC 3245 There is a hard nuclear X-ray source coincident with the optical nucleus. The soft X-ray emission is resolved and extended ( 6 ) in the North-South direction.
NGC 3627 The soft X-ray emission extends over about 2 in a Northwest-Southeast direction, similar to the extent and orientation of the triple-radio source (Filho, Barthel & Ho 2000). No obvious nuclear X-ray source – hard or soft – was found on the Chandra image (see also Ho et al. 2001). Although the source detection procedure () found a source positionally coincident with the VLA core (Filho, Barthel & Ho 2000; Nagar et al. 2000, 2002), it is the weakest source on the image and we prefer to consider it an upper limit (see also Ho et al. 2001).
NGC 4552 The soft X-ray emission extends almost to the limits of the optical galaxy (2 ), exhibiting a somewhat hourglass structure. We find a strong hard X-ray nuclear source, coincident with the radio core position (Nagar et al. 2002; Filho, Barthel & Ho 2000). The spectrum of the nuclear source (1200 net counts) yields a satisfactory fit with a two component model – power law (=1.51) plus Raymond-Smith thermal plasma (kT=0.95 keV).
NGC 5846 The X-ray morphology of this source is complex (see also Trinchieri & Goudfrooij 2002), extending over more than 3 , almost to the limits of the optical galaxy. It exhibits two ‘spiral arms’, directed to the Sortheast and Southwest. There is a weak hard X-ray nucleus, coincident with the VLA radio core in NGC 5846, whose spectrum was fit with a power law (=2.29). The source we have identified with the nucleus coincides with the third most luminous X-ray source in NGC 5846, listed as source number 12 in Trinchieri & Goudfrooij (2002). Their quoted flux for this source is six times higher then our estimation because they convert counts to fluxes assuming a constant conversion factor. If we apply the same formulation, our results are consistent with theirs by a factor of 1.4.
NGC 5866 Recent published Chandra observations of this source failed to detect any hard X-ray emission from the nucleus (Terashima & Wilson 2003).
NGC 7331 The Chandra soft X-ray image of this galaxy shows several blotchy regions of emission, along about 3 , in a North-South direction, similar to the morphology of the optical galaxy and also the radio (Cowan, Romanishin & Branch 1994). Previous observations with ROSAT (Stockdale, Romanishin & Cowan 1998) have detected a luminous X-ray nucleus (few 1040 erg s-1). The Chandra observation has resolved the ROSAT emission into several X-ray sources and revealed a hard X-ray nucleus positionally coincident with the radio core detected in Cowan, Romanishin & Branch (1994). The spectrum of the nuclear source is fit with a one component power law (=1.46) model and the luminosity is two magnitudes lower (1038 erg s-1) than the ROSAT value.
5 Radio, Optical and X-ray Relations
In Table 4, at the end of the paper, we summarize the relevant properties for the sample sources from published, archival or new observations.
With the exception of NGC 3245 (Barth et al. 2001), there are no reliable dynamical black hole mass estimates for the sample sources. The next best method for determining black hole mass utilizes the central velocity dispersion. The correlation between black hole mass and central velocity dispersion is tight (Ferrarese & Merritt 2000; Gebhardt et al. 2000; Tremaine et al. 2002):
where is the luminosity-weighted stellar velocity dispersion measured at the effective radius. However, in this case we will simply use the value , the central velocity dispersion, since Gebhardt et al. (2000) have shown that the difference between and is only 10%.
As can be seen in Table 4, the dynamical black hole mass estimate for NGC 3245 (2108 M⊙; Barth et al. 2001) is in excellent agreement with the velocity dispersion estimate.
Nuclear B-band magnitudes have been calculated using the correlation found for low luminosity Seyfert 1s between M and the H (narrow plus broad) line luminosity (Ho & Peng 2001):
log (L
With the exception of the Type 1.9 (broad H emission present) source NGC 1161, all the sample sources are Type 2 (no broad-line emission). Therefore, we have used only the narrow H line luminosities taken from Ho, Filippenko & Sargent (1997a) to estimate M. In the case of composite galaxies, the derived M should be taken as an upper limit, due to contamination of the nucleus by stellar light and obscuration of the H line.
The radio-loudness parameter Ro, was calculated as the ratio of the 5 GHz, mas-scale radio (except for NGC 7331) to nuclear B-band luminosity.
In comparison, the radio-loudness parameter Rx was calculated as the ratio of the 5 GHz, mas-scale radio (except for NGC 7331) to hard X-ray luminosity, as formulated in Terashima & Wilson (2003).
The Eddington luminosity – the maximum luminosity output of an accreting object in an isotropic homogeneous system – was calculated as (in units of erg s-1):
LEdd=1.3 1038
5.1 Radio-Loudness
Objects with log R1 are commonly said to be radio-loud (e.g. Kellermann et al. 1994). Ho & Peng (2001) have recently challenged the long-thought notion that Seyfert galaxies are mainly radio-quiet galaxies. By using nuclear B-band magnitudes and radio powers, they found that as many as 60% of Seyferts are radio-loud.
An alternative method for parameterizing radio-loudness involves using the radio to hard X-ray ratio (Terashima & Wilson 2003). This method has the advantage of suffering less from extinction than the optical and allows the identification of the nucleus by means of high spatial resolution observations (e.g. Chandra). The equivalent radio-loud/radio-quiet boundary is established at log Rx=4.5 (Terashima & Wilson 2003).
In Fig. 3 we have plotted the logarithm of the Rx versus Ro parameters, where the solid lines denote the radio-loud/radio-quiet boundaries.

NGC 660, NGC 3245, NGC 3627 and NGC 7331 are found to be optically radio-quiet. The remaining sources are radio-loud, according to the log R1 criterion (e.g. Kellermann et al. 1994). In particular, all of the mas-scale radio cores, as shown by the 5 GHz VLBA observations, are radio-loud. Our results support those of Ho & Peng (2001), whereby radio-loud objects are also found in disk-dominated hosts (see Filho, Barthel & Ho 2000, 2002).
As can be seen from the plot as well as Table 4, with the possible exception of NGC 660, NGC 3245 and NGC 7331, all sources are radio-loud according to the log R4.5 criterion. In particular, all the detected mas-scale cores are radio-loud.
The Ro and Rx results are consistent, in that all mas-scale radio cores are radio-loud. However, differences in the remaining sources most likely arise from stellar contribution. It is to be noted, for example, the high H luminosities associated with NGC 660, NGC 3245, and NGC 3627.
5.2 Radio vs. H and [O i] Luminosity
It is well known that classical active galaxies like Seyferts, radio galaxies and LINERs display correlations between their radio and emission-line properties (Ho & Ulvestad 2001; Ulvestad & Ho 2001a; Zirbel & Baum 1995; Nagar et al. 2000, 2002). In particular, Nagar et al. (2000, 2002) also show that there is a correlation between the radio core luminosity and [O i]6300 line luminosity in LINERs and low luminosity Seyferts.
The radio luminosity of the present sample does not seem to correlate with H or with [O i]6300 luminosity, but because of the small sample and large intrinsic scatter in the correlation we are not able to draw any conclusions. The absence of a radio and emission-line correlation for composite sources had already been noted in Filho, Barthel & Ho (2002) using lower resolution, VLA radio observations.
5.3 X-Ray vs. H Luminosity
By examining the hard X-ray to H luminosity ratio, we wish to investigate whether the observed X-ray emission is related to the continuum source which powers the emission lines.
Such a correlation between the X-ray and H luminosities is observed in classical AGN such as Seyferts and quasars (Ward et al. 1988) and more recently in LINER 1s (Terashima, Ho & Ptak 2000; Ho et al. 2001), indicating that the AGN is capable of powering the optical emission lines. Typical ratios for LLAGN are in the range:
In Fig. 4 we plot the relation for our sample sources, where the X-ray luminosity is taken from the hard X-ray band. The shaded area defines ratios that are typical for AGN-powered sources.

All of the sources fall short of the empirical X-ray to H ratio observed in classical AGN, indicating that the observed X-ray luminosities are too low to generate the H lines. There are three possible scenarios – either the emission lines are powered by a source other than the AGN, the ionizing spectrum is different than that inferred, or the X-ray emission is heavily obscured at energies above 2 keV. The first possibility has already been investigated for example in the work of Maoz et al. (1998), whereby circumnuclear stellar populations may provide enough ionizing photons to explain the observed optical emission-line flux. However, as investigated by Ho, Filippenko & Sargent (2003; see also Ho et al. 2001), there is no evidence for the presence of young stellar clusters. Alternatively, it may be that the underlying ionizing spectrum is more complicated then assumed – most of the ionizing photons may occur in the extreme ultraviolet (EUV) and soft X-ray region, not in the hard X-rays. Powering of the emission lines from a central AGN could still occur if the hard X-ray flux were being heavily absorbed (Terashima, Ho & Ptak 2000; Terashima & Wilson 2003). If intrinsic X-ray luminosities are 1 – 2 orders of magnitude higher, then the X-ray to H ratio would be typical for LLAGN (Terashima & Wilson 2003). Although scattering is still a viable explanation, observations at energies above 10 keV are needed in order to observe any Compton-thick component.
5.4 Radio vs. X-ray Luminosity
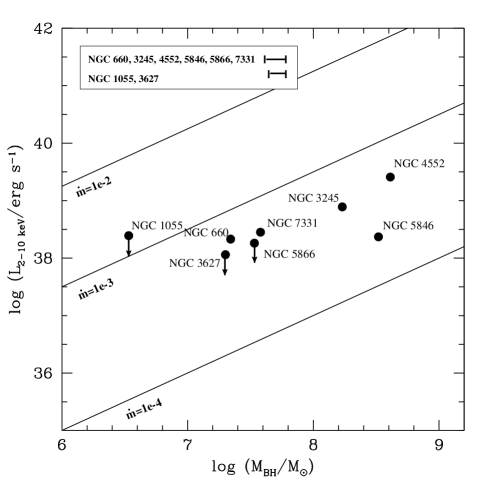
In Fig. 5 we plot the mas-scale radio core luminosity versus the hard X-ray core luminosity for the sample sources.

It can be seen from the plot that the detected mas-scale radio cores have L erg s-1, with two sources (NGC 4552 and NGC 5846) being firm Chandra detections (Table 3). Three of the sources with no mas-scale radio detection, however, show hard X-ray Chandra detections – NGC 660, NGC 3245 and NGC 7331. The Chandra observations of NGC 1055 and NGC 3627 (see also Ho et al. 2001) failed to detect any hard X-ray nuclear source, most likely due to the low integration time for the X-ray observations (2 ks; Table 3). Combining both the radio and X-ray data yields a 50% LLAGN detection rate among the sample sources or equivalently a 12% detection rate for the entire composite LINER/H ii galaxy sample.
NGC 7331 has a very low luminosity VLA radio core (Cowan, Romanishin & Branch 1994), 10 times that of Sgr A∗, and also the lowest hard X-ray core luminosity of all the sample sources, 104 times that of Sgr A∗. Similarities in the arcsec-scale radio properties – radio morphology and low radio flux density – of NGC 7331 and the cores that were not detected on mas-scales, indicate that NGC 7331 may actually be a prototype. These sources may all harbour submillijansky radio and low luminosity hard X-ray AGN cores, difficult to detect unless deep observations are obtained. Nevertheless, the results demonstrate the combined power of high resolution X-ray and radio imaging in LLAGN detection. We will return to this issue in the next section.
6 ADAFs or Jets?
We wish to use our observations to test models of radio and X-ray emission in low luminosity sources, namely advection-dominated accretion flows (ADAFs) and jet models. These models have been extensively applied to several other low luminosity sources, of which Sgr A∗ (Yuan, Markoff & Falcke 2002; Yuan, Quataert & Narayan 2003) and NGC 4258 (Yuan et al. 2002) are just two examples.
ADAFs (see reviews by Narayan, Mahadevan & Quataert 1998 and Quataert 2001) occur in the low accretion rate regime (macc(crit)10-1.6, where macc is given in dimensionless units of Eddington accretion rate). They are characterized by a low radiative efficiency, due to the advection of a significant amount of the energy into the black hole. ADAF theory has developed quickly in recent years with the inclusion of outflows and the possible existence of nonthermal electrons (see Yuan, Quataert & Narayan 2003 for a review). However, the analysis and therefore conclusions of this paper are based on the canonical ADAF model.
ADAFs may be able to account for correlations observed between the radio and X-ray emission. Particularly, this type of low radiative efficiency flow is supported by the highly sub-Eddington luminosities observed in our sources (; Table 4). Furthermore, ADAFs are naturally bright in radio due to radio synchrotron cooling and dim in the UV/optical regime due to the absence of a ‘blue bump’, the signature of a standard, optically thick but geometrically thin accretion disk (Shakura & Sunyaev 1973). Both of these ADAF characteristics conspire to produce ‘radio-loud’ cores.
In ADAFs the hard X-ray emission arises from bremsstrahlung and Compton scattering of synchrotron photons subject to self-absorption. As a result,the ADAF model predicts the correlation (Yi & Boughn 1998, 1999):
L
In Fig. 6 we plot the mas-scale radio core to hard X-ray ratio versus the hard X-ray core luminosity. In parentheses are the logarithms of the black hole mass plus error estimations, which include the error in velocity dispersion plus a 10% error associated with the conversion from to . The lines refer to the ADAF model prediction for different black hole masses, appropriately scaled to 5 GHz.

If the sources with upper limits to their mas-scale radio emission contain accreting black holes as is the case for NGC 7331 (due to a hard X-ray detection), then it is possible to explain their radio emission using the ADAF model, as originating in underfed black holes (m). However, for the mas-scale detected radio cores, the ADAF model overpredicts the black hole masses by a factor 10 or so (Table 4) even when the errors associated with the black hole mass determination are considered (Fig. 6). This suggests that the ADAF model is not entirely consistent with the observed radio to X-ray ratio unless the hard X-rays are heavily obscured (see Section 5.3).
In Fig. 7 we plot the mas-scale radio core luminosity versus the black hole mass. The solid lines refer to the ADAF prediction of:
L
where the relation has been appropriately scaled to 5 GHz. Typical errors in black hole mass are given.

The results show that composite sources with mas-scale radio cores have a radio luminosity to black hole mass ratio similar to low luminosity Seyferts and LINERs (log (LR/MBH) 1.14; Nagar et al. 2002). On the other hand, if the sources with no mas-scale radio detection harbour an AGN, then on average they should have lower radio to black hole ratios than the LLAGN in the Nagar et al. (2002) sample.
Fig. 7 also shows the ADAF model prediction for several accretion rates. Sources with upper limits to their mas-scale radio emission are consistent with low mass accretion rates (m). However, the detected mas-scale cores fall very close to the ADAF permitted accretion limit of m. These results suggest that the mas-scale radio cores show more radio emission than can perhaps be accounted for from an ADAF.
Plotted in Fig. 8 is the relation between the hard X-ray luminosity and the black hole mass. The solid lines refer to the predicted correlation in an ADAF model for various mass accretion rates:
LX MBH m
where x=2 for thermal emission. Again, typical errors in black hole mass determination are given in the plot.
The X-ray data are consistent with the ADAF model for low accretion rates (m), both for the sources with mas-scale upper limits and for those with mas-scale cores. This could suggest the same underlying mechanism for X-ray production in all sample sources – an ADAF. In fact, in two of the mas-scale radio cores where an X-ray spectral fit was possible (NGC 4552 and NGC 7331; see Table 3), the X-ray photon index is consistent with the predicted ADAF value of 1.4.
In summary, if we take NGC 7331 as a prototypical submillijansky AGN core, then scaling arguments suggest that an ADAF could simultaneously explain both the radio and X-ray emission in the sources with no mas-scale radio detection. In fact, these sources may in fact be ‘bare’ ADAFs, where the radio and X-ray contribution is coming mainly from the accretion flow. The absence of a jet or of an energetically significant contribution of a jet to the radio emission is not, however, clear. It may be that, like in M 81, the jet is present but very compact and difficult to detect (Bietenholz, Bartel & Rupen 2000).
On the other hand, thermal ADAF models predict inverted radio spectra ( 0.4; Narayan, Mahadevan & Quateart 1998; see also Yuan, Quataert & Narayan 2003) while the mas-scale sources possess flat spectrum radio cores (Table 2). Modified ADAF models that include convection (Ball, Narayan & Quataert 2001) or outflows (Quataert & Narayan 1999) do not provide satisfactory solutions, since the predicted spectral slopes are roughly the same as in the canonical ADAF models (Quataert & Narayan 1999). 222The inclusion of power-law electrons has been recently proven to produce a flatter radio spectra (see Yuan, Quataert & Narayan 2003). Therefore, while the X-ray emission in mas-scale radio cores may be ADAF-powered, the radio emission may require another emission mechanism.
The most likely scenario is that the radio emission in the mas-scale detected radio cores is a result of an ADAF-type accretion (or variants thereof) plus a compact jet or outflow (Quataert et al. 1999; Yuan 2000; Falcke et al. 2001; Nagar, Wilson & Falcke 2001; Ulvestad & Ho 2001b; Nagar et al. 2002). The consideration of a jet is not ad-hoc since we detect extended emission in 4 out of the 5 mas-scale radio cores. Furthermore, the addition of a self-absorbed jet component to an ADAF core may ‘flatten’ out the spectral index to the observed values. In fact, flat spectrum radio emission in ‘classical’ AGN are commonly attributed to the presence of jets.
In a recent paper, Falcke, Körding & Markoff (2003; see also Merloni et al. 2003) investigated an accretion rate-dependent scheme for black hole-powered sources, whereby sub-Eddington systems are predicted to be dominated by emission from a relativistic jet. Such an idea was suggested already in Falcke & Biermann (1995), and a jet model was shown to analytically predict the radio/X-ray correlation seen in the low/hard state of the black hole candidate X-ray binary (XRB) GX 339–4 (Markoff et al. 2003). This correlation has now been seen in many other low/hard state XRBs, and is likely universal (Gallo, Fender & Pooley 2003). Falcke, Körding & Markoff (2003; see also Merloni et al. 2003) show that this correlation can be scaled with black hole mass to extend to certain classes of AGN as well. This leads to a radio/X-ray/black hole mass fundamental plane which unifies diverse sources such as FR I radio galaxies, LINERs and XRBs as jet-dominated (see Fig. 1 in Falcke, Körding & Markoff 2003).
This scaling relation is given by (eq. 7; Falcke, Körding & Markoff 2003):
L L M
where and are the radio and X-ray spectral indices and is a function of both and . We here apply the black hole mass scaling relation in order to investigate the presence of an energetically dominant jet in our sample sources. We have extrapolated our 2–10 keV luminosities (Table 3) to 3–9 keV assuming an average =0.6 (1) and =-0.15 (Falcke, Körding & Markoff 2003). The assumption of a spectral index of =1.6 (=0.6) is consistent within 10% of values obtained using our actual tabulated spectral indices (Table 3) and therefore does not alter the general result.
In Fig. 9 we have plotted the scaled correlation normalized to the 6 M⊙ black hole mass of GX 339–4. Typical errors in the ‘black hole mass-corrected’ X-ray luminosity are conservatively estimated to be of the order of 0.08 in logarithmic units of luminosity.
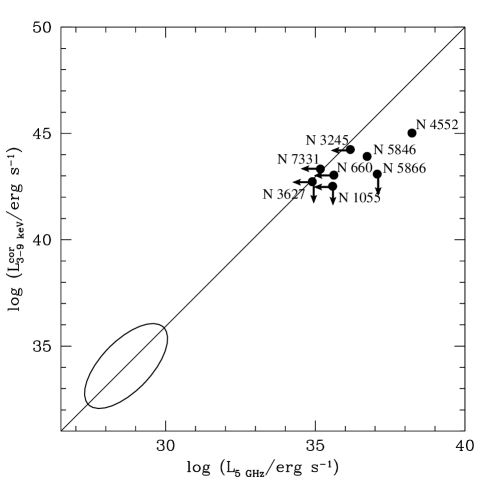
In addition to the scenario discussed above, a jet model alone seems to interpret the present data as well. It is noteworthy that the mas-scale detected sources fall very close to the jet model predicted relation. The deviation of the sources NGC 4552, NGC 5846 and NGC 5866 is in the direction of excess radio emission, which is entirely consistent with the jet model. The scaling relation is valid for the compact inner jet core while these sources are known to possess jet emission on mas-scales; hence, the radio flux density likely includes some extended jet emission.
7 Conclusions
We have embarked on a high resolution X-ray and radio imaging study of a sample of composite LINER/H ii galaxies known to exhibit AGN-like properties. Five of the 16 sample sources possess milliarcsecond radio cores, four of which also show extended radio emission. Two of the sources with no milliarcsecond radio detection were found to possess hard X-ray nuclear cores. The 50% detection rate of radio and/or hard X-ray nuclei support the view that these AGN candidate composite H ii galaxies host weak AGN central engines. When considering the entire composite LINER/H ii sample, these results yield an overall 12% detection rate. Modeling of the radio and X-ray emission suggests that the mas-scale radio detected sources exhibit an energetically important contribution from a jet, associated with a sub-Eddingtion accreting black hole. The sources that were not detected on mas-scales, however, appear consistent with the radio and X-ray emission coming mainly from the low radiative efficiency accretion flow (ADAF). Nonetheless, even in the cases where the presence of an AGN is irrefutable, this AGN cannot be responsible solely for powering the observed emission lines unless the X-ray flux is heavily obscured.
Acknowledgements.
M. E. F. acknowledges support from the Fundação para a Ciência e Tecnologia, Ministério da Ciência e Ensino Superior, Portugal through the grant PRAXIS XXI/BD/15830/98 and SFRH/BDP/11627/2002. We would like to thank Heino Falcke for the extensive discussions on ADAF and jet models and Jim Ulvestad for providing us with calibrated VLA data for NGC 660. We wish also to thank the anonymous referee for his helpful comments. This research has made extensive use of NED (NASA/IPAC Extragalactic Database), which is operated by the Jet Propulsion Laboratory, California Institute of Tecnology, under contract with the National Aeronautics and Space Administration, LEDA (Lyon/Meudon Extragalactic Database), HYPERCAT and the Chandra data archive. The VLA and the VLBA are facilities of the National Radio Astronomy Observatory (NRAO) which is a facility of the National Science Foundation operated under cooperative agreement by Associated Universities, Inc.References
- (1) Ball, G. H., Narayan, R., & Quataert, E. 2001, ApJ, 552, 221
- (2) Barth, A. J., Sarzi, M., Rix, H. -W., Ho, L. C., Filippenko, A. V., & Sargent, W. L. W. 2001, ApJ, 555, 685
- (3) Bietenholz, M. F., Bartel, N., & Rupen, M. P. 2000, ApJ, 532, 895
- (4) Condon, J. J.1992, ARA&A, 30, 575
- (5) Corbel, S. , Nowak, M., Fender, R. P., Tzioumis, A. K., & Markoff, S. 2003, A&A, 400, 1007
- (6) Cowan, J. J., Romanishin, W., & Branch, D. 1994, ApJ, 436, L139
- (7) Dickey, J. M., & Lockman, F. J. 1990, ARA&A, 28, 215
- (8) Falcke, H., & Biermann, P. L. 1995, A&A, 293, 665
- (9) Falcke, H., Körding, E., & Markoff, S. 2003, A&A sumbitted
- (10) Falcke, H., Nagar, N. M., Wilson, A. S., Ho, L. C., & Ulvestad, J. S. 2001, in Black Holes in Binaries and Galactic Nuclei, ed. L. Kaper, E. P. J. van den Heuvel, P. A. Woudt, (Springer), 218
- (11) Falcke, H., Nagar, N. M., Wilson, A. S., & Ulvestad, J. 2000, ApJ, 542, 197
- (12) Ferrarese, L., & Merritt, D. 2000 ApJ, 539, L9
- (13) Filho, M. E., Barthel, P. D., & Ho, L. C. 2000, ApJS, 129, 93
- (14) Filho, M. E., Barthel, P. D., & Ho, L. C. 2002, A&A, 385, 425
- (15) Gebhardt, K., et al. 2000, ApJ, 539, L13
- (16) Ho, L. C. 1996, in The Physics of LINERs in View of Recent Observations, ed. M. Eracleous, A. Koratkar, C. Leitherer, & L. Ho, (San Francisco:ASP), 103
- (17) Ho, L. C., Filippenko, A. V., & Sargent, W. L. W. 1997, ApJS, 112, 315
- (18) Ho, L. C., Filippenko, A. V., & Sargent, W. L. W. 2003, ApJ, 583, 159
- (19) Ho, L. C., & Peng, C. Y. 2001, ApJ, 555, 650
- (20) Ho, L. C., & Ulvestad, J. S. 2001, ApJS, 133, 77
- (21) Ho, L. C. et al. 2001, ApJ, 549, L51
- (22) Kellerman, K. I., Sramek, R. A., Schmidt, M., Green, R. F., & Shaffer, D. B. 1994, AJ, 108, 1163
- (23) Maoz, D., Koratkar, A., Shields, J. C., Ho, L. C., Filippenko, A. V., & Sternberg, A. 1998, AJ, 116, 55
- (24) Markoff, S., Nowak, M., Corbel, S., Fender, R., & Falcke, H. 2003, A&A, 397, 645
- (25) Merloni, A., Di Matteo, T., & Heinz, S. astro-ph/0305261
- (26) Nagar, N. M, Falcke, H., Wilson, A. S., & Ho, L. C. 2000, ApJ, 542, 186
- (27) Nagar, N. M, Falcke, H., Wilson, A. S., & Ulvestad, J. S. 2002, A&A, 392, 53
- (28) Nagar, N. M., Wilson, A. S., & Falcke, H. 2001, ApJ, 559, 87
- (29) Narayan, R., Mahadevan, R., & Quataert, E. 1998, in The Theory of Black Hole Accretion Discs, ed. M. A. Abramowicz, G. Björnsson, & J. E. Pringle, (Cambridge:Cambridge Univ. Press), 148
- (30) Perley, R. A., Schwab, F. R., & Bridle, A. H. 1989, in Synthesis Imaging in Radio Astronomy: A Collection of Lectures from the Third NRAO Synthesis Imaging Summer School (San Francisco:ASP), 528
- (31) Quataert, E. 2001, in Probing the Physics of Active Galactic Nuclei by Multiwavelength Monitoring, ed. B. M. Peterson, R. S. Polidan, & R. W., Pogge (San Francisco:ASP), 71
- (32) Quataert, E., Di Matteo, T., Narayan, R., & Ho, L. C. 1999, ApJ, 525, L89
- (33) Quataert, E. & Narayan, R. 1999, ApJ, 520, 298
- (34) Raymond, J.C., & Smith, B.W. 1977, ApJS, 35, 419
- (35) Shakura, N. I., & Sunyaev, R. A. 1973, A&A 24, 337
- (36) Stockdale, C. J., Romanishin, W., Cowan, J. J. 1998, ApJL, 508, 33
- (37) Tarchi, A., Neininger, N., Greve, A., Klein, U., Garrington, S. T., Muxlow, T. W. B., Pedlar, A., & Glendenning, B. E. 2000, A&A, 358, 95
- (38) Terashima, Y., Ho, L. C., & Ptak, A. F. 2000, ApJ, 539, 161 Terashima, Y., & Wilson, A. S. 2003, ApJ, 583, 145
- (39) Tremaine, S., et al. 2002, ApJ, 574, 740
- (40) Trinchieri, G., & Goodfrooij, P. 2002, A&A, 386, 472
- (41) Ulvestad, J. S., & Ho, L. C. 2001a, ApJ, 558, 561
- (42) Ulvestad, J.S., & Ho, L.C. 2001b, ApJ, 562, L133
- (43) Ward, M. J., Done, C., Fabian, A. C., Tennant, A. F., & Shafer, R. A. 1988, ApJ, 324, 767
- (44) Weiler, K. W., van der Hulst, J. M., Sramek, R. A., & Panagia, N. 1981, ApJ, 243, L151
- (45) Yi, I. & Boughn, S. P. 1999, ApJ, 515, 576
- (46) Yi, I. & Boughn, S. P. 1998, ApJ, 499, 198
- (47) Yuan, F. 2000, MNRAS, 319, 1178
- (48) Yuan, F., Markoff, S., & Falcke, H. 2002, A&A, 383, 854
- (49) Yuan, F., Markoff, S., & Falcke, H., Biermann, P. L. 2002, A&A, 391, 139
- (50) Yuan, F., Quataert, E., & Narayan, R. astro-ph/0304125
- (51) Zirbel, E. L., & Baum, S. A. 1995, ApJ, 448, 521
Table 1: Map parameters (published or new) of the sample sources. Col. 1: Source name. Col. 2: Observing frequency. Col. 3: Integration time. Col. 4: noise level of the image. Col. 5: Restoring beam or resolution. Col. 6: Position angle of the beam. Col. 7: Peak radio flux density. Col. 8: Integrated radio flux density. Col. 9 and 10: Radio position. Col. 11: Deconvolved source size. Col. 12: Position angle of the source. Value in parenthesis is an uncertain value. Col. 13: Note. Letter is the observing epoch and number is the reference (published or new) from which the radio data were taken. Beamsize P.A. Fpeak Fint RA(J2000) Dec(J2000) Size P.A. Galaxy (GHz) (min) () (arcsec2) (deg) () (mJy) ( ) ( ) (arcsec2) (deg) Note (1) (2) (3) (4) (5) (6) (7) (8) (9) (10) (11) (12) (13) VLA Obs. NGC 660 8.4 270 0.01 0.210.21 39.90 0.5 2.3 01 43 02.32 +13 38 44.9 0.460.36 174.30 1,a 15 16 0.20 0.15 … 0.9 0.9 … … … … 2 NGC 1055 15 16 0.20 0.15 … 1.8 1.8 … … … … 2 NGC 3627 15 16 0.20 0.15 … 1.1 2.9 11 20 15.00 +12 59 29.6 … … 2 NGC 4216 15 16 0.20 0.15 … 1.2 1.3 12 15 54.37 +13 08 58.0 … … 2 NGC 4419 15 16 0.20 0.15 … 2.7 3.6 12 26 56.45 +15 02 50.7 … … 2 NGC 4527 15 16 0.20 0.15 … 1.1 1.1 … … … … 3 NGC 4552 8.4 10 0.15 0.250.21 27.79 102.1 102.2 12 35 39.80 +12 33 22.7 … … 4,b 15 16 0.20 0.15 … 58.1 58.6 12 35 39.80 +12 33 22.7 … … 2 NGC 5354 8.4 10 0.12 0.260.24 73.41 9.7 10.1 13 53 26.70 +40 18 10.0 … 15.73 4,b NGC 5838 8.4 10 0.07 0.310.23 36.77 1.6 1.6 15 05 26.24 +02 05 57.4 … … 4,b NGC 5846 8.4 10 0.10 0.300.23 35.29 6.3 6.4 15 06 29.28 +01 36 20.4 … … 4,b NGC 5866 15 16 0.20 0.15 … 7.1 7.5 15 06 29.49 +55 45 47.5 … … 3 NGC 7331 1.5 … 0.03 1.81.4 … 0.2 0.23 22 37 04.06 +34 24 56.9 … … 5 5 … 0.02 1.81.4 … 0.1 0.12 22 37 04.06 +34 24 56.9 … … 5 15 16 0.20 0.15 … 1.1 1.1 … … … … 2 Beamsize P.A. Fpeak Fint RA(J2000) Dec(J2000) Size P.A. Galaxy (GHz) (min) () (mas2) (deg) () (mJy) ( ) ( ) (mas2) (deg) Note (1) (2) (3) (4) (5) (6) (7) (8) (9) (10) (11) (12) (13) VLBA Obs. NGC 410 5 180 0.08 3.61.9 7.91 0.4 0.4 … … … … 4,c NGC 524 5 180 0.08 4.52.0 9.89 0.9 1.5 01 24 47.746 +09 32 20.14 2.81.8 168.02 4,c NGC 660 5 180 0.09 4.41.9 8.73 0.5 0.5 … … … … 4,d NGC 1055 5 180 0.08 5.01.9 16.32 0.4 0.4 … … … … 4,c NGC 1161 5 180 0.08 3.21.8 10.47 0.5 0.5 … … … … 4,d NGC 3245 5 172 0.09 3.81.7 4.70 0.5 0.5 … … … … 4,e NGC 3627 5 96 0.09 3.61.4 8.62 0.3 0.3 … … … … 4,f NGC 4216 5 168 0.08 4.51.8 9.15 0.4 0.4 … … … … 4,g NGC 4419 5 168 0.08 4.41.8 8.87 0.4 0.4 … … … … 4,g NGC 4527 5 156 0.09 4.61.6 12.64 0.5 0.5 … … … … 4,e NGC 4552 5 52 0.20 2.91.2 2.40 99.5 99.5 12 35 39.807 +12 33 22.83 … … 2 NGC 5354 2.3 40 0.17 7.63.8 3.44 4.5 8.7 13 53 26.713 +40 18 09.93 5.73.2 102.02 4,g 5 105 0.11 2.31.6 6.74 2.4 6.6 13 53 26.712 +40 18 09.94 3.90.7 90.95 4,f 5 48 0.14 3.51.7 8.05 4.5 8.6 13 53 26.712 +40 18 09.93 2.51.5 103.11 4,g 15 36 0.25 1.20.6 7.43 1.3 1.3 … … … … 4,g NGC 5838 5 96 0.11 3.41.4 1.26 0.3 0.3 … … … … 4,f NGC 5846A 2.3 48 0.16 9.23.7 0.51 0.8 2.8 15 06 29.292 +01 36 20.35 9.07.8 173.92 4,e NGC 5846A 5 112 0.05 3.41.4 0.71 0.6 1.1 15 06 29.292 +01 36 20.34 2.81.3 7.85 4,f NGC 5846A 5 48 0.12 4.71.8 6.65 1.2 1.5 15 06 29.292 +01 36 20.34 2.32.3 … 4,e NGC 5846B 5 112 0.05 3.41.4 0.71 0.3 0.6 15 06 29.292 +01 36 20.44 4.51.2 175.27 4,f NGC 5846C 5 112 0.05 3.41.4 0.71 0.3 0.7 15 06 29.292 +01 36 20.45 5.21.7 147.98 4,f NGC 5846D 15 48 0.16 1.70.7 9.44 1.4 1.9 15 06 29.292 +01 36 20.40 1.30.2 158.17 3,e NGC 5866 5 45 0.20 … … 7.0 8.4 15 06 29.499 +55 45 47.57 … (11) 6 References – (1) Filho, Barthel & Ho 2002 from calibrated dated supplied by Dr. Jim Ulvestad; (2) Nagar et al. 2002; (3) Nagar et al. 2000; (4) this paper; (5) Cowan, Romanishin & Branch 1994; (6) Falcke et al. 2000. Observations – (a) 1995 July 13; (b) 1999 Sept. 05; (c) 2001 Sept. 01; (d) 2001 Sept. 17; (e) 2001 Oct. 06; (f) 2000 June 22; (g) 2001 Sept. 08.
Table 4: Summary of the AGN candidate properties (published, archival or new). Col. 1: Source name. Col. 2: Adopted distance for H0=75 km s-1 Mpc-1 (Tully 1988 or Ho, Filippenko & Sargent 1997a). Col. 3–5: Extinction-corrected [OI]6300, H, and H line luminosity (Ho, Filippenko & Sargent 1997a, 2003). Col. 6: Published or new high resolution VLBA 5 GHz (or VLA; see footnote) radio core luminosity. When multiple 5 GHz, VLBA observations are available, the longest integration time observations is quoted. Col. 7: Archival and/or published Chandra hard X-ray (2-10 keV) nuclear luminosity. Col. 8: Nuclear B-band magnitude. Col. 9: Logarithm of the radio to nuclear B band ratio. Col. 10: Logarithm of the radio to hard X-ray ratio. Col. 11: Logarithm of the X-ray to H ratio. Col. 12: Central velocity dispersion (Lyon/Meudon Extragalactic Database or HYPERCAT – NGC 660, 3627, 4419, 4527, and 5354). Col. 13: Estimated black hole mass obtained from the velocity dispersion. Col. 14: Logarithm of the Eddington luminosity. Col. 15: Logarithm of the X-ray to Eddingtion luminosity ratio. log L([O i]) log L(H) log L(H) log LR log LX M MBH log LEdd Galaxy (Mpc) (erg s-1) (erg s-1) (erg s-1) (erg s-1) (erg s-1) (mag) (km s-1) (M⊙) (erg s-1) (1) (2) (3) (4) (5) (6) (7) (8) (9) (10) (11) (12) (13) (14) (15) N 410 70.6 38.4 39.43 39.46 37.08 … 12.82 1.6 … 2.6 285 5.5108 46.85 … N 524 67.0 37.7 38.58 38.08 37.61 … 8.76 3.7 … … 245 3.1108 46.60 … N 660 11.8 39.1 40.41 39.27 35.62 38.33 12.26 0.3 2.7 2.1 128 2.2107 45.46 7.1 N 1055 12.6 36.7 37.92 … 35.58 38.39 … … … 0.5 80 3.4106 44.65 6.3 N 1161 25.9 38.2 39.01 38.39 36.31 … 9.68 2.1 … 2.3 285 5.6108 46.86 … N 3245 22.2 39.0 40.03 39.35 36.17 38.89 12.50 0.8 2.7 1.1 211 1.7108 46.34 7.5 N 3627 6.6 38.3 39.16 38.39 34.90 38.06 9.68 0.7 3.2 1.1 124 2.0107 45.44 7.4 N 4216 16.8 38.0 38.89 38.25 35.83 … 9.26 1.8 … … 219 1.9108 46.39 … N 4419 16.8 38.1 40.72 39.61 35.83 … 13.26 0.2 … … 101 8.7106 45.05 … N 4527 13.5 39.0 40.12 39.12 35.74 … 11.82 0.6 … … 214 1.8108 46.37 … N 4552a 16.8 37.7 38.55 38.05 38.23 39.41 8.68 4.4 1.2 0.9 264 4.1108 46.73 7.3 N 5354 32.8 37.9 38.71 38.26 37.63 … 9.29 3.5 … … 221 2.0108 46.41 … N 5838 28.5 37.7 … … 36.17 … … … … … 297 6.6108 46.93 … N 5846b,c 28.5 38.0 39.01 38.43 36.73 38.37 9.79 2.4 1.6 0.7 250 3.3108 46.63 8.3 N 5866d 15.3 37.9 38.82 37.99 37.07 38.26 8.50 3.3 1.2 0.6 142 3.4107 45.65 7.4 N 7331e 14.3 37.7 38.73 38.14 35.17 38.45 8.94 1.2 3.3 0.3 146 3.8107 45.69 7.2 a VLBA, 5 GHz, 2 mas resolution radio core luminosity from Nagar et al. (2002). b VLBA, 5 GHz, 2 mas resolution radio core luminosity given for the hypothetical core – component A. c Hard X-ray (2-10 keV) luminosity from Terashima & Wilson (2003). d VLBA, 5 GHz, 2 mas resolution radio core luminosity from Falcke et al. (2002). e VLA, 5 GHz, 2 resolution radio core luminosity from Cowan, Romanishin & Branch (1994).
(a)
(b) (c)
(a) (b)
(c)