N2H+ Observations of Molecular Cloud Cores in Taurus
Abstract
N2H+ observations of molecular cloud cores in Taurus with the Nobeyama 45 m radio telescope are reported. We compare “cores with young stars” with “cores without young stars”. The differences in core radius, linewidth, and core mass are small. Linewidth is dominated by thermal motions in both cases. N2H+ maps show that the intensity distribution does not differ much between cores without stars and those with stars. This is in contrast to the result previously obtained in H13CO+ toward Taurus molecular cloud cores. Larger degree of depletion of H13CO+ in starless cores will be one possible explanation for this difference. We studied the physical state of molecular cloud cores in terms of “critical pressure” for the surface (external) pressure. There is no systematic difference between starless cores and cores with stars in this analysis. Both are not far from the critical state for pressure equilibrium. We suggest that molecular cloud cores in which thermal support is dominated evolve toward star formation by keeping close to the critical state. This result is in contrast with that obtained in the intermediate-mass star forming region OMC-2/3, where molecular cloud cores evolve by decreasing the critical pressure appreciably. We investigate the radial distribution of the integrated intensity. Cores with stars are found to have shallow ( to ) power-law density profiles.
1 Introduction
It is of great interest when and how the process of star formation takes place. Nakano (1998) theoretically studied the condition for the onset of star formation on the basis of the virial theorem. For the surface (external) pressure , we can define the critical pressure , which is a function of the effective sound speed and the mass of the molecular cloud core (Spitzer, 1968; Nakano, 1998). There are two equilibria if , whereas there is no equilibrium if . Nakano (1998) suggested that dissipation of turbulence in the core will result in the decrease in , which will lead to the onset of star formation because of the absence of equilibrium state. Aso et al. (2000) observed the intermediate-mass star forming region OMC-2/3 in Orion by using the H13CO+ line. They found that cores without young stars tend to have and that cores with young stars tend to have . This fact suggests that dissipation of turbulence leads to the onset of star formation in OMC-2/3.
It seems that molecular cloud cores in low-mass star forming regions like Taurus have lower surface (external) pressure than those in massive or intermediate-mass star forming regions like Orion(Tatematsu et al., 1993). The present study is aimed to investigate whether dissipation of turbulence plays an important role also in low-mass star forming regions. In low-mass star forming regions, the choice of the molecular-line tracers is crucial. It is known that molecular depletion seems to be serious for CO, HCO+, CCS, CS, and their isotopomers in starless, cold molecular cloud cores (Caselli et al., 1999; Aikawa et al., 2001; Bergin et al., 2001, 2002; Li et al., 2002; Tafalla et al., 2002; Lee et al., 2003; Shematovich et al., 2003). On the other hand, N-bearing molecules, NH3 and N2H+ do not show strong evidence of depletion, except for the very center of the cores (Bergin et al., 2001, 2002; Caselli et al., 2002b; Tafalla et al., 2002; Lee et al., 2003; Shinnaga et al., 2003). Furthermore, although H13CO+ is one of the popular tracers of the molecular cloud core, it is known that the linewidth of the H13CO+ core can be broaden by the molecular outflow, and this is more serious in studying low-mass star forming regions (Aso et al., 2000). We employ N2H+, which is less affected by depletion or molecular outflow. N2H+ is found to trace the quiescent molecular gas (Womack et al., 1993; Bachiller & Perez Gutierrez, 1997), and this choice would minimize the influence of the molecular outflow.
The target molecular cloud cores are those observed by Mizuno et al. (1994) in H13CO+. Molecular cloud cores associated with young stars are called “cores with stars.” Molecular cloud cores not associated with young stars are called “starless cores.” Our samples contain three starless cores and four cores with stars. We happen to detect one new starless core during the observations. The distances to cores in Taurus are assumed to be 140 pc. At this distance, 1 arcmin corresponds to 0.041 pc.
2 Observations
We carried out our observations by using the 45 m radio telescope of Nobeyama Radio Observatory from 2003 January 7 to 9. The receiver front end was the 25-element double-sideband focal-plane SIS receiver BEARS, which has a beam separation of 411. We observed molecular cloud cores in N2H+ at 93.1737767 GHz (Caselli et al., 1995). We mapped regions by shifting the telescope by half the beam separation, so the final map consists of data on a 2055 spacing grid. During the observations, one element of BEARS was not available due to a technical problem, so we used 24 elements. The half-power beamwidth of the element beams of BEARS was estimated to be 17804 at 93 GHz, which was close to the data grid spacing. The employed receiver back end was a digital autocorrelator. We selected the spectral resolution to be 37.8 kHz (corresponding to 0.12 km s-1). Spectra were obtained in the position-switching mode. To compensate for the daily intensity scale variation, we observed a local intensity peak at R.A. (J2000) = , Decl.(J2000) = near Orion KL with BEARS every day. Furthermore, we observed this intensity peak using a single-sideband SIS receiver S100 to calibrate the gain of each BEARS element and to establish the absolute intensity scale. The line intensity is reported in terms of the corrected antenna temperature to be observed with the S100 receiver in this paper. The main-beam efficiency with S100 at 93 GHz is estimated to be 0.515, by interpolating the measurements at 86 and 100 GHz by the observatory. The telescope pointing was established by observing the SiO maser source NML Tau at 43 GHz every 11.5 hours during the observations. The data were reduced by using the software package NewStar of Nobeyama Radio Observatory and IDL of Research Systems, Inc.
Prior to our observations, sixty-three low-mass molecular cloud cores have been observed in N2H+ by Caselli et al. (2002c), but with lower angular resolution (54 arcsec). We will refer to their results to secure our discussion on the basis of our observations toward the eight cores but with better angular resolution (186 beam and 2055 grid). Since the typical radius of the molecular cloud core is about 50 arcsec in the region, the improvement in spatial resolution helps us to derive the physical parameters more precisely.
3 Results
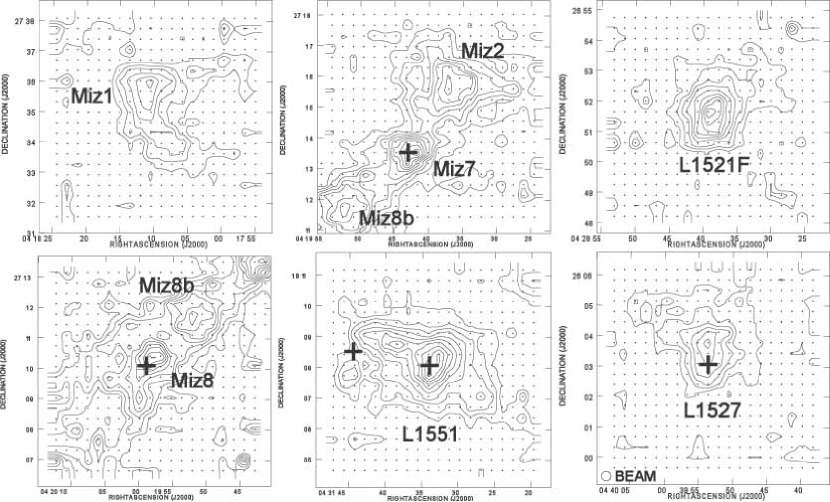
Figure 1 shows that the distribution of the velocity-integrated intensity of the main N2H+ component (, = 2, 31, 2) toward the eight molecular cloud cores. The core associated with L1551 IRS5 (L1551) is 23 times as intense as the other cores, and we double the contour interval for this source for clarity. We use the main component rather than the optically thinner components to obtain better signal-to-noise ratios. For checking, we have also made the integrated intensity map of the , = 0, 11, 2 component (not shown, the map quality is much worse), and have confirmed that the intensity peak position is consistent in general. As shown later, the optical depth is not very large even for the main component ( unity). The positions of the intensity maxima of the cores are summarized in Table 1. The core name with the prefix of Miz refers to the core number in Mizuno et al. (1994). Core Miz8b is newly found in our observations. Core L1527 is associated with a Class 0 protostar, while cores Miz7, Miz8, and, L1551 are associated with Class I protostars. These are “cores with stars.” Furthermore, a Class 0 protostar L1551 NE (Barsony & Chandler, 1993) is located near the core boundary of L1551, but its relationship to the N2H+ core is not clear in our map (see Saito et al. (2001); Yokogawa et al. (2003) for a detailed study of this region in C18O and CS). Cores Miz1, Miz2, L1521F, and Miz8b are “starless cores”.
The basic physical parameters of the cores are summarized in Table 2. The HWHM core radius is measured as ( is the core area S at the half maximum), and then corrected for the telescope beam size. There is no remarkable difference in core radius between starless cores ( = 0.0350.004 pc) and core with stars ( = 0.0310.006 pc). The study of Caselli et al. (2002c) shows that cores with stars are slightly larger than starless cores, but difference is not large. Our result is in marked contrast with that of Mizuno et al. (1994) in H13CO+, in which cores with stars tend to be more compact. Depletion of H13CO+ will be a plausible explanation, because it is known that N2H+ is more robust for depletion than H13CO+ (Bergin et al., 2001; Caselli et al., 2002b; Lee et al., 2003). It is suggested that depletion becomes less prominent in cores with stars because molecules evaporate from the dust grain due to radiation and outflow from the newly formed star (Langer et al., 2000). If some molecule is depleted in starless cores, we expect that intensity tends to be weak in starless cores, and the radial intensity profile is more flat-topped (because depletion is more effective at the high-density core center), causing larger radius in starless cores. The tendency observed in H13CO+ can be explained if this molecule is depleted substantially only in starless cores.
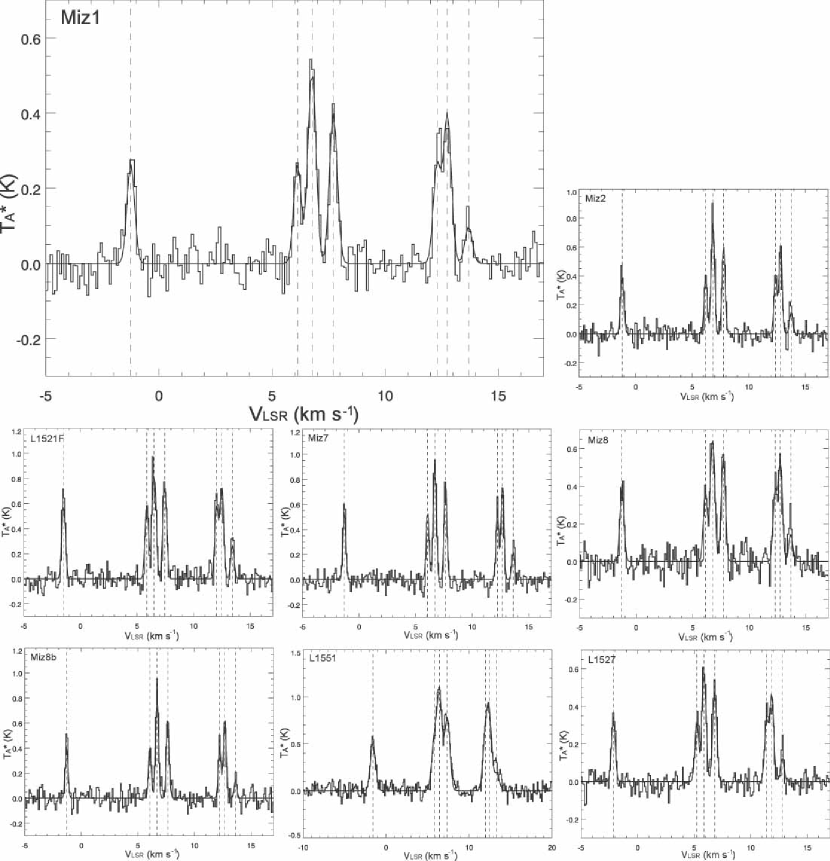
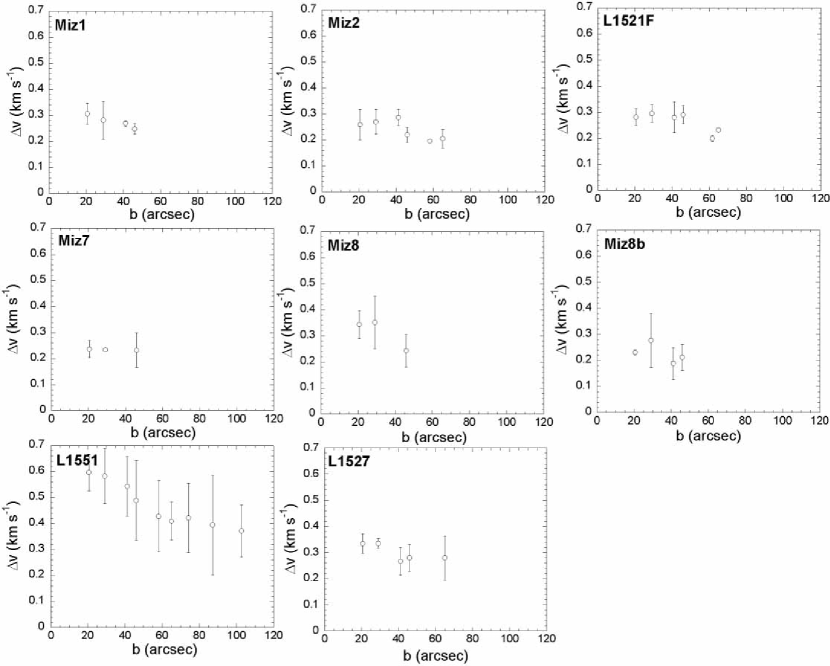
Next, we derive the line optical depth, linewidth, and mass. We fit the observed spectrum by using the hyperfine spectrum model consisting of multiple Gaussian components with line optical depth effect. The intrinsic relative intensities of the hyperfine components are taken from Tiné et al. (2000). The free parameters are the excitation temperature , the sum of optical depths of the hyperfine components , systemic velocity (radial velocity), and intrinsic linewidth (which is not broadened due to line optical depth). The details of the column density estimation are given in Caselli et al. (2002b). We used the optically thick formula for the central 33 positions, and the optically thin formula for the weaker, outer part. Figure 2 shows the results of the hyperfine fitting, and Table 2 lists the physical parameters from the hyperfine fitting. The excitation temperature at the intensity peak is K for the seven cores excluding Miz1. That for the composite spectrum from the central nine (33) positions is K for the eight cores. The optical depth of the main component (, = 2, 31, 2), which is equal to 0.259 , is found to be moderate (1.540.78 for the intensity peak and 1.070.65 for the central nine positions). The derived linewidth is then corrected for the frequency resolution of the spectrometer. Figure 3 plots the intrinsic linewidth against the angular distance from the core center (impact parameter) . This corresponds to the Type 4 (single-tracer, single-cloud) linewidth-size relation in Goodman et al. (1998). The power-law index of the linewidth-size relation obtained by non-linear least-squares fitting is listed in Table 3. Caselli et al. (2002c) showed that molecular cloud cores have a variety of linewidth-size relation; cores show positive, flat, and negative correlation of linewidth with the impact parameter. Our samples show that linewidth decreases or constant with increasing in general (Table 2). The larger linewidth at the center in cores with stars could be due to the influence of protostellar collapse (Zhou et al., 1994; Caselli et al., 2002a) and/or molecular outflow (Aso et al., 2000), although we selected the molecular line to minimize such effects. To discuss the intrinsic core properties by eliminating this effect, we use the average linewidth for in Miz8 and L1527 and for in L1551. The intrinsic N2H+ linewidth of the starless core is = 0.2560.024 km s-1, while that of the core with star is = 0.3090.070 km s-1. So, there is no significant difference. By assuming a gas kinetic temperature of 10 K, we derive the non-thermal linewidth and the total linewidth (Fuller & Myers, 1992). is estimated to be 0.2240.030 km s-1 and 0.2840.082 km s-1 for starless cores and cores with stars, respectively. is derived to be 0.4970.013 km s-1 and 0.5280.042 km s-1 for starless cores and cores with stars, respectively. The thermal linewidth for the mean molecular weight (2.33 ) at 10 K is 0.443 km s-1. So, both starless cores and cores with stars are dominated by the thermal support. The effective pressure is 1.260.07 and 1.430.23 times as large as the thermal pressure for starless cores and cores with stars, respectively. Table 3 lists the H2 column density (H2) obtained for the spectrum at the intensity peak, and for the composite spectrum from the nine (33) positions centered on the intensity peak. We derive the core mass by integrating the column density over the core. We adopted the abundance of N2H+ to be 3.0 relative to H2 (Caselli et al., 2002c). The core mass is listed in Table 3. The average value is = 1.300.63 for the starless cores, and is = 1.590.97 for the cores with stars. These values are not much different, taking into account the uncertainty in mass estimation (a factor of 2).
4 Discussion
We investigate whether the cores have equilibrium states or not by following the discussion of Nakano (1998) (see §1 of the present paper for a brief summary). The virial theorem is useful not only for stable states but also for the unstable states not very far from the critical state (Nakano, 1998). For consistency, the formula in Aso et al. (2000) is used again, , where the effective sound speed is = (8 ln 2)1/2. Table 3 lists the critical pressure . is derived to be (5.42.6) and (5.92.2) K cm-3 for starless cores and cores with stars, respectively, when we do not correct for the decrease in mass (see below). When we correct for the decrease in mass due to protostellar collapse and outflow for cores with stars, the critical pressure is derived to be (5.42.6) and (3.51.6) K cm-3 for starless cores and cores with stars, respectively. We estimate in Taurus to be of order 4 K cm-3 from the column density of low-density molecular gas and the coefficient of the linewidth-size relation (Tatematsu et al., 1993; Onishi et al., 2002). This means that both starless cores and cores with stars are close to the critical state in Taurus.
To know whether turbulence dissipation leads to the onset of star formation, we need to know the physical condition prior to star formation. The derived mass of the molecular cloud core is the current value. This may have decreased from the original value, because part of the original core mass has lost through star formation. We estimate the decrease in the core mass due to these star formation activities as follows. Part of the core mass will be accreted onto the protostar, and part of it will be swept up by the molecular outflow. The high-velocity wind from the protostar will sweep up the ambient matter (mostly the parent molecular cloud core, and possibly also the less dense envelope), and this entrained mass together with the wind mass constitutes to the outflow mass. The mass of the T Tauri star is typically 0.5 . The Class I protostar is supposed to have accreted more than half of the final stellar mass (Bontemps et al., 1996). The mass of the forming star is estimated to be 0.1-0.15 for IRAS 04169+2702 from the accretion luminosity estimate (Ohashi et al., 1997b). The mass of the central star of L1551 IRS5 is estimated to be 0.150.5 from the kinematics of the protoplanetary disk (Momose et al., 1998) and to be 0.73 from the stellar luminosity and disk mass (Saito et al., 1996). The mass of the central star of IRAS 04368+2557 (L1527) is estimated to be 0.1 from the kinematics of the protoplanetary disk and the accretion luminosity (Ohashi et al., 1997a). Hogerheijde et al. (1998) estimated the maximum central star mass to be 2.6 and 0.2 for L1551 IRS5 and IRAS 04368+2557 (L1527), respectively, from the accretion luminosity. IRAS 04166+2706 (Miz7), IRAS 04169+2702 (Miz8) and IRAS 04368+2557 (L1527) are known to accompany molecular outflows (Bontemps et al., 1996). The mass of molecular outflow associated with L1551 IRS5 is 0.3 (Lada, 1985). Hogerheijde et al. (1998) estimated the outflow mass from 12CO (32) to be 3.1 and 0.18 for L1551 IRS5 and IRAS 04368+2557 (L1527), respectively. Taking them into account, we estimate the mass lost from the parent molecular cloud core is about 0.4, 0.4, 1.0, and 0.2 for IRAS 04166+2706 (Miz7), IRAS 04169+2702 (Miz8), L1551 IRS5, and IRAS 04368+2557 (L1527), respectively.
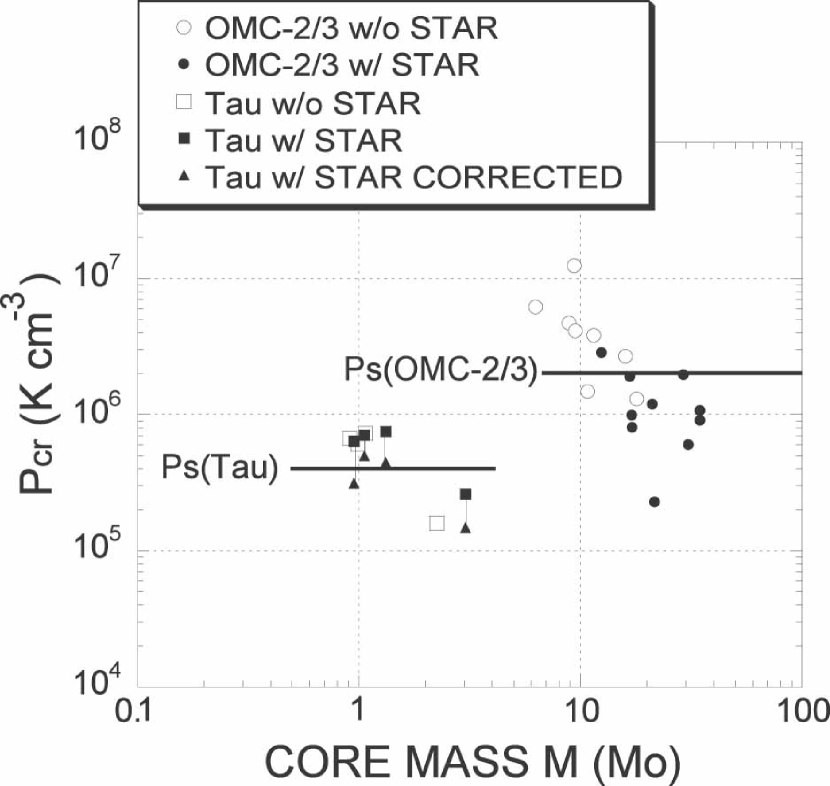
Figure 4 plots the critical pressure against the core mass . There is no systematic difference between starless cores and cores with stars in Taurus. Regardless of starless cores or cores with stars, six out of the eight molecular cloud cores are located near the critical state of equilibrium. Two cores, L1521F and L1551 are located slightly below . However, may have local variation and mass estimation will be uncertain by a factor of 2. It is hard to conclude that these two cores are far from the critical state. Although there is a possibility that the core in Taurus slightly dissipates turbulence resulting in star formation and then the star formation activity increases the nonthermal linewidth, the present observations do not provide us with the evidence for the dissipation of turbulence. Within the accuracy of the current study, we conclude that both starless cores and cores with stars are close to the critical state. Myers & Benson (1983) obtained similar results from NH3 observations of low-mass molecular cloud cores; cores are close to the critical state for equilibrium and stability if the Doppler linewidth supports cores. Caselli et al. (2002c) studied the ratio of the core mass to the virial mass, and derived to be and for starless cores and cores with stars, respectively. These values are almost identical: both cores are close to virial equilibrium. We suggest that the thermally-supported cores evolve keeping the critical state for equilibrium. This result for the low-mass star forming region is in contrast with that obtained in the intermediate-mass star forming region OMC-2/3. In OMC-2/3, starless cores and cores with stars show clearly different states.
We should revisit OMC-2/3 to see whether the results reported are still correct even if we take into account the depletion of H13CO+. The molecular cloud cores in OMC-2/3 is warmer ( 20 K, Cesaroni & Wilson (1994)), and show active star formation. The sublimation temperature of the CO ice is 16 K in cloud cores (Langer et al., 2000). So, depletion will not be serious even for H13CO+. Aso et al. (2000) have not taken into account the mass accreted onto the protostar or swept by the outflow, but this correction will simply enhance the observed difference between starless cores and cores with stars. We conclude that the results obtained by Aso et al. (2000) is unchanged even in the present context.
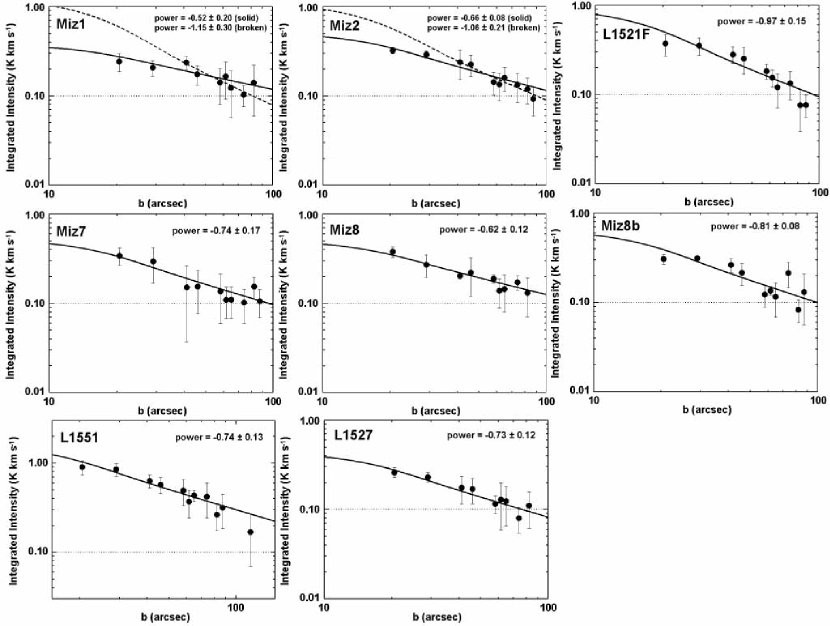
Lastly, we investigate the radial density profile on the basis of the radial distribution of the integrated intensity of the main component (Fig. 5). We use here the integrated intensity, because it is straightforward and more reliable than the hyperfine fitted column density for outer regions. The intensity profile is fitted with a power-law convolved with the telescope beam. The fitting results are listed in Table 3. Miz1 and Miz2 may have (a hint of) central flattening. For Miz1 and Miz2, the fitting result only for the outer part ( 35 arcsec or 4800 AU) is shown as broken lines in Figure 5. The central flattening in cores in low-mass star forming regions was previously reported by Ward-Thompson et al. (1999); André et al. (1993); Caselli et al. (2002c) from the dust continuum observations and N2H+ observations. However, the integrated intensity profile in Miz1 and Miz2 can also be fitted reasonably with single (shallow) power laws (solid lines). The data quality of the present observation is not enough to distinguish these models. The power-law index of the radial distribution is (using the outer part for Miz1 and Miz2) and for starless cores and cores with stars, respectively. When we assume that the column density is proportional to the integrated intensity, the power in the intensity profile is related to the power in the density profile as . L1521F was observed in N2H+ with the Berkeley-Illinois-Maryland Association (BIMA) millimeter array and with SCUBA on the James Clerk Maxwell Telescope (JCMT) (Shinnaga et al., 2003). These observations show the centrally peaked intensity profile of L1521F (from their Figure 3, the BIMA intensity profile is fitted with and the SCUBA intensity profile is fitted with for 10 arcsec). These data do not show the central flattening for L1521F, when we take into account their map resolution. Some starless cores (Miz1 and Miz2) may have central flattening, while some starless cores may not. On the other hand, there is no hint of central flattening in cores with stars in our samples. However, it is possible that central flattening was not observed due to the limited spatial resolution ( 18 arcsec or 2500AU) and data sampling ( 21 arcsec or 2900 AU) in our observations. Our result shows that cores with stars have shallow power-law density (or integrated intensity) distribution. It is interesting that this is in contrast to the result in the lower spatial resolution study by Caselli et al. (2002c), where cores with stars show steep integrated intensity distribution. There is a possibility that the shallow density profile in cores with stars can be results of the core collapse (Foster & Chevalier, 1993) and/or core dispersal due to the molecular outflow. The present observations are probably not enough for disentangling these possibilities, and further observations (high-resolution dust continuum map, near-infrared color-excess map, higher resolution N2H+ imaging, etc) are desirable.
5 Summary
On the basis of N2H+ observations toward Taurus, we have studied the physical properties of the molecular cloud core. The core radius, linewidth, and intensity distribution do not much differ between starless cores and cores with stars. This result is in contrast with that previously obtained in H13CO+. We suggest that depletion of H13CO+ causes this difference. From the critical pressure analysis for Taurus cores, there is no systematic difference between starless cores and cores with stars. Both are not far from the critical state for equilibrium. We suggest that the starless cores which are almost thermally supported evolve toward star formation by keeping close to the critical state. This result is in contrast with that obtained in the intermediate-mass star forming region OMC-2/3, where the molecular cloud core evolves by dissipating turbulence largely. The density profile is investigated from the integrated intensity distribution in the cores. Cores with stars show shallow density profiles, to .
References
- André et al. (1993) André, P., Ward-Thompson, D., & Barsony, M. 2000, in Protostars and Planets IV, ed. V. Mannings, A. P. Boss, & S. S. Russell (Tucson: Univ. Arizona Press), 59
- Aikawa et al. (2001) Aikawa Y., Ohashi, N., Inutsuka, S., Herbst, E., & Takakuwa, S. 2001, ApJ, 552, 639
- Aso et al. (2000) Aso, Y., Tatematsu, K., Sekimoto, Y., Nakano, T., Umemoto, T., Koyama, K., & Yamamoto, S. 2000, ApJS, 131, 465
- Bachiller & Perez Gutierrez (1997) Bachiller, R., & Perez Gutierrez, M. 1997, A&A, 487, L93
- Barsony & Chandler (1993) Barsony, M., & Chandler, C.J. 1993, ApJ, 406, L71
- Bergin et al. (2001) Bergin, E. A., Ciardi, D. R., Lada, C. J., Alves, J., & Lada, E. A. 2001, ApJ, 557, 209
- Bergin et al. (2002) Bergin, E. A., Alves, J., Huard, T. L., & Tafalla, M. 2002, ApJ, 570, L101
- Bontemps et al. (1996) Bontemps, S., André, P., Terebey, S. & Cabrit, S. 1996, A&A, 311, 858
- Caselli et al. (1995) Caselli, P., Myers, P. C., & Thaddeus, P. 1995, ApJ, 455, L77
- Caselli et al. (1999) Caselli, P., Walmsley, C. M., Tafalla, M., Dore, L., & Myers, P. C. 1999, ApJ, 523, L165
- Caselli et al. (2002c) Caselli, P., Benson, P. J., Myers, P. C., & Tafalla, M. 2002c, ApJ, 572, 238
- Caselli et al. (2002b) Caselli, P., Walmsley, C. M., Zucconi, A., Tafalla, M., Dore, L. & Myers, P. C. 2002b, ApJ, 565, 344
- Caselli et al. (2002a) Caselli, P., Walmsley, C. M., Zucconi, A., Tafalla, M., Dore, L. & Myers, P. C. 2002a, ApJ, 565, 331
- Cesaroni & Wilson (1994) Cesaroni, R., & Wilson, T. L. 1994, A&A, 281, 209
- Foster & Chevalier (1993) Foster, P. N., & Chevalier, R. A. 1993, ApJ, 416, 303
- Fuller & Myers (1992) Fuller, G. A. & Myers, P. C. 1992, ApJ, 384, 523
- Hogerheijde et al. (1998) Hogerheijde, M. R., van Dishoeck, E. F., Blake, G. A., & van Langevelde, H. J. 1998, ApJ, 502, 315
- Goodman et al. (1998) Goodman, A. A., Barranco, J. A., Wilner, D. J., & Heyer, M. H. 1998, ApJ, 504, 223
- Lada (1985) Lada, C.J. 1985, ARA&A, 23, 267
- Langer et al. (2000) Langer, W.D., van Dishoeck, E.F., Bergin, E.A., Blake, G.A., Tielens, A.G.G.M., Velusamy, T., & Whittet, D.C.B. 2000, in Protostars and Planets IV, ed. V. Mannings, A.P. Boss, & S.S. Russell (Tucson: Univ. Arizona Presss), 29
- Lee et al. (2003) Lee, J-.E., Evans, N.J., II, Shirley, Y.L., & Tatematsu, K. 2003, ApJ, 583, 789
- Li et al. (2002) Li, Z.-Y., Shematovich, V.I., Wiebe, D.S., & Shustov, B.M. 2002, ApJ, 569, 792
- Mizuno et al. (1994) Mizuno, A., Onishi, T., Hayashi, M., Ohashi, N., Sunada, K., Hasegawa, T., & Fukui, Y. 1994, Nature, 368, 719
- Momose et al. (1998) Momose, M., Ohashi, N., Kawabe, R., Nakano, T., & Hayashi, M. 1998, ApJ, 504, 314
- Myers & Benson (1983) Myers, P.C., & Benson, P.J. 1983, ApJ, 266, 309
- Nakano (1998) Nakano, T. 1998, ApJ, 494, 587
- Ohashi et al. (1997a) Ohashi, N., Hayashi, M., Ho, P.T.P, & Momose, M. 1997a, ApJ, 475, 211
- Ohashi et al. (1997b) Ohashi, N., Hayashi, M., Ho, P.T.P., Momose, M., Tamura, M., Hirano, N., & Sargent, A.I. 1997b, ApJ, 488, 317
- Onishi et al. (2002) Onishi, T., Mizuno, A., Kawamura, A., Tachihara, K., & Fukui, Y. 2002, ApJ, 575, 950
- Saito et al. (1996) Saito, M., Kawabe, R., Kitamura, Y., & Sunada, K. 1996, ApJ, 473, 464
- Saito et al. (2001) Saito, M., Kawabe, R., Kitamura, Y., & Sunada, K. 2001, ApJ, 547, 840
- Shematovich et al. (2003) Shematovich, V.I., Wiebe, D.S., Shustov, B.M., & Li, Z.-Y. 2003, ApJ, 588, 894
- Shinnaga et al. (2003) Shinnaga, H., Ohashi, N., Lee, S.-W., & Moriarty-Schieven, G. H. 2003, ApJ, in press
- Spitzer (1968) Spitzer, L., Jr. 1968, Diffuse Matter in Space (New York: Wiley)
- Tafalla et al. (2002) Tafalla, M., Myers, P. C., Caselli, P., Walmsley, C. M., & Comito, C., 2002 ApJ, 569, 815
- Tatematsu et al. (1993) Tatematsu, K., et al. 1993, ApJ, 404, 643
- Tiné et al. (2000) Tiné, S., Roueff, E., Falgarone, E., Gerin, M., & Pineau des Forêts, G. 2000, A&A, 356, 1039
- Ward-Thompson et al. (1999) Ward-Thompson, D., Motte, F., & André, P. 1999, MNRAS, 305, 143
- Womack et al. (1993) Womack, M., Ziurys, L. M., & Sage, L. J. 1993, ApJ, 406, L29
- Yokogawa et al. (2003) Yokogawa, S., Kitamura, Y., Momose, M., & Kawabe, R. 2003 ApJ, 595, 266
- Zhou et al. (1994) Zhou, S., Evans, N. J., II, Wang, Y., Peng, R., & Lo, K. Y. 1994, ApJ, 433, 131
| Field | R.A.(J2000)aaThe maximum position of the main N2H+ component (, = 2, 31, 2) is listed. Units of right ascension are hours, minutes, and seconds, and units of declinations are degrees, arcminutes, and arcseconds. | Decl.(J2000)aaThe maximum position of the main N2H+ component (, = 2, 31, 2) is listed. Units of right ascension are hours, minutes, and seconds, and units of declinations are degrees, arcminutes, and arcseconds. | Parent cloud name | IRASyoung star | Class |
|---|---|---|---|---|---|
| Miz1 | 4 18 10.3 | 27 36 03 | L1495 | ||
| Miz2 | 4 19 37.0 | 27 15 35 | L1495 | ||
| L1521F | 4 28 39.3 | 26 51 43 | L1521 | ||
| Miz7 | 4 19 41.5 | 27 13 32 | L1495 | 04166+2706 | I |
| Miz8 | 4 19 58.2 | 27 10 22 | L1495 | 04169+2702 | I |
| Miz8b | 4 19 52.2 | 27 11 45 | L1495 | ||
| L1551 | 4 31 32.5 | 18 08 25 | L1551 | L1551 IRS5 | I |
| L1551 NE | 0 | ||||
| L1527 | 4 39 53.2 | 26 03 47 | L1527 | 04368+2557 | 0 |
| Core | (pc) | (km s-1)bbUpper row shows the value at the intensity peak, and the lower row in parentheses is the value from the composite spectrum of central nine positions. The error represents 1 error in the hyperfine fitting. | (km s-1)ccIntrinsic N2H+ linewidth. For Miz8, L1551, and L1527, the values derived for the core edge ( 40, 80, and 40, respectively) are used to minimize the effect of the protostellar collapse and molecular outflow. For the remaining sources, the average values over the cores are used. | bbUpper row shows the value at the intensity peak, and the lower row in parentheses is the value from the composite spectrum of central nine positions. The error represents 1 error in the hyperfine fitting. | (K)bbUpper row shows the value at the intensity peak, and the lower row in parentheses is the value from the composite spectrum of central nine positions. The error represents 1 error in the hyperfine fitting. |
|---|---|---|---|---|---|
| Miz1 | 0.038 | 6.750.01 | 0.280.04 | —ddVery large uncertainty. | —ddVery large uncertainty. |
| (6.760.01) | (2.811.07) | (4.860.62) | |||
| Miz2 | 0.036 | 6.830.01 | 0.240.05 | 4.001.33 | 6.230.83 |
| (6.840.01) | (2.730.86) | (5.990.80) | |||
| L1521F | 0.029 | 6.500.01 | 0.280.04 | 9.721.79 | 5.070.23 |
| (6.510.01) | (9.630.87) | (4.650.09) | |||
| Miz7 | 0.024 | 6.720.01 | 0.240.05 | 7.641.33 | 5.780.31 |
| (6.700.01) | (5.030.72) | (5.470.26 | |||
| Miz8 | 0.029 | 6.750.01 | 0.330.05 | 7.921.78 | 5.020.29 |
| (6.770.01) | (4.541.06) | (4.780.33) | |||
| Miz8b | 0.036 | 6.730.01 | 0.230.06 | 3.961.79 | 5.911.03 |
| (6.710.01) | (1.890.82) | (7.401.67) | |||
| L1551 | 0.038 | 6.410.02 | 0.400.10 | 1.060.79 | 11.205.53 |
| (6.430.01) | (2.190.42) | (7.600.73) | |||
| L1527 | 0.032 | 5.850.01 | 0.270.07 | 7.431.94 | 4.200.22 |
| (5.880.01) | (4.210.88) | (4.600.28) |
| Core | (H2) (cm-3)eeUpper row shows the value at the intensity peak, and the lower row in parentheses is the value from the composite spectrum of central nine positions. The error represents 1 error in the hyperfine fitting. | ()ffMass lost due to the forming star and the associated molecular outflow is not taken into account. | ( K cm-3)ggFor cores with stars, the “range” represents the values uncorrected (upper bound) and corrected (lower bound) for the mass loss due to accretion onto the star and due to the molecular outflow. | Power index of linewidthhhPower-law index for the linewidth-size relation (Fig. 3) estimated by using the non-linear least-squares fitting in the form . The correlation coefficient is listed in parentheses. | Power index of intensity distributioniiPower-law index from the fit to the radial integrated intensity distribution of the main component (Fig. 5). |
|---|---|---|---|---|---|
| Miz1 | —jjVery large uncertainty. | 1.1 | 7.3 | -0.230.18 (C.C.=0.88) | kkCentral part is excluded for fitting. |
| () | |||||
| Miz2 | 1.0 | 6.1 | -0.420.14 (C.C.=0.79) | kkCentral part is excluded for fitting. | |
| () | |||||
| L1521F | 2.2 | 1.6 | -0.170.08 (C.C.=0.48) | ||
| () | |||||
| Miz7 | 1.0 | 3.16.4 | -0.020.34 (C.C.=0.98) | ||
| () | |||||
| Miz8 | 1.3 | 4.47.5 | -0.410.36 (C.C.=0.92) | ||
| () | |||||
| Miz8b | 0.9 | 6.7 | -0.140.25 (C.C.=0.68) | ||
| () | |||||
| L1551 | 3.0 | 1.52.6 | -0.310.13 (C.C.=0.97) | ||
| () | |||||
| L1527 | 1.1 | 5.07.1 | -0.230.19 (C.C.=0.79) | ||
| () |