Doppler Shifts and Broadening and the Structure of the X-ray Emission from Algol
Abstract
In a study of Chandra High Energy Transmission Grating spectra of Algol, we clearly detect Doppler shifts caused by the orbital motion of Algol B. These data provide the first definitive proof that the X-ray emission of Algol is dominated by the secondary, in concordance with expectations that the primary B8 component should be X-ray dark. However, the measured Doppler shifts are slightly smaller than might be expected, implying an effective orbital semi-major axis of about instead of for the Algol B center of mass. This could be caused by a small contribution of Algol A, possibly through accretion, to the observed X-ray flux, in which case such a contribution does not exceed 10-15%. We suggest the more likely explanation is an asymmetric corona biased toward the system center of mass by the tidal distortion of the surface of Algol B. A detailed analysis of the profiles of the strongest lines indicates the presence of excess line broadening amounting to approximately 150 km s-1 above that expected from thermal motion and surface rotation. Possible explanations for this additional broadening include turbulence, flows or explosive events, or rotational broadening from a radially extended corona. We favor the latter scenario and infer that a significant component of the corona at temperatures K has a scale height of order the stellar radius. This interpretation is supported by the shape of the X-ray lightcurve and tentative detection of a shallow dip at secondary eclipse. We also examine the O VII intercombination and forbidden lines in a Low Energy Transmission Grating Spectrograph observation and find no change in their relative line fluxes as the system goes from quadrature to primary eclipse. Since these lines appear to be strongly affected by UV irradiation from Algol A through radiative excitation of the transition, this supports the conjecture that the corona of Algol B at temperatures of several million K must be significantly extended and/or located toward the poles to avoid being shadowed from Algol A during primary eclipse.
1 Introduction
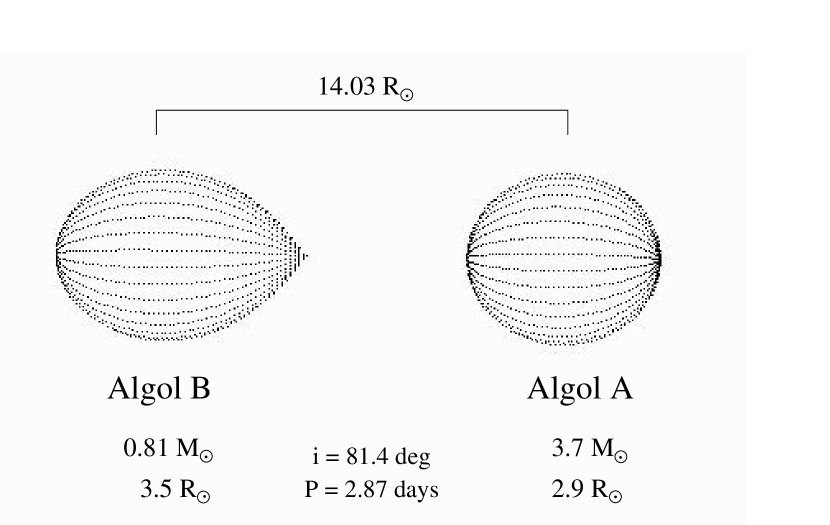
Algol ( Perseus) is the eponymous eclipsing binary system which consists of a primary early-type main sequence star and a Roche lobe-filling secondary late-type giant or subgiant star. These systems have undergone a period of mass transfer during which material was transferred from the initially more massive present day late-type star to its initially less massive early-type companion. Algol is the brightest and nearest example of this type. The primary star (Algol A) is a B8 V main sequence star, while the secondary (Algol B) is a K2 IV subgiant that has lost about half of its original mass to the present day primary (e.g., Drake, 2003). Since Algol has a short period orbit of 2.87 days (e.g., Hill et al., 1971) the two stars are tidally locked, and their orbital and rotational periods are synchronized.
Algol was first confirmed as an X-ray source by Harnden et al. (1977), who suggested that the X-ray emission might be explained by a mass-transfer model, where the more massive B star accretes material from the less massive K star, either through Roche Lobe overflow or a stellar wind. In both cases, the infalling material is shock-heated to X-ray temperatures when it hits the B star. According to this mass-transfer model, we would expect to observe an X-ray eclipse during the optical primary eclipse. However, observations made with the Solid State Spectrometer (SSS) of the Einstein Observatory revealed no sign of an X-ray eclipse at the time of optical primary eclipse (White et al., 1980).
At present, it is widely believed that the X-ray emission from Algol arises mostly, if not completely, from the corona of Algol B (White et al., 1980). The two stars are tidally locked and rapidly rotating, and within the rotationally-excited dynamo paradigm, it is expected that the convection zone of the K star would experience increased dynamo activity whose resulting magnetic energy is subsequently dissipated at the stellar surface in the form of a hot, X-ray emitting corona (Pallavicini et al., 1981; Simon & Drake, 1989). However, the nature and structure of this corona remains a topic of debate. More than four orders of magnitude in X-ray luminosity and an order of magnitude in plasma temperature separate the solar corona from coronae of most active stars such as the Algol-type secondaries (e.g. Schmitt et al., 1997). We currently have very little idea of the physical and spatial characteristics and appearance of these much more active coronae, and whether or not magnetic structures are restricted to the stellar surface or whether significant X-ray emitting plasma resides in larger structures, including inter-binary loops, with magnetic structures linking the two stars (Uchida & Sakurai, 1983).
White et al. (1986) analyzed EXOSAT observations of Algol and found no clear X-ray eclipse during the optical secondary minimum. If this X-ray emission was indeed from the secondary star, his study suggests that the coronal extent of Algol B must be comparable to or greater than the size of the star itself. However, Ottmann (1994) did detect a secondary X-ray eclipse in ROSAT observations, and concluded that the scale height of the Algol B corona is . Similarly, a shallow eclipse at optical secondary minimum was seen by ASCA (Antunes et al., 1994). A dramatic eclipse of a large flare observed by BeppoSAX enabled the size of the flaring structure to be estimated as being less than 0.6 stellar radii and pinpointed the location of the structure to polar regions (Schmitt & Favata, 1999). Based on these deductions and on observations of flares on Algol seen by GINGA, EXOSAT, ROSAT, and XMM-Newton, Favata et al. (2000) suggest that the corona is essentially concentrated onto the polar regions of the K star, with a more compact (smaller than the star) flaring component and a perhaps somewhat more extended (comparable in size to the star) quiescent corona. Such a picture of polar-dominated activity has long been suspected based on optical Doppler imaging techniques, which consistently see dark polar spots on active stars (e.g. Strassmeier, 2000). Ness et al. (2002) also suggested polar emission was responsible for the lack of rotational modulation in the observed flux in a Chandra Low Energy Transmission Grating Spectrograph (LETGS) observation of Algol. However, an XMM-Newton observation of an Algol flare studied by Schmitt et al. (2003) was interpreted as lying at lower latitudes. While this interpretation is somewhat subjective, it does suggest that even if polar emission dominates, significant activity at all latitudes is likely present.
Similar conclusions regarding the corona of the K star might be drawn based on radio detections of Algol. In particular, Mutel et al. (1998) presents results from 8.4 and 15 GHz observations of Algol obtained using the Very Long Baseline Array (VLBA) in 1995. The VLBA maps show a double-lobed structure in the radio corona of the K star, which appear to originate in or near the polar caps. The quiescent radio emission does not show signs of orbital modulation, again suggestive of a corona concentrated on the poles of the K star. Caution is warranted in the interpretation of the spatial distributions of radio and X-ray emission, however, since the former is produced by gyrosynchrotron emission from relativistic electrons, and this population might not be co-spatial with the thermal electrons responsible for X-ray emission. Direct X-ray observations present the only means to probe the spatial distribution of this thermal population.
In this paper, we primarily use the Chandra High Energy Transmission Grating Spectrograph (HETGS) X-ray spectrum of Algol to test this emerging picture of coronal activity. We compare observed Doppler shifts with the theoretical orbital velocities of the primary and secondary stars of Algol, and compare the observed line widths with theoretical expectations based on instrumental, thermal, and rotational broadening. Based on these comparisons, we are able to place the first observational limits on the contribution of the B8 dwarf to the X-ray emission of Algol, and to place constraints on the scale height, and any non-thermal motions, characterizing the corona of Algol B. Finally, we show that lines of O VII seen from quadrature to primary eclipse in a Low Energy Transmission Grating Spectrograph (LETGS) observation of Algol support our conclusions that the corona of Algol B at temperatures of a few K must be radially extended to at least one stellar radius.
2 Observations
The Chandra HETGS employed for the observations used in this analysis consists of two gratings—the High Energy Grating (HEG) and the Medium Energy Grating (MEG). The HEG covers a wavelength range of 1.2-15 Å (10.0-0.8 keV), with a typical line width of 0.012 Å. The MEG covers a wider wavelength range of 2.5-31 Å (5.0-0.4 keV), with a typical line width of 0.023 Å. A more thorough description of this instrumentation can be found in Markert et al. (1994). We made use of both HEG and MEG spectra.
The HETGS observation of Algol (ObsID 604) studied here was obtained as part of the Guest Observer (GO) program and was undertaken in the standard instrument configuration using the ACIS-S detector between UT 02:20 and 17:31 on 2000 April 1, for a total effective exposure time of 54660 s. In order to investigate the accuracy of the instrument line response function, we also analyzed an observation of Capella (ObsID 2583) obtained for routine calibration. This observation was also taken in the standard instrument configuration using the ACIS-S detector between UT 17:46 and 02:03 on 2002 April 29 to April 30, for a total exposure time of 29700 s. We chose this particular observation of Capella because it was obtained at an orbital phase of 0.5, when the two giants were near conjunction and spectral features were minimally broadened by orbital motion.
We also analyzed an LETGS observation of Algol (ObsID 2), in order to examine the ratio of the O VII forbidden to intercombination lines as a function of orbital phase. The data were observed between UT 18:22 and 17:11 on 2000 March 12 to March 13, for a total exposure time of 82200 s. For details of the observation itself we refer to Ness et al. (2002).
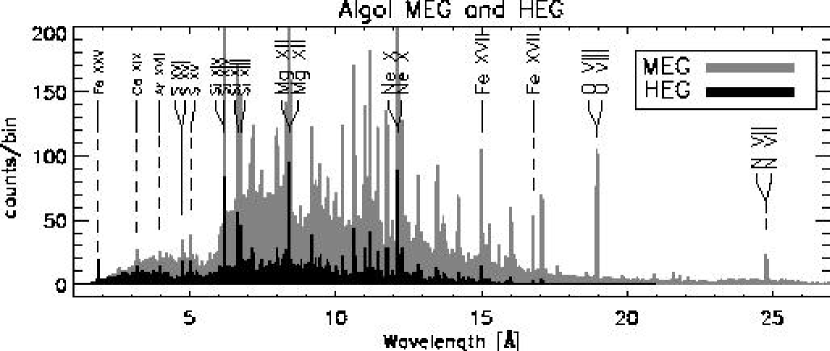
The standard CIAO pipeline-processed (version 2.2) data were downloaded from the Chandra public data archive. Subsequent analysis was done using the IDL software package PINTofALE (Kashyap & Drake, 2000). The first order MEG and HEG spectra are illustrated in Figure 1, together with identifications of prominent spectral lines. Emission lines used in our analyses are labeled with a larger font.
3 Analysis
3.1 Lightcurves
Prior to spectral analysis, we examined the lightcurves of both Algol and Capella in order to determine their level of variability and whether any significant events (such as large flares) occurred during the observations that may be relevant for subsequent interpretation of Doppler shifts and line broadening. The lightcurves were derived by extracting all dispersed events in the standard CIAO spectral extraction region, then binning the events at 100 second time intervals. We emphasize here that we did not use the 0th order events since these are strongly affected by pile-up.
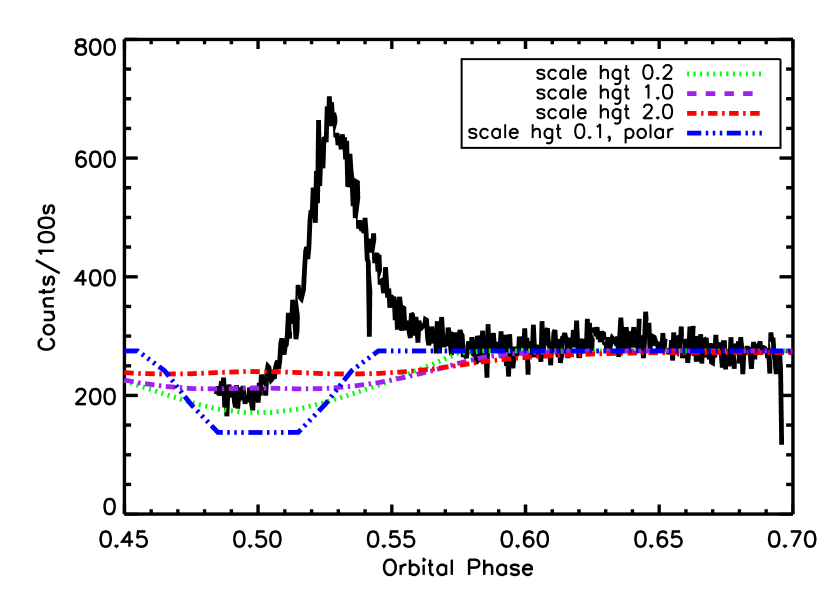
The observed lightcurve of Capella is relatively flat, with no obvious signs of flaring, or other variability. The lightcurve of Algol on the other hand, shows a definite and significant flare in the beginning of the observation (Figure 2). Note that the orbital phase of the Algol observation begins at = 0.48, just before Algol B starts to come out of eclipse. It is possible that the impulsive phase of the flare has been affected by geometric occultation and we return to this in §4. The flare has decayed by , soon after Algol B passes conjunction. Algol B appears to be quiescent for the remainder of the observation, which ends at .
3.2 Doppler Shifts
In this section, we investigate the Algol spectra for evidence of Doppler shifts resulting from orbital motion. The following analysis is restricted to the emission lines listed in Table LABEL:t:whichlines. We have chosen these particular lines because they have high S/N ratios and are not significantly blended with lines of other atomic species.
| Wvl [Å] | Ion | Grating | Diffraction Order |
|---|---|---|---|
| 8.42 | Mg XII | MEG | 1,3 |
| 12.13 | Ne X | MEG,HEG | 1 |
| 15.01 | Fe XVII | MEG | 1 |
| 16.78 | Fe XVII | MEG | 1 |
| 18.98 | O VIII | MEG | 1 |
| 24.78 | N VII | MEG | 1 |
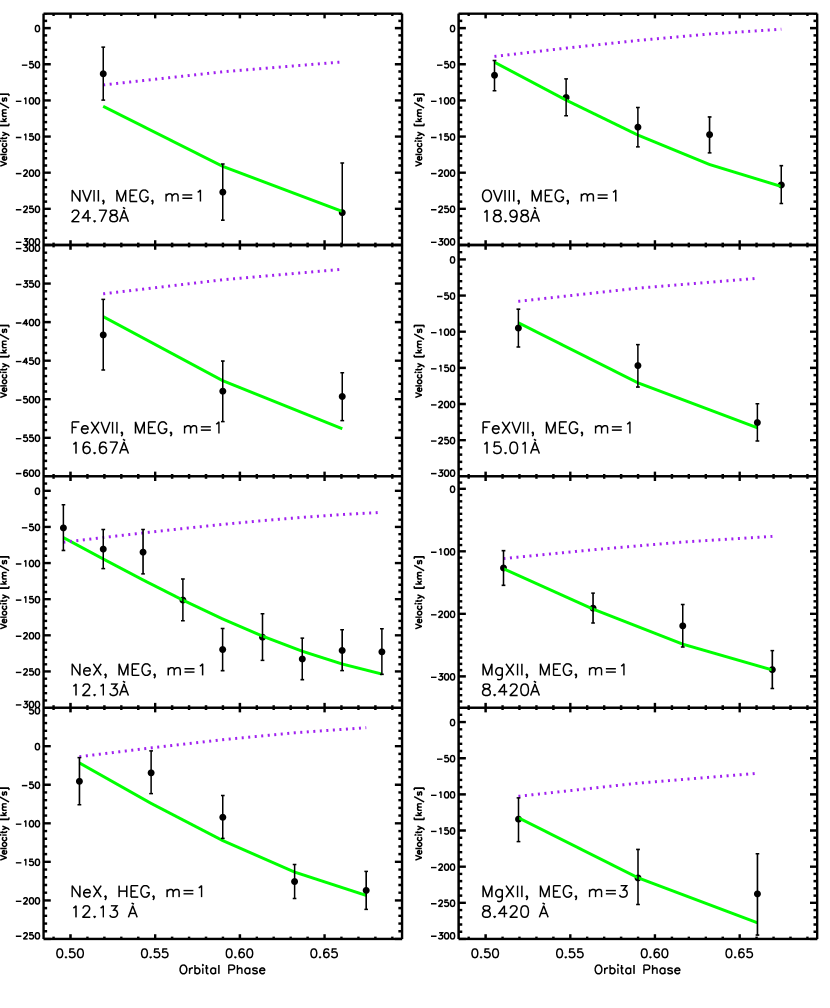
Orbital velocity as a function of orbital phase is derived separately for each emission line listed in Table LABEL:t:whichlines. For each line, we first bin the events into time intervals (which are later converted to orbital phase), where the bin size is proportional to the total observed counts of the emission line, thereby maintaining an approximately constant S/N ratio for each bin. Negative and positive order events (in both MEG and HEG) were combined to obtain higher signal to noise (S/N) ratios. Since we are trying to accurately measure the wavelength centroids of emission lines, what is important here is the S/N ratio, rather than the resolution. Although the HEG has better resolution than the MEG, most of even the brightest lines proved too faint for useful analysis in HEG spectra. Most of the lines we analyze here are therefore MEG lines.
A modified Lorentzian function (‘beta-profile’) described by the relation
| (1) |
where is the amplitude and is a characteristic line width, is then fit to the events along the wavelength axis for each time interval. With , this function has been found to be a good match to observed HETGS line profiles, better than Gaussians Drake (2004a, in preparation). In this way, we obtain the observed wavelength centroids as a function of time and orbital phase. The line-of-sight orbital velocities were derived for all emission lines by subtracting the rest wavelengths of lines from their observed centroids.
We expect the dominant component of the Doppler shifts to result from the orbital motion of Algol B, which amounts to km s-1 at quadrature. The predicted orbital velocity is described by
| (2) |
where is the radius of orbit, is the inclination, is the orbital phase, and is the orbital period. We used an inclination of 81.4 degrees (Richards, 1993) and a period of 2.87 days. We fitted a sine model to the observed line wavelengths using the CIAO fitting engine sherpa. The model used to fit the data is given by
| (3) |
where is a constant y-offset [Å], is the rest wavelength of the emission lines [Å], is the speed of light [km s-1], is the amplitude of the final fit which represents the line-of-sight orbital velocity [km s-1] (given by 2r /P), is the orbital phase, r is the effective orbital radius of X-ray emitting material [km], is the inclination of orbit [radians], and P is the orbital period [s]. The parameters for all emission lines were forced to be the same, and the orbital period of Algol B was fixed at the value noted above. The only parameters allowed to vary were and . We allowed to be a free parameter because the absolute wavelength calibration of HETG+ACIS-S observations is 0.011 Å for MEG and 0.006 Å for HEG111http://asc.harvard.edu/proposer/POG/html/HETG.html. Therefore, each emission line may need a different offset in order to account for wavelength calibration uncertainties. Because was a free parameter, errors on the reference wavelengths, though extremely small for the H- and He-like ions, are not relevant for our analysis. The data for all spectral lines were fit simultaneously.
The amplitude of the best fit was A=187.5 km s -1. From the amplitude, we can compute the effective orbital radius of X-ray emitting material, (equation 2). We obtain an effective orbital radius of 10.74 0.93 R⊙. This result will be further discussed in §4. Figure 3 illustrates the observed line of sight orbital velocity as a function of orbital phase, derived from various emission lines. Figure 3 also shows the theoretical orbital velocities of Algol A and Algol B, calculated under the assumption that the X-ray emission is centered on one of the two stars (i.e.–the expected curve if all of the X-ray emission had been located at the poles of Algol B or Algol A).
3.3 Cross-Correlation: Doppler Shifts
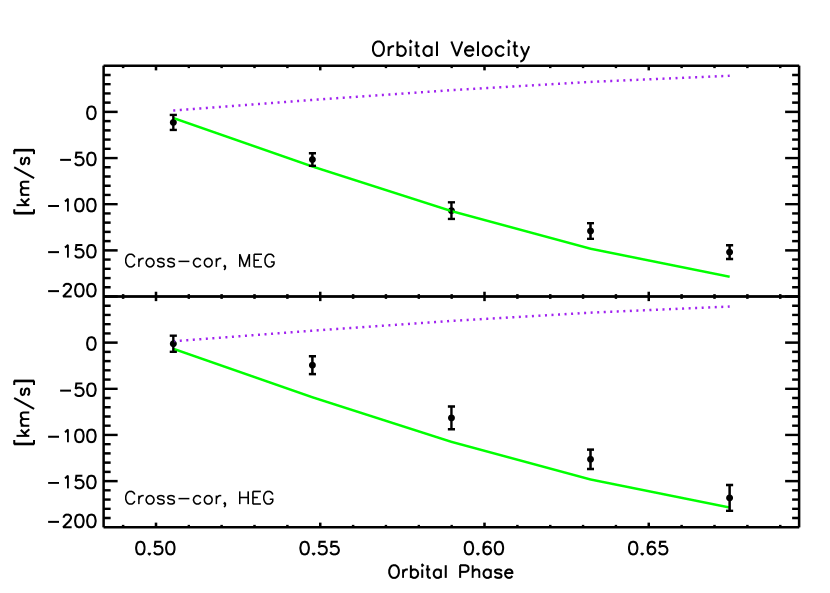
In addition to measuring individual emission lines, we also utilized a cross-correlation technique to obtain Doppler shifts as a function of orbital phase.
Events were binned into 5 time intervals corresponding to different orbital phases, and spectra were extracted for each phase bin. Spectra from each phase bin were cross-correlated with a reference spectrum whose orbital velocity is known. We used Capella (ObsID 2583) as our reference spectrum because, as noted in §2, this particular observation was taken when the two giants were near conjunction in orbital phase. This ensures that the orbital velocity of the spectrum is nearly zero. Other systematic velocities involved can all be determined with high precision and subtracted: these are the radial velocities of the Capella and Algol systems, and the velocity of the Chandra satellite in the direction of these objects during the observations. Algol has a radial velocity of only 4 km s-1 (Wilson, 1953), while Capella has a radial velocity of 30 km s-1 (Wilson, 1953), therefore we must redshift the Algol velocities by 26 km s-1. The orbital velocity of Chandra during these observations was less than 2 km s-1. Since this velocity is small compared to the errors incurred during the cross-correlation analysis, we ignored this orbital motion.
The Algol and Capella spectra were cross-correlated by shifting the Algol spectrum with respect to the Capella spectrum in velocity steps of 25 km s-1, ranging from -200 to 500 km s-1. At each velocity shift, we computed the value as follows:
| (4) |
where and are the two spectra being compared (Capella and velocity shifted Algol), and and are their respective errors. These quantities are then summed over the entire spectral region. The velocity shift at which minimum is achieved represents the Doppler shift in that particular phase bin of the Algol spectrum relative to the Capella spectrum.
In order to better understand the errors incurred from cross-correlating the two spectra and computing , we utilized a Monte Carlo method by randomizing the counts within errors on the Algol spectrum 25 times, and repeating cross-correlation for each randomized data set. Parabolae were then fit to versus velocity shift for each of the 25 simulations in order to find the velocity that corresponds to the minimum of each simulation. The mean velocity is then adopted as the final Doppler shift for that given interval of phase, and the standard deviation of the mean is the error on the final Doppler shift.
Figure 4 illustrates the line-of-sight velocity of Algol as a function of orbital phase, as obtained by the cross-correlation/monte-carlo analysis method described above. Also illustrated are the theoretical orbital velocities of Algol A and Algol B.
Once again, we used the Sherpa fitting engine to fit a sine model to the observed Doppler shifts obtained via the cross-correlation analysis. Doppler shifts for the positive and negative orders, as well as both MEG and HEG, were fit simultaneously with the model described by equation 3. The amplitude of the sine model is A=173.4 5.1 km s-1. Assuming an orbital period of 2.87 days, and an inclination angle of 81.4 degrees, this amplitude corresponds to an orbital radius of 9.93 0.29. This radius is consistent, within 1 uncertainties, with our previous result of 10.74 0.93 obtained by measuring wavelength centroids of individual emission lines.
We also applied the cross-correlation/monte-carlo analysis to the Algol spectrum for regions greater than and less than 10 Å, in order to compare the line-of-sight velocities for lines formed at cooler versus hotter temperatures. Doppler shifts for both regions of the spectrum were consistent, though uncertainties for the hotter region of the spectrum were considerably larger (50 km s-1) than the cooler region (10 km s-1), since most of the stronger emission lines lie at wavelengths greater than 10 Å.
3.4 Thermal and Non-thermal Broadening
3.4.1 Testing the Instrumental Profile using Capella
In order to test for the presence of non-thermal broadening in the observed Algol line profiles, we compare these with carefully-computed theoretical profiles. Since the dominant source of line-broadening in the observed spectra is the instrumental profile, it is important that we confirm that our understanding of the instrumental broadening is correct, before proceeding with the comparison.
In a far ultra-violet study of Capella, Young et al. (2001) found that the observed profile of Fe XVIII originated largely from the G8 component, and that only instrumental, rotational (3 km s-1), and thermal broadening were required to match the observed profile. This gives us some confidence that the coronal spectra of the Capella giants are free from significant additional sources of non-thermal broadening. It is not certain which of the two Capella stars dominated during the time of the observation analyzed here; for example, Johnson et al. (2002) found that, in 1999 September 12, the G1 component dominated in the light of Fe XXI 1354 Å seen by the Space Telescope Imaging Spectrograph (STIS). The dominance of one component over the other is not important here. By constructing two theoretical profiles (described below), one with rotational broadening of 3 km s-1 (G8 component) and another with rotational broadening of 36 km s-1 (G1 component; (Griffin & Griffin, 1986)), we find that the difference in FWHM of the two profiles are negligible—of order 0.0001 Å and two orders of magnitude smaller than typical observed line widths.
Theoretical line profiles were synthesized by convolving the predicted rotational, thermal, and instrumental line broadening, where rotational profiles were derived by assuming solid body rotation at the stellar surface (e.g. Gray, 1992). In our final synthesis of Capella theoretical line profiles, we have adopted a rotational velocity value of the G1 star (36 km s-1; (Griffin & Griffin, 1986)). The width of the thermal profile is calculated as the weighted average of the thermal widths computed at various temperatures where the weighting function is given by the product of the emission measure and the line emissivity at each temperature. The FWHM of the thermal width for a given ion, at a given temperature, is then described by:
| (5) |
where is the emission measure, is the emissivity, is the electron temperature, is the Boltzmann constant, and is the ion mass. We derived an emission measure for Capella based on the measured line strength ratios of H-like and He-like ions, as described by Drake (2004b, in preparation). This method of using line strength ratios to derive an emission measure is similar to what is described in Schmitt & Ness (2004, in press). We defer a detailed discussion of this analysis to a future paper, but emphasize that the final thermal profile does not depend critically on the exact details of the emission measure distribution: choosing a single isothermal emission measure at a temperature of produced very similar results.
Line profiles for the H-like Lyman- doublets of O VIII, Ne X, and Mg XII were each modeled with the doublet wavelength separation fixed at for Ne X and Mg XII, and for O VIII (Young et al., 2003). Both components of a given line were forced to have the same line width, and relative fluxes of the two components were fixed at the theoretical ratio of 2:1.
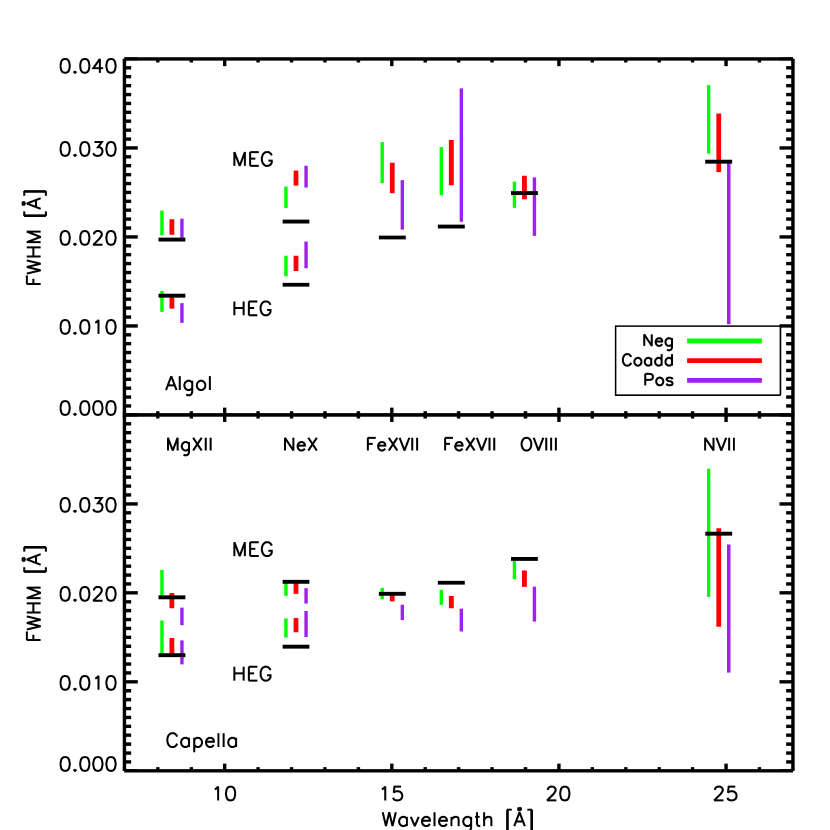
The final theoretical line profiles are then created by convolving the rotational and thermal profiles with the expected instrumental broadening. The instrumental line profile was derived from high-fidelity ray-traces of the Chandra instruments (Marshall et al., 2003, in press). The predicted and observed line widths are compared in Table LABEL:t:linewidths and Figure 5. These comparisons show that the theoretical Capella line widths are in good agreement with the observed line widths of the data. We are therefore confident that the current model of the instrumental line broadening is sufficient to yield theoretical profiles that are accurate to within errors of the observed Algol line widths.
3.4.2 Algol Line Widths
Prior to measuring the Algol line widths, we eliminated line broadening due to the orbital velocity of Algol B by shifting the event positions by the predicted amount (). Here, we adopt the true radius of orbit of Algol B, ; we also performed the same line width analysis assuming the smaller of the two effective radii, found from the Doppler shifts above, but found no significant differences between the two. The negative and positive order spectra were then coadded. Great care has to be taken here. Bright sources such as Algol suffer from significant pile-up in the 0th order, resulting in a distorted source profile. This distortion can confuse the standard pipeline 0th order location algorithm, resulting in a computed centroid that does not correspond exactly to the true centroid. If the 0th order centroid location is not precise, there will be a systematic wavelength shift between opposite orders. Co-addition of the opposite orders will then produce an artificially broadened line profile. In order to avoid this problem, we therefore ensured that the line centroids in opposite spectral orders were identical prior to co-addition, on a line by line basis. The widths of lines listed in Table LABEL:t:whichlines were then measured by fitting with a modified Lorentzian function (equation 1).
Since the measured line widths are sensitive to the adopted level of the continuum, we have computed a model continuum based on the derived emission measure distribution of Algol and have used this to guide continuum placement. In this way, the continuum level adopted makes use of the signal in the spectrum over a broad wavelength range and accurate placement can be achieved such that final uncertainties in measured line quantities do not have a significant contribution from continuum placement errors. The final continuum placement was done by eye, using effectively “line free” regions as a guide. In order to verify that this continuum placement did not introduce significant errors in our line parameters, we performed a sensitivity test by changing the adopted continuum level by different amounts that stretched plausibility regarding the true continuum level, and re-measuring lines for the different levels. Although the continuum placement is partly subjective because of the pseudo-continuum due to the presence of weak lines and broad wings of closely spaced lines, in the worst case the uncertainty of the FWHM of any of our lines resulting from uncertainties in continuum placement is not more than 0.002 Å. For some of the stronger lines, such as Ne X, it is unlikely that the line width uncertainty is at most 0.001 Å.
Theoretical profiles for Algol were generated in the same way as described for Capella in §3.4.1. The theoretical FWHM were then compared to the measured line widths of the observed data; these comparisons are listed in Table LABEL:t:linewidths and illustrated in Figure 5. We find some evidence for moderate excess line broadening in several of the emission lines. In the MEG spectra, all lines but N VII, O VIII, and Mg XII show signs of significant excess line widths. The two Fe XVII lines, Ne X, and Mg XII show significant excess line widths, ranging from 3 to almost 6. In the HEG data, Ne X shows an excess width of 3, though Mg XII shows no sign of excess line broadening.
In order to determine whether any of the observed excess broadening could be due to the flare activity in the first part of the observation we also performed the analysis described above for flare and quiescent periods. Line widths for both periods were found to be consistent within statistical uncertainties.
3.4.3 Turbulent or Flow Velocities
The excess widths we have detected in Algol may be attributed to either or both of two plausible sources of non-thermal velocities: turbulence or flows within coronal structures, and “excess” rotational broadening above what is expected from surface emission.
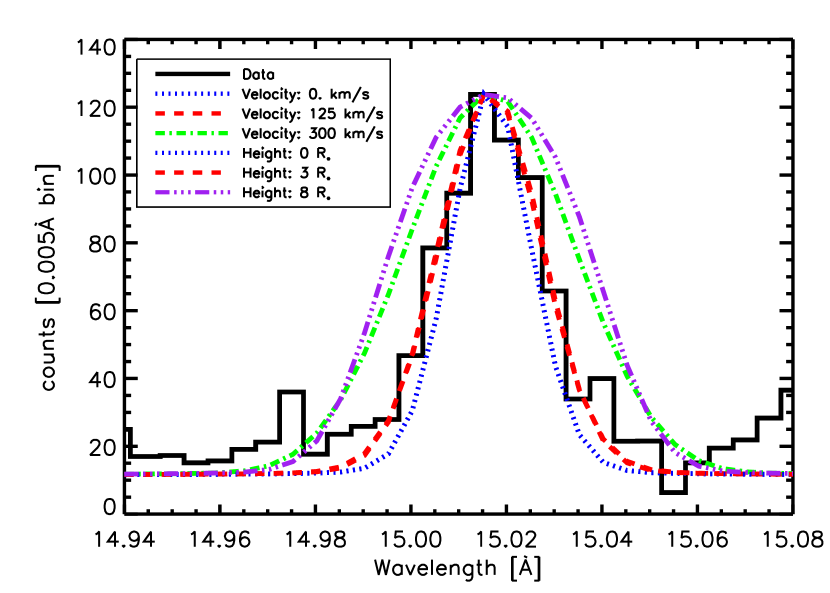
Figure 6 is an example comparison between observed and theoretical line profiles. This figure shows that a theoretical profile with an additional Gaussian velocity of 125 km s-1 is a reasonably good match to the Fe XVII line, while an additional velocity of 300 km s-1 is too wide, and a velocity of 0 km s-1 is too narrow.
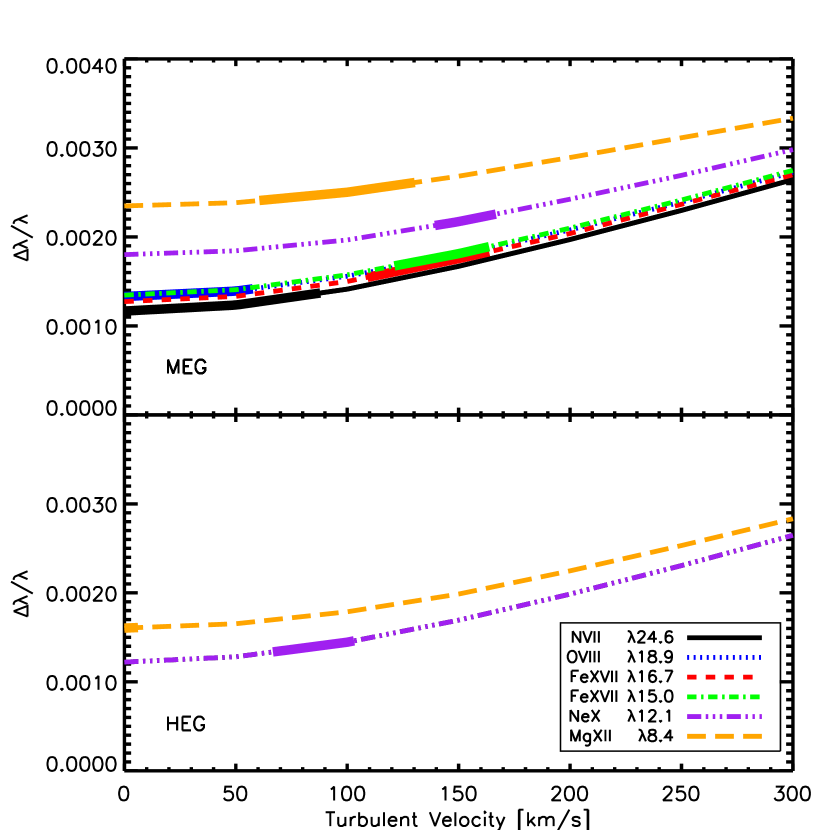
We obtain a crude estimate of the turbulent velocities involved by comparison of observed and theoretical line profiles, computed as described in the previous section. We convolved the latter with an additional Gaussian broadening corresponding to a range of velocities from 0 to 300 km s-1. Figure 7 illustrates the FWHM of these synthesized profiles as a function of the additional non-thermal velocity, and also indicates where the observed FWHM fall on these curves.
Most of the lines we have analyzed show observed FWHM that correspond to additional velocities of 50-150 km s-1. We are able to place an upper-limit on additional turbulent velocities at 170 km s-1.
3.4.4 Rotational Broadening
Excess rotational broadening can occur if the corona on Algol B is significantly radially extended. Line widths can therefore be used to place direct spectroscopic constraints on this radial extension. Limits on the radial extent of the corona of Algol B were determined by comparison of observed and theoretical profiles computed for different scale heights. We varied the scale height of the theoretical rotational profiles from within the stellar surface (zero rotation) to 8.75, where the scale height is defined as zero at the stellar surface. Then we convolved these with the thermal and instrumental broadening, as before. The final profiles are compared with the Fe XVII 15.01 Å resonance line in Figure 6. This figure shows good qualitative agreement with a profile computed for coronal scale height of 3; a scale height of 8 is clearly too broad, while purely surface rotational broadening is too narrow.
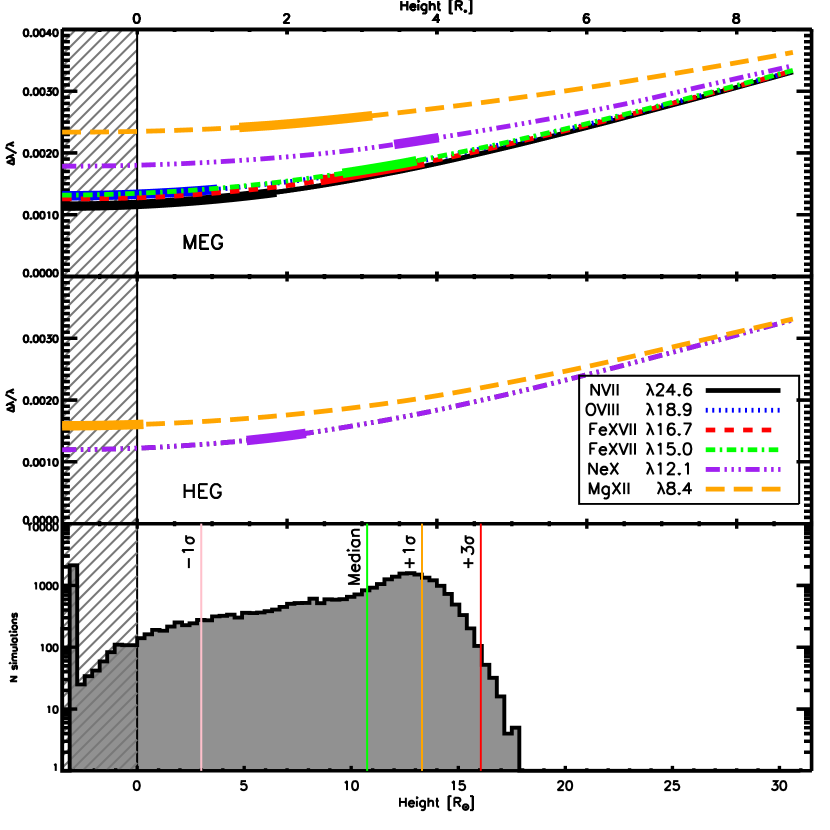
The upper two panels of Figure 8 show the FWHM of the theoretical profiles as a function of coronal scale height, together with the observed FWHM overplotted in thicker lines. More than half of the observed FWHM fall approximately at a scale height of 2 to 3, which corresponds to an excess rotational velocity of 125 to 185 km s-1, in addition to the rotational velocity at the stellar surface ( 62 km s-1).
The bottom panel of Figure 8 shows a distribution of scale heights which were derived by randomly generating a set of line widths that are distributed in a Gaussian manner, centered on the measured line width of each emission line. The number of monte-carlo realizations for each emission line was weighted by the measured flux of that line. We generated a total of 30087 realizations for all lines combined. We then obtained the scale height that corresponds to each realization of a line width by interpolating along the theoretical curves shown in the top two panels of Figure 8. The lowest panel of Figure 8 shows the distribution of the scale heights for all realizations of line widths, for both MEG and HEG. Vertical lines indicate the median scale height, and the 1 and 3 limits. The median indicates a scale height of 3.1, with 1 and 3 upper limits occurring at scale heights of 3.8 and 4.6 stellar radii, respectively. The lower 1 limit occurs at 0.9. In the case of line width realizations that are smaller than what is physically possible, these scale heights have been set equal to -1, which accounts for the large peak at -1.
3.4.5 O VII ratio
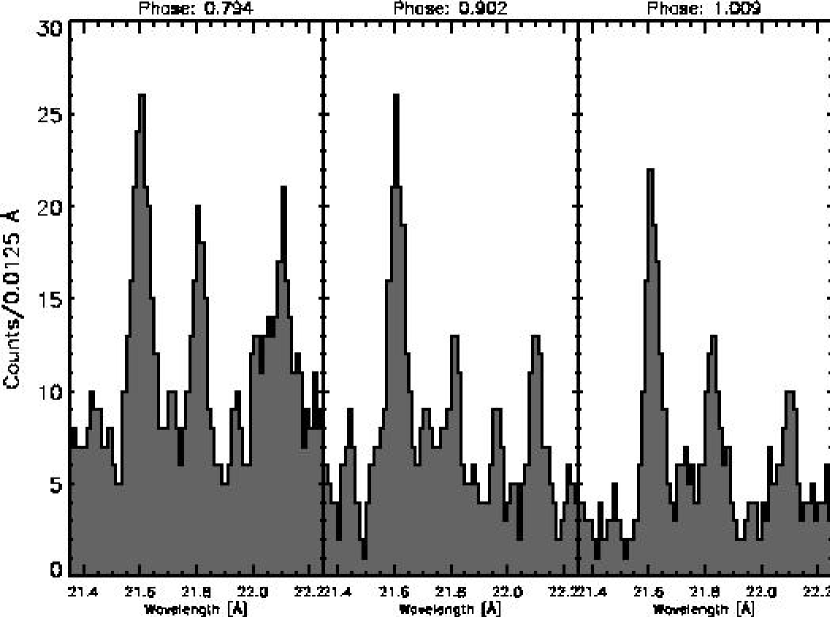
The UV excitation of the term by Algol A provides a possible test of coronal geometric extent. In the spherically-symmetric case, a very compact corona should exhibit modulation of the ratio of the forbidden and intercombination lines, , with orbital phase: at phase —primary optical eclipse—the visible hemisphere of Algol B is not illuminated by Algol A and the ratio should revert very closely to its pressure-dominated value. The active star survey of Testa et al. (2004, in preparation) indicates that this ratio should be -3, instead of 0.94, as observed by Ness et al. (2002).
There is no evidence for orbital modulation of the ratio in the HETGS observation; this is not surprising because the observation covered only those phases during which the visible K star corona was substantially illuminated by Algol A. We have therefore re-examined the LETGS observation (ObsID 2) that covers phases -1.03 to search for evidence of orbital-modulated changes in the ratio. The end of this observation corresponds to primary eclipse when the visible hemisphere of the K star is not irradiated by Algol A.
We split the Algol LETGS data into three phase bins (lacking the signal in the O VII lines to make more fine divisions) and examined the relative strengths of the intercombination and forbidden lines at 21.80 Å and 22.10 Å. The spectral region containing these lines is illustrated for the three phase bins in Figure 10: there is no perceptible change in the ratio between these different bins.
4 Discussion
4.1 Orbital Velocity
By modeling observed Doppler shifts in terms of orbital motion, we were able to estimate the effective orbital radius of the X-ray emitting material. We found this effective radius to be 0.93 from the analysis of individual emission lines, and 0.29 from the cross-correlation analysis; these results are consistent within uncertainties. The statistical uncertainties in the cross-correlation method are considerably lower because all the information in the spectrum is used, rather than just information in bright lines. The 1 error bar of the line-of-sight velocities obtained via the cross-correlation analysis is 8 km s-1 for the MEG data and 11 km s-1 for the HEG data. However, limitations due to uncertainties in the calibration of the Chandra instruments cause systematic uncertainties which appear somewhat larger than what is implied by the statistical uncertainties. For example, a few of the data points in Figure 4 show discrepancies between the MEG and HEG results, by 2.
In comparison with the X-ray Doppler radius, the orbital radius of Algol B around the system center of mass is (Richards, 1993). Since the effective radius we have derived is smaller than , we can infer that the X-ray emitting material is in fact not perfectly centered on Algol B, but is shifted slightly inward toward the primary star. The effective orbital radius of the X-ray emission allows us to place a constraint on the possible contribution from Algol A—emission that would skew the apparent X-ray Doppler radius toward the center of gravity.
As mentioned in §1, it has been argued that accretion onto the primary star could be a source of X-rays. If this were true, a small X-ray contribution from the accretion activity of Algol A could explain the inward shift of the effective radius of X-ray emitting material. Assuming that the emission of the K star corona is centered on the star itself, an effective radius of for the X-ray emission would indicate that 85% of the total X-ray emission is from Algol B, and the remaining 15% is from Algol A.
Singh et al. (1996) considered the issue of accretion-driven X-ray emission in Algol-type binaries in their comparison between Algols and RS CVn-type binaries. The latter are comprised of two late-type stars in which neither component filled their Roche lobes. Singh et al. (1996) found that the Algol-type binaries are in fact slightly X-ray deficient relative to their RS CVn cousins, suggesting strongly that the accretion activity of Algol-type binaries is not a significant source of X-rays. The 15% effect we are seeking here would, however, be quite inconspicuous in this type of statistical study.
The possibility of accretion giving rise to significant X-ray flux in Algol was reviewed by Pustylnik (1995). Two key parameters are the shock temperature of the accreting gas, and the mass transfer rate. It seems unlikely that the accretion shock can exceed K, and Pustylnik suggests a maximum X-ray luminosity from accretion of about erg s-1 based on a mass transfer estimate of order yr-1. The X-ray luminosity of Algol as measured from the HETG observation analyzed here is about erg s-1 (Testa et al., 2004, in preparation); accretion does therefore appear sufficient to account for % of the total luminosity. One test of this would be whether or not lines formed only above K—lines that could only plausibly originate from coronal emission—show the same center of gravity as lines formed at cooler temperatures. Unfortunately, our data are of insufficient quality to perform this test since only weaker lines in the spectrum exclusively originate from such hot plasma. The brightest line formed at these higher temperatures is H-like Si XIV 6.18. The line-of-sight velocity as a function of orbital phase indicated by this line is consistent within statistical uncertainties with the velocity seen in the other, cooler lines (Figure 3). However, measurement errors are sufficiently large that we cannot rule out differences at the 15% level.
Evidence for plasma associated with accretion and with temperatures of at least K has, however, been found in the Algol systems V356 Sgr and TT Hya from recent FUSE observations (Polidan et al., 2000; Peters et al., 2001, respectively). Emission detected from O VI appeared to be associated with a bipolar flow that makes a large angle with the orbital plane. However, in order for this plasma to contribute significantly at X-ray wavelengths, it must be comprised of components at least an order of magnitude hotter than the formation temperature of O VI.
Another possible, and we suggest more likely, explanation for the inward shift of the effective radius is that the corona of Algol B is not spherically symmetric or exactly centered on the center of mass of Algol B, but rather has some asymmetry and structure on the side facing inward, toward Algol A. The surface of Algol B itself will be severely distended in this direction by the gravitational field of Algol A—the Roche lobe filling factor for Algol B is expected to be very close to unity, such that any equatorial corona could well lie beyond the L1 point and would not be gravitationally bound to Algol B. We illustrate the approximate geometry of the system in Figure 9. This figure was produced using the Nightfall program222http://www.lsw.uni-heidelberg.de/users/rwichman/Nightfall.html by R. Wichmann, which accounts for the relative masses of the two stars, the Roche lobe filling factors, and inclination of the orbit.
We also note that, in the X-ray lightcurve (Figure 2), we see a flare just as Algol B comes out of eclipse. This flare does not have a sharp rise, but a more gradual one that appears to start before eclipse egress. It is possible that this flaring plasma is located on the hemisphere facing Algol A, and that the characteristics of its intensity evolution over time are modulated by the eclipse. If the flaring plasma is indeed located on the hemisphere facing Algol A, this could also explain why the effective radius of the X-ray emission during this observation is shifted toward Algol A.
4.2 Non-thermal Broadening
By comparing observed with theoretical line widths, we have some found evidence for moderate excess line widths that we attribute to the possible presence of non-thermal broadening. While not definitive, this result is supported by recent analyses of far ultraviolet spectra obtained by the Hubble Space Telescope (Ayres et al., 2003) and the Far Ultraviolet Explorer (Redfield et al., 2003). Both studies report the need for excess line broadening to understand the profiles of the forbidden lines of Fe XXI at 1354 Å and Fe XVIII at 976 Å in the more active stars of their sample with the largest projected rotational velocities ().
4.2.1 Flows or Explosive Events?
One source of excess broadening might be turbulence or “explosive events”. Our line profile analysis (e.g., Figures 7 & 6) suggests that a random velocity component of km s-1 could explain the observed line widths. This is similar to the sound speed at K. Such a velocity is reminiscent of the non-thermal broadening of over 100 km s-1 seen in transition region lines of stars of different activity as reviewed by Wood et al. (1997). It was suggested in this body of work that the broadening might be caused by the acceleration of plasma in magnetic reconnection events associated with microflaring. It is possible that the broadening we see in hot X-ray lines is related to this.
Other types of flows are also possible. Winebarger et al. (2002) observed flows with velocities up to 40 km s-1 in solar coronal loops based on detailed Transition Region and Coronal Explorer (TRACE) time-resolved imaging and simultaneous Solar and Heliospheric Observatory (SoHO) SUMER spectra. While the velocities inferred here are three times this, it is not difficult to envisage faster flows when considering that the coronal energy deposition rate of Algol B is times that of the Sun.
However, as pointed out by Redfield et al. (2003), in both the above cases the broadening mechanisms should be ubiquitous among the more active stars and should not be seen only in those with the largest .
4.2.2 Rotational Broadening and Coronal Scale Height
Another possible source of excess line widths is rotational broadening originating in a corona with significantly radially-extended structure. As noted in §1, the evidence from observations of Algol during eclipse does not provide an unambiguous picture, with some observations requiring apparently extended coronae (White et al., 1986), and others being consistent with scale heights of a stellar radius or less (Antunes et al., 1994; Ottmann, 1994).
The scale height for plasma of mean molecular weight at a temperature on a star of mass and radius is . The parameters for Algol B were summarized recently by Drake (2003), who adopted and (see also Richards et al., 1988; Kim, 1989). For a coronal temperature K on Algol B, the scale height is then about in the absence of strong centrifugal forces. Our median scale height and 1 upper limit are 3.1 and 3.8, respectively. While this is slightly larger than the thermal scale height in the absence of strong centrifugal forces arising from rapid rotation, it is important to keep in mind the following things. Firstly, the line profile analysis depends on subtraction of the dominant instrumental and thermal broadening components and is inherently prone to additional systematic error arising as a result of imperfections in the description of these dominant effects. Secondly, for a corona on Algol B with a radial extent comparable to the stellar radius, the competition between gravitational and centrifugal forces becomes significant: centrifugal acceleration on a single star with the same rotation rate is equivalent to gravitational acceleration at a height of . While the binary nature of Algol complicates the picture, it is possible that some regions of an extended corona comprise plasma bound by magnetic fields, as has been discussed in connection with other rapidly rotating stars, such as AB Dor (e.g. Jardine & Unruh, 1999). (See also Schmitt et al. (1997) who concludes that the 1032 Å O VI profile of AB Dor, observed with ORPHEUS, is not rotationally broadened beyond the photospheric surface value.)
We conclude that, in the interpretation that the tentative evidence for excess line widths is the result of rotational broadening, the extension of the corona would be similar to the expected thermal scale height and comparable to the stellar radius. This interpretation is consistent with that of Redfield et al. (2003) based on their FUSE analysis of active stars. These authors suggested that their excess line widths could result from coronal structures with heights up to . Such a picture would also be consistent with the eclipse studies of Antunes et al. (1994) and Ottmann (1994). With regard to eclipses, it is important to note that extended structure at the stellar poles would give rise to no obvious X-ray eclipse. However, pole-dominated emission also would not give rise to strong rotational broadening. Our results suggest that, if rotational broadening is the correct interpretation for our observed line widths, this emission must be distributed around the star and not concentrated at the poles.
The HETG observation does cover the secondary optical eclipse, and there is some evidence that we do indeed see some obscuration of the X-ray corona, despite the complications presented by the flare. We have computed theoretical X-ray lightcurves for Algol using a spherically-symmetric, optically-thin emitting shell coronal model. The model assumes that Algol A is 100% X-ray dark, and uses the following physical and orbital parameters: , , , , days, and degrees (Hill et al., 1971; Tomkin & Lambert, 1978; Richards et al., 1988). Theoretical lightcurves were calculated for an array of Algol B coronal scale heights, ranging from 0.1 to 4.0 stellar radii. Figure 2 shows the observed lightcurve of Algol with three theoretical lightcurves of various scale heights overplotted. Also plotted is a similar curve computed for polar emission restricted to high latitudes corresponding to the scale height predicted by quasi-static loop models (see below). If we assume that the count rate at phase 0.5 represents the quiescent level of Algol B, as does the level toward the end of the observation, we can see from the overplotted models that scale heights of - represent the data reasonably well. The polar emission model clearly does not represent the observed eclipse minimum; we discuss this further below.
A scale height commensurate with the thermal scale height would appear to clash with the recent interpretation of density-sensitive line ratios seen in Chandra LETGS observations of Algol by Ness et al. (2002). The interpretation of helium-like line ratios in terms of plasma density is complicated in the case of Algol by the radiation field of Algol A, which is sufficiently strong to cause significant radiative excitation of electrons from the upper level of the forbidden line to the upper level of the intercombination line through the transition in the ions C, N and O. Nevertheless, Ness et al. (2002) pointed out that, even with densities of order cm-3—similar to those found for other active stars in the extensive survey of Testa et al. (2004, in preparation)—simple quasi-static coronal loop model scaling laws (e.g. Craig et al., 1978; Rosner et al., 1978; Jordan, 1980) that predict that loop peak temperature , pressure and length are related by , suggest maximum loop lengths of order a few cm. This is only a fraction of the radius of Algol B.
4.2.3 Ratio and Coronal Extent
As mentioned in §3.4.5, there was no detectable orbital modulation of the O VII ratio in the Algol LETGS data, which was observed during orbital phase -1.03. Schmitt et al. (2003) also found no differences in the ratio of Algol spectra which was extracted during the quiescent and flaring phases of an XMM-Newton observation.
This result has important implications. If we assume that the corona of Algol is indeed similar to that of other active stars, such as its “coronal twin” HR 1099 (Drake, 2003), then we must conclude that the bulk of the O VII emission is always illuminated by Algol A. This can be achieved by having a fairly extended corona with a scale height , as our line profile analysis indicates. Instead, if the O VII emitting coronal structures are compact compared to the stellar radius, then they must reside predominantly at the poles where the Algol A UV radiation field is not significantly shadowed at primary eclipse. If scale heights are fairly large (), the classical quasi-static loop scaling laws must then be quite inapplicable to these coronal structures. In the case of compact (by necessity) quasi-static loops with a plasma density of a few cm-3, Ness et al. (2002) estimate a coronal volumetric filling factor of up to 0.3—unreasonably large for emission confined to polar regions. As noted earlier in this section, the synthetic lightcurve computed for the case of polar emission with a scale height of , similar to that predicted by quasi-static models, is a very poor match to the observed eclipse minimum light (Figure 2). This model predicts very sharp eclipses which have never been observed in X-ray observations of Algol.
In summary, the combined evidence of a tentative detection of excess line widths, the shape of the X-ray lightcurve, and the lack of orbital modulation of the O VII ratio going into primary eclipse, all point to the plasma source at temperatures up to several K having a scale height of the same order as the stellar radius, and being distributed around the K star. Such distributed coronal structure could be responsible for, e.g., the flaring at lower latitudes, which was inferred by Schmitt et al. (2003) based on an XMM-Newton X-ray lightcurve. Unfortunately, the X-ray data alone cannot rule out other scenarios involving compact structures, though these would require special and fortuitous placement of dominant active regions in order to remain consistent with past and present observations of the coronal emission of Algol. White et al. (1986) drew similar conclusions based on the failure to observe a strong X-ray eclipse in the EXOSAT observation, though with the benefit of not having seen data from subsequent observations that have led to strong ambiguities in interpretation. Our favored picture of the X-ray emission of Algol is also consistent with the picture painted by Favata et al. (2000), and with the interpretation of excess line widths seen in UV and FUV coronal forbidden lines by Redfield et al. (2003). What we have not tackled in this article, however, is the very hot ( K) plasma that often flares and seems to be located at the poles. The recent plasma density survey of Testa et al. (2004, in preparation) indicates that this very hot material is at much higher densities of cm-3, and so occupies quite different structures. These are likely to be the structures responsible for pole-dominated flaring activity, such as that highlighted by Schmitt & Favata (1999).
5 Conclusions
A detailed analysis of high quality Chandra HETGS spectra of the Algol system provides new insights into the geometry of the X-ray emission in this system. Based on this analysis we draw the following conclusions:
-
1.
Our study clearly reveals Doppler shifts of the X-ray emitting plasma corresponding to orbital motion with a velocity at quadrature of 150 km s-1. These data thus provide the first definitive proof that the coronal activity of Algol B dominates the X-ray emission of the system, as has long been suspected (e.g., White et al., 1980).
-
2.
The observed Doppler motion of the X-ray plasma on Algol B appears to be off-center relative to the stellar center of mass, and shifted toward Algol A. We suggest that this occurs as a result of the tidal distortion of the surface of Algol B. The HETGS light curve exhibits a flare near secondary eclipse which, if located on the hemisphere facing the primary B8 star as expected, might also suggest the presence of a dominant active region that could bias the emission toward a slightly smaller orbital radius.
-
3.
Alternatively, X-ray activity of Algol A, possibly as a result of accretion from Algol B, could be responsible for the smaller apparent orbital radius of the X-ray emission. In this case, we estimate that such a contribution amounts to no more than 15% of the total emission. Such an X-ray flux would be consistent with current ideas as to the plausible range of accretion activity in Algol.
-
4.
We have found some evidence for excess line broadening in bright X-ray emission lines, above that expected from surface rotation and thermal motions. If this effect is real, it suggests broadening by rotation of a radially-extended corona. The observed widths would require a coronal scale height of at least one stellar radius. This would be consistent with recent observations that detected excess broadening in the forbidden Fe XVIII 974 Å line, seen in FUSE FUV spectra of rapidly rotating active stars.
-
5.
While turbulence, microflares or flows could also produce excess line broadening, the idea of a coronal plasma with significant radial extent is also supported by UV-sensitive lines of O VII seen in an LETGS observation of Algol. No change in the UV-sensitive lines was seen going into primary eclipse, when the majority of the visible hemisphere of Algol B was shadowed from the radiation field of Algol A.
-
6.
While it is possible that other physical effects are responsible for excess line widths and lack of modulation of the UV-sensitive O VII lines, coronal extension would appear to be the most likely. A consistently high plasma density of a few cm-3, as would be indicated by the O VII lines in the absence of UV excitation, would be unlike any of the densities seen at O VII temperatures in the sample of active stars surveyed by Testa et al. (2004, in preparation). This picture also appears to be consistent with conclusions drawn from recent lightcurve analyses which were summarized in §1.
Coupled with the results of the coronal density survey of Testa et al. (2004, in preparation), we can summarize as follows. Coronal plasma with temperatures of up to several K appears to have a significant component lying in extended structures with a scale size similar to the stellar radius and densities typically of a few cm-3—similar to solar active regions. Very hot coronal plasma appears more exclusively in much more compact regions with densities of order cm-3, and in very active, rapidly rotating stars appears to be concentrated more toward stellar poles. Further spectroscopic studies of these apparently different coronal regimes, especially with regard to possible abundance anomaly differences between them, should prove very interesting.
This work was supported by NASA contracts NAS8-39073 and NAS8-03060 to the Chandra X-Ray Center, as well as NAG5-9322 which provides financial assistance in the development of the PINTofALE package.
| Algol | Capella | ||||
|---|---|---|---|---|---|
| Algol observed | Capella observed | predicted | predicted | Algol excess | |
| 24.78 | 0.0306 0.0033 | 0.0217 0.0055 | 0.0285 | 0.0267 | 0.0021 |
| 18.97 | 0.0256 0.0013 | 0.0216 0.0009 | 0.0249 | 0.0238 | 0.0006 |
| 16.78 | 0.0284 0.0025 | 0.0190 0.0007 | 0.0212 | 0.0211 | 0.0072 |
| 15.01 | 0.0266 0.0017 | 0.0196 0.0005 | 0.0199 | 0.0199 | 0.0067 |
| 12.13 | 0.0266 0.0008 | 0.0205 0.0006 | 0.0217 | 0.0212 | 0.0049 |
| 8.42 | 0.0211 0.0009 | 0.0191 0.0008 | 0.0197 | 0.0195 | 0.0014 |
| 12.13 | 0.0170 0.0008 | 0.0164 0.0008 | 0.0146 | 0.0140 | 0.0024 |
| 8.42 | 0.0127 0.0008 | 0.0139 0.0010 | 0.0134 | 0.0130 | -0.0006 |
References
- Antunes et al. (1994) Antunes, A., Nagase, F., & White, N. E. 1994, ApJ, 436, L83
- Ayres et al. (2003) Ayres, T. R., Brown, A., Harper, G. M., Osten, R. A., Linsky, J. L., Wood, B. E., & Redfield, S. 2003, ApJ, 583, 963
- Craig et al. (1978) Craig, I. J. D., McClymont, A. N., & Underwood, J. H. 1978, A&A, 70, 1
- Drake (2003) Drake, J. J. 2003, ApJ, 594, 496
- Drake (2004a) —. 2004a, ApJ, in preparation
- Drake (2004b) —. 2004b, ApJ, in preparation
- Favata et al. (2000) Favata, F., Micela, G., Reale, F., Sciortino, S., & Schmitt, J. H. M. M. 2000, A&A, 362, 628
- Gray (1992) Gray, D. F. 1992, The observation and analysis of stellar photospheres (Cambridge Astrophysics Series, Cambridge: Cambridge University Press, 1992, 2nd ed., ISBN 0521403200.)
- Griffin & Griffin (1986) Griffin, R. & Griffin, R. 1986, Journal of Astrophysics and Astronomy, 7, 45
- Harnden et al. (1977) Harnden, F. R., Fabricant, D., Topka, K., Flannery, B. P., Tucker, W. H., & Gorenstein, P. 1977, ApJ, 214, 418
- Hill et al. (1971) Hill, G., Barnes, J. V., Hutchings, J. B., & Pearce, J. A. 1971, ApJ, 168, 443
- Jardine & Unruh (1999) Jardine, M. & Unruh, Y. C. 1999, A&A, 346, 883
- Johnson et al. (2002) Johnson, O., Drake, J. J., Kashyap, V., Brickhouse, N. S., Dupree, A. K., Freeman, P., Young, P. R., & Kriss, G. A. 2002, ApJ, 565, L97
- Jordan (1980) Jordan, C. 1980, A&A, 86, 355
- Kashyap & Drake (2000) Kashyap, V. & Drake, J. J. 2000, Bulletin of the Astronomical Society of India, 28, 475
- Kim (1989) Kim, H. 1989, ApJ, 342, 1061
- Markert et al. (1994) Markert, T. H., Canizares, C. R., Dewey, D., McGuirk, M., Pak, C. S., & Schattenburg, M. L. 1994, in Proc. SPIE Vol. 2280, p. 168-180, EUV, X-Ray, and Gamma-Ray Instrumentation for Astronomy V, Oswald H. Siegmund; John V. Vallerga; Eds., 168–180
- Marshall et al. (2003) Marshall, H., Dewey, D., & Ishibashi, K. 2003, in press
- Mutel et al. (1998) Mutel, R. L., Molnar, L. A., Waltman, E. B., & Ghigo, F. D. 1998, ApJ, 507, 371
- Ness et al. (2002) Ness, J.-U., Schmitt, J. H. M. M., Burwitz, V., Mewe, R., & Predehl, P. 2002, A&A, 387, 1032
- Ottmann (1994) Ottmann, R. 1994, A&A, 286, L27
- Pallavicini et al. (1981) Pallavicini, R., Golub, L., Rosner, R., Vaiana, G. S., Ayres, T., & Linsky, J. L. 1981, ApJ, 248, 279
- Peters et al. (2001) Peters, G. J., Polidan, R. S., & Lynch, D. E. 2001, Bulletin of the American Astronomical Society, 33, 848
- Polidan et al. (2000) Polidan, R. S., Peters, G. J., & Lynch, D. E. 2000, Bulletin of the American Astronomical Society, 197, 807
- Pustylnik (1995) Pustylnik, I. 1995, Baltic Astronomy, 4, 64
- Redfield et al. (2003) Redfield, S., Ayres, T. R., Linsky, J. L., Ake, T. B., Dupree, A. K., Robinson, R. D., & Young, P. R. 2003, ApJ, 585, 993
- Richards (1993) Richards, M. T. 1993, ApJS, 86, 255
- Richards et al. (1988) Richards, M. T., Mochnacki, S. W., & Bolton, C. T. 1988, AJ, 96, 326
- Rosner et al. (1978) Rosner, R., Golub, L., Coppi, B., & Vaiana, G. S. 1978, ApJ, 222, 317
- Schmitt & Favata (1999) Schmitt, J. H. M. M. & Favata, F. 1999, Nature, 401, 44
- Schmitt et al. (1997) Schmitt, J. H. M. M., Krautter, J., Appenzeller, I., Mandel, H., Wichmann, R., Barnstedt, J., Goelz, M., Grewing, M., Gringel, W., Haas, C., Hopfensitz, W., Kappelmann, N., & Kraemer, G. 1997, A&A, 325, 249
- Schmitt & Ness (2004) Schmitt, J. H. M. M. & Ness, J.-U. 2004, A&A, in press
- Schmitt et al. (2003) Schmitt, J. H. M. M., Ness, J.-U., & Franco, G. 2003, A&A, 412, 849
- Simon & Drake (1989) Simon, T. & Drake, S. A. 1989, ApJ, 346, 303
- Singh et al. (1996) Singh, K. P., Drake, S. A., & White, N. E. 1996, AJ, 111, 2415
- Strassmeier (2000) Strassmeier, K. G. 2000, A&A, 357, 608
- Testa et al. (2004) Testa, P., Drake, J. J., & Peres, G. 2004, ApJ, in preparation
- Tomkin & Lambert (1978) Tomkin, J. & Lambert, D. L. 1978, ApJ, 222, L119
- Uchida & Sakurai (1983) Uchida, Y. & Sakurai, T. 1983, in ASSL Vol. 102: IAU Colloq. 71: Activity in Red-Dwarf Stars, 629–632
- White et al. (1980) White, N. E., Becker, R. H., Holt, S. S., Boldt, E. A., & Serlemitsos, P. J. 1980, ApJ, 239, L69
- White et al. (1986) White, N. E., Culhane, J. L., Parmar, A. N., Kellett, B. J., Kahn, S., van den Oord, G. H. J., & Kuijpers, J. 1986, ApJ, 301, 262
- Wilson (1953) Wilson, R. E. 1953, Carnegie Institute Washington D.C. Publication, 0
- Winebarger et al. (2002) Winebarger, A. R., Warren, H., van Ballegooijen, A., DeLuca, E. E., & Golub, L. 2002, ApJ, 567, L89
- Wood et al. (1997) Wood, B. E., Linsky, J. L., & Ayres, T. R. 1997, ApJ, 478, 745
- Young et al. (2003) Young, P. R., Del Zanna, G., Landi, E., Dere, K. P., Mason, H. E., & Landini, M. 2003, ApJS, 144, 135
- Young et al. (2001) Young, P. R., Dupree, A. K., Wood, B. E., Redfield, S., Linsky, J. L., Ake, T. B., & Moos, H. W. 2001, ApJ, 555, L121