A SURVEY OF STAR-FORMING GALAXIES IN THE ‘REDSHIFT DESERT’: OVERVIEW 11affiliation: Based, in part, on data obtained at the W.M. Keck Observatory, which is operated as a scientific partnership among the California Institute of Technology, the University of California, and NASA, and was made possible by the generous financial support of the W.M. Keck Foundation.
Abstract
The redshift interval has been described by some as the ‘redshift desert’ because of historical difficulties in spectroscopically identifying galaxies in that range. In fact, galaxies can be found in large numbers with standard broad-band color selection techniques coupled to follow-up spectroscopy with UV and blue-sensitive spectrographs. In this paper we present the first results of a large-scale survey of such objects, carried out with the blue channel of the LRIS spectrograph (LRIS-B) on the Keck I telescope. We introduce two samples of star forming galaxies, ‘BX’ galaxies at and ‘BM’ galaxies at . In seven survey fields we have spectroscopically confirmed 749 of the former and 114 of the latter. Interlopers (defined as objects at ) account for less than 10% of the photometric candidates, and the fraction of faint AGN is % in the combined BX/BM sample. Deep near-IR photometry of a subset of the BX sample indicates that, compared to a sample of similarly UV-selected galaxies at , the galaxies are on average significantly redder in (), indicating longer star formation histories, increased reddening by dust, or both. Using near-IR H spectra of a subset of BX/BM galaxies to define the galaxies’ systemic redshifts, we show that the galactic-scale winds which are a feature of star-forming galaxies at are also common at later epochs and have similar bulk outflow speeds of 200-300 km s-1. We illustrate by example the information which can be deduced on the stellar populations, metallicities, and kinematics of “redshift desert” galaxies from easily accessible rest-frame far-UV and rest-frame optical spectra. Far from being hostile to observations, the universe at is uniquely suited to providing information on the astrophysics of star-forming galaxies and the intergalactic medium, and the relationship between the two.
Subject headings:
cosmology: observations — galaxies: evolution — galaxies: high-redshift — galaxies: kinematics and dynamics — galaxies: starburst — stars: formation1. INTRODUCTION
A number of different observations point to the redshift range as a particularly important epoch in the history of star formation, accretion onto massive black holes, and galaxy assembly. Recent successes in identifying the luminous but heavily obscured galaxies selected at sub-mm and radio wavelengths have shown that they are mostly at redshifts (Chapman et al. 2003); this is also the epoch when the number density of luminous quasi-stellar objects (QSOs) peaked (e.g., Di Matteo et al. 2003 and references therein). The evolution of the ultraviolet (UV) luminosity density of the universe is now mapped out with reasonable precision over the redshift range (e.g., Madau et al. 1996; Connolly et al. 1997; Steidel et al. 1999; Giavalisco et al. 2003), but there remains a glaring gap between and , an epoch when much of today’s stellar mass was assembled and heavy elements were produced (e.g., Dickinson et al. 2003; Fontana et al. 2003; Rudnick et al. 2003). The reason for this gap is that such redshifts, while only ‘modest’ by current standards in distant galaxy hunting, have remained challenging to direct observation from the ground. As explained below, this has only to do with accidental incompatibilities between technology, the atmospheric windows available for sensitive observations from the ground, and the spectral features that enable redshift measurement, and not with any intrinsic changes in the galaxy populations. The fact that the universe is to a large extent still terra incognita provides exciting opportunities for new observational techniques to make substantial headway.
Spectroscopy of distant galaxies has advanced significantly since the advent of 8-10 m class telescopes located at the best terrestrial sites and equipped with state of the art spectrographs achieving very high efficiency throughout the optical range. Wavelengths between 4000 and 9000 Å in particular benefit from the combination of low night-sky background, high atmospheric transmissivity, and high CCD quantum efficiency which all result in greater sensitivities (in flux density units) than those achievable at any other wavelength observable from the ground. For this reason, galaxy surveys have traditionally targeted strong spectral features that fall in this range of high sensitivity, particularly nebular lines from H II regions (e.g., [O II] ; [O III] ; H and H), and the region near 4000 Å in the spectra of early type galaxies. These features are used both in the measurement of galaxy redshifts and in the determination of basic astrophysical properties, such as star-formation rates, reddening, chemical abundances, velocity dispersions, and age.
As we move from the local universe to higher redshifts, the most straightforward strategy has been to simply follow these same spectral lines to longer wavelengths; for redshift measurements, [O II] is accessible to optical spectrographs up to . Considerable success in charting galaxies up to these redshifts has been achieved recently with red-optimized111Red optimization involves several aspects: high spectral resolution, low detector fringing and/or spectrograph stability, as well as high detector quantum efficiency in the red. spectrographs (e.g., DEEP2, Coil et al. 2003) that have been designed specifically to minimize the effects of OH emission from the night sky at wavelengths longer than Å, or for the detection of [O II] .
The optical domain has also proved ideal for surveying galaxies at redshifts where the rest-frame far-UV spectral region, with its wealth of spectral information, crosses over the ‘horizon’ imposed by the earth’s atmosphere (Steidel et al. 1999, 2003; Shapley et al. 2003). Between and , however, lies an interval of redshift for which no strong spectral lines fall in the Å range where most of the spectrographs on large telescopes are optimized—hence, the ‘redshift desert’. There are two obvious approaches to finding galaxies at these redshifts: one is to extend multi-object spectroscopy into the near-infrared (near-IR) and target the familiar optical emission lines from H II regions; the other is to exploit the rest-frame far-UV spectral features by observing at near-UV and blue wavelengths ( Å).
Both strategies are observationally challenging. In the first case, the sky background—both in the OH emission features and in the continuum—becomes progressively brighter at longer wavelengths, while the falling efficiency of silicon detectors requires the use of a different detector technology—one that lags significantly behind CCDs in terms of performance, multiplexing, and areal coverage. Moreover, the increasing importance of thermal noise in the IR necessitates more complex cryogenic instruments with cooled focal planes and optics. Nevertheless, multi-object cryogenic near-IR spectrographs are now being built, or planned, for several 8-10 m telescope facilities. At the other end of the scale, the ground-based near-UV spectral region has its own difficulties. High near-UV transmission and/or reflectivity requires compromises that can exacerbate broad-band optical performance. Different optical glasses and coatings are required; it is extremely difficult to achieve good optical performance simultaneously at 3300 Å and 7500 Å with refractive optics, for example, and until recently good UV reflectivity has required the use of Al mirror coatings which do not perform well, compared to other readily available materials, at wavelengths longer than 4500 Å. In addition, in selecting CCDs one must generally choose between those that have good UV response and those with good quantum efficiency and low fringing amplitude in the red and near-IR. All these reasons explain why the wavelength region below 4000 Å has so far been largely neglected in the design of optical faint-object spectrographs.
From the point of view of the astrophysical information they convey, both the rest-frame far-UV and optical regions are important and are in fact largely complementary. In the rest-frame optical, nebular emission lines yield information on the chemical abundances and kinematics of the ionized gas (e.g., Teplitz et al. 2000; Pettini et al. 2001; Erb et al. 2003; Lemoine-Busserolle et al. 2003). In the far-UV, on the other hand, large number of stellar and (especially) interstellar absorption lines are accessible. The latter have provided information on the kinematics and chemistry of outflowing gas that may have very significant implications for the galaxy formation process (see, e.g., Pettini et al. 2002a; Shapley et al. 2003, Adelberger et al. 2003). Stellar features, while weaker and therefore more difficult to detect, can be used to place constraints on the initial mass function (IMF) and metallicity of massive stars (e.g., Pettini et al. 2000, 2002b; Leitherer et al. 2001).
When it comes to identifying galaxies at in large numbers, however, there are clear differences between the near-UV and near-IR (in the observed frame) domains. Of course, some types of objects, such as those most heavily reddened by dust or having no current star formation, may be accessible only in the near-IR. However, the fact remains that, with no moonlight, the night sky background in the blue and near-UV is nearly featureless, is (AB) magnitudes fainter (per square arc second in the continuum) than at 9000 Å, and is more than 5 magnitudes fainter than in the H (1.65 m) and K (2.2 m) bands even between the OH sky emission lines. Since the spectral energy distribution of a typical star forming galaxy is relatively flat from the rest-frame UV to the optical, the advantage of near-UV spectroscopy is obvious, provided high spectral throughput can be achieved. This is most effectively accomplished with double-beam spectrographs where the spectral throughput can be optimized over the whole range m.
Since the commissioning of the blue channel of the Low Dispersion Imaging Spectrograph (LRIS-B) on the Keck I telescope, described in an appendix, we have been conducting a survey for star-forming galaxies at redshifts . The development of the photometric criteria used to select candidates is described in detail in Adelberger et al. (2004). In this paper we present the first results of the survey, highlighting the efficiency of UV selection for bridging this important redshift gap in our knowledge of galaxy evolution, and and overview of the science now possible for galaxies in this redshift range. In §2 we briefly describe our photometric selection of candidates. The spectroscopy is described in §3 where we present the first results of the survey, such as the success rate of the photometric selection and the redshift distribution of confirmed candidates. An appendix describes the most important aspects of the LRIS-B instrument, which has been crucial to the success of the survey. §4 illustrates some of the astrophysical information conveyed by the spectra; we consider in particular the IMF and metallicity of the young stellar populations and the kinematics of the interstellar medium in these galaxies. §5 deals with the optical-IR colors of the galaxies. Finally, in §6 we summarize the main findings from this initial stage of our survey. We assume a cosmology with , , and throughout.
2. PHOTOMETRIC AND SPECTROSCOPIC TARGET SELECTION
2.1. Color Selection
Our searches for galaxies at are based on deep images in the , , and passbands of similar quality (in terms of depth and seeing) as those used in our published survey for Lyman Break Galaxies (LBGs) at (Steidel et al. 2003). The fields observed are listed in Table 1; with the exception of GOODS/HDF-N and Westphal, the fields are distinct from those used in the LBG survey and were selected primarily because they include one or more relatively bright background QSOs suitable for studying the cross-correlation of galaxies with H I and metals in the intergalactic medium (IGM). The imaging data were obtained at four telescopes (Palomar 5.1 m, WHT 4.2 m, KPNO 4 m, and Keck I 10 m) mostly between 2000 August and 2003 April. We made use of the deep band image in the GOODS-N field obtained by the GOODS team (Giavalisco & Dickinson 2003), which was calibrated onto our own photometric system using observations through the filter presented in Steidel et al. (2003). The image reductions and photometry were performed following the procedures described in Steidel et al. (2003).
| Field Name | (J2000) | (J2000) | Field Size | Telescope/DateaaTelescope and instrument used to obtain the deep imaging data: KPNO Kitt Peak 4 m Mayall telescope, with PFCCD (1996) and MOSAIC (2002); WHT William Herschel 4.2 m telescope with prime focus imager; P200 Palomar 5.1 m Hale telescope with Large Format Camera; Keck I Keck I 10 m telescope LRIS in imaging mode. |
|---|---|---|---|---|
| GOODS-N | 12:36:51 | 62:13:14 | 106146 | KPNO/Apr 02, Keck I/Apr 03 |
| Q1307 | 13:07:45 | 29:12:51 | 162159 | WHT/May 01 |
| Westphal | 14:17:43 | 52:28:49 | 150150 | KPNO/May 96, P200/May 02 |
| Q1623 | 16:25:45 | 26:47:23 | 125232 | P200/Aug 00 |
| Q1700 | 17:01:01 | 64:11:58 | 153153 | WHT/May 01 |
| Q2343 | 23:46:05 | 12:49:12 | 238119 | P200/Aug 01 |
| Q2346 | 23:48:23 | 00:27:15 | 164170 | WHT/Aug 01 |
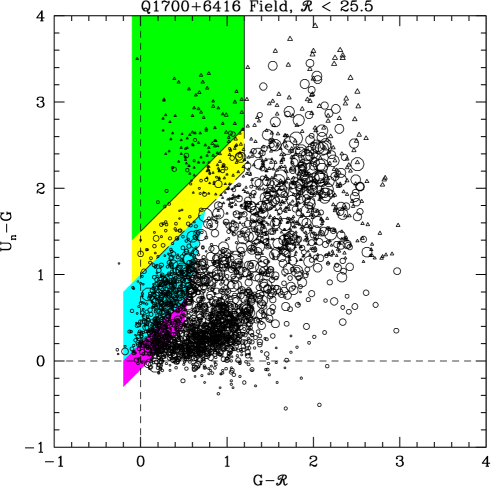
The rationale and method for selecting galaxies using only their optical broad-band colors are described in detail by Adelberger et al. (2004). The selection criteria are aimed at identifying galaxies with approximately the same range of intrinsic properties, particularly UV luminosity and reddening by dust, as the well-studied Lyman break galaxies. After some ‘fine-tuning’ based on the initial results of early spectroscopic follow-ups, we converged on two sets of color selection criteria designed respectively to select galaxies in the redshift ranges —we call these ‘BX’ objects, and —the ‘BM’ objects. The criteria for BX objects (e.g., Q1700-BX691) are 222Note that the BX color cuts given in equation 1 are slightly different from the preliminary values published in Erb et al. (2003).:
| (1) |
and for the BM objects (e.g., Q1307-BM1163),
| (2) |
The methods for establishing these selection criteria, and their estimated level of completeness, are discussed in Adelberger et al. (2004). Figure 1 shows where the two color cuts are located in the vs. plane. The resulting sample of galaxies is very similar to our existing sample of LBGs in terms of star formation rate inferred from their UV luminosities (uncorrected for extinction): the BX+BM spectroscopic sample has SFR yr-1, with a median of yr-1, while the spectroscopic LBGs have SFR yr-1 with a median of yr-1 (estimated from the apparent and magnitudes respectively, using the conversion from 1500Å luminosity advocated by Kennicutt 1998.)
The average surface density of photometric candidates satisfying the BX criteria is 5.2 arcmin-2 to 333Corrected for 9% contamination by interlopers, as discussed in §4.1 below., while the corresponding average surface density of BM objects is 3.8 arcmin-2; together, they comprise % of the band counts to this apparent magnitude limit, and exceed the LBG surface density by a factor of more than five. This is not surprising given the larger redshift interval (), and the lower intrinsic luminosities reached in the BX and BM samples compared to the LBGs.444 corresponds to galaxies that are 0.6 magnitudes less luminous at , and 1.1 mags less luminous at , than LBGs of the same apparent magnitude.
2.2. Spectroscopic Follow-up
At this stage in the survey we have followed-up spectroscopically primarily the BX candidates, for the purpose of extending to lower redshifts our study of the IGM-galaxy connection begun in Adelberger et al. (2003). As discussed in §3.1, the redshift distribution of these galaxies has . Only very recently have we begun observing significant numbers of BM galaxies targeting the range , considered by some to be perhaps the most challenging range of redshifts for confirmation with optical spectroscopy. While the current statistics for such galaxies are not as extensive as those of the BX sub-sample (we have observed only 187 candidates to date), the results obtained so far already show that the color selection criteria work as expected; the redshift distribution of confirmed BM objects is .
What is clear is that the higher surface density of BX/BM photometric candidates, coupled with the high rate of spectroscopic confirmation achieved with the UV-optimized LRIS-B spectrograph, allows a large sample of galaxies in the ‘redshift desert’ to be assembled relatively easily and efficiently. To date our survey includes 692 galaxies with confirmed spectroscopic redshifts between and 2.5 . We defer to a future paper the relatively complex analysis necessary to turn the photometric and spectroscopic results into a far-UV luminosity function of galaxies.
We now turn to the spectroscopic results; relevant information on the performance and specifications of the LRIS-B instrument are summarized in the Appendix.
3. SPECTROSCOPIC OBSERVATIONS AND RESULTS
3.1. Optical Spectroscopy
For the redshift range of interest here, , the rest frame far-UV region between Ly and C IV , with its rich complement of stellar and interstellar lines, is redshifted between the atmospheric cut-off near 3100 Å and 5400 Å. This wavelength interval was therefore the primary target of our spectroscopic survey. The spectra were obtained with slightly different instrumental configurations over the three year period of the survey to date. In the blue channel of LRIS we used the 400 groove mm-1 grism blazed at 3400 Å throughout, since this is the grism which provides the highest throughput between 3100 and 4000 Å (see Appendix and associated figures). Initially we observed with a dichroic that divides the incoming beam at 5600 Å, and with a 600 groove mm-1 grating blazed at 7500 Å on the red side; this set-up generally gives complete wavelength coverage over the entire 3100–8000 Å range for most slits. In 2002, once the blue channel detector was upgraded to the larger Marconi CCD mosaic, we used the blue side only with a mirror in place of the dichroic; this configuration covers from the atmospheric cut-off to about 6500 Å (the exact red limit of the spectra depends on the location of a given slit within the field of view) with a dispersion of 1.07 Å per 15 m pixel. More recently we have reverted to double-channel mode, but with the 6800 Å dichroic and the 400 groove mm-1 grating blazed at 8500 Å which gives additional spectral coverage from 6800 Å to 9500 Å for most slits. This latest setup is particularly useful when observing BM candidates, because the red side allows one to check for the presence of [O II] emission at ; as explained below, galaxies in this redshift range turn out to be the main source of contamination of the BM sample.
The Keck I f/15 Cassegrain focus does not yet have an atmospheric dispersion corrector, so we took special care to avoid significant light losses due to atmospheric dispersion. We designed slit masks to be used at a given time of night, with a position angle that would place the slits within 20 degrees of the parallactic angle at any time during the observations. At the telescope, we performed the final mask alignment in the blue, since this is the region of most interest for our purposes. With the 1.2 ″ slits used in all the masks, and the typical image quality of ″ at the detector, the spectral resolution in the blue was Å FWHM, sampled with pixels. Wavelength calibration was achieved by comparison with the spectra of internal Cd, Zn, Ne, and Hg lamps, as well as by reference to night sky emission lines.
The choice of BX and BM candidates assigned to each mask was based on an algorithm that gives largest weights to objects in the apparent magnitude range and somewhat lower weights to brighter and fainter objects. 555Objects lying within 1–2 ′ of a background QSO were given additional weight depending on the projected distance from the QSO. Such cases are particularly useful for investigating the galaxy-IGM connection (Adelberger et al. 2003). Each slit mask covered an area on the sky of 80 by 45, and contained slits. With few exceptions, each mask was observed for a total of 5400 s split into three 1800 s integrations; the telescope was stepped by ″ in the slit direction between exposures. The data were reduced and the spectra identified with the procedures described by Steidel et al. (2003).
The total exposure times were deliberately kept short in order to maximize the number of galaxies for which redshifts could be measured. Because of this, the quality of the spectra varies considerably (since the objects range from to ), but the best spectra are already suitable for more detailed analyses, as discussed in §4 below. The success rate in spectroscopically identifying candidates varied from mask to mask, depending on the observing conditions. On masks obtained in the best conditions, a redshift could be measured for more than 90% of the objects targeted, whereas the proportion was lower for masks observed in poor seeing (FWHM arcsec) or through thick cirrus. Because of this, we believe that spectroscopic failures are very likely to have the same redshift distribution as the successes, rather than being the result of the true redshifts falling far from expectations. The overall success rate to date in securing a spectroscopic identification is 69% for BX candidates and 65% for BM candidates (see tables 2 and 3).
| Mag | Attempted | Identified | % Identified | InterlopersaaNumber of objects with . | % InterlopersbbFraction of identified objects with . |
|---|---|---|---|---|---|
| cc7 of the 8 objects with and are QSOs. | 52 | 50 | 96.2 | 42 | 84.6 |
| 12 | 12 | 100.0 | 11 | 91.7 | |
| 32 | 30 | 93.8 | 21 | 70.0 | |
| 118 | 106 | 89.8 | 32 | 30.2 | |
| 223 | 177 | 79.3 | 25 | 14.0 | |
| 363 | 248 | 68.3 | 12 | 4.8 | |
| 275 | 175 | 63.6 | 9 | 5.1 | |
| 231 | 105 | 45.7 | 2 | 1.9 | |
| Total | 1309 | 903 | 69.1 | 154 | 17.1 |
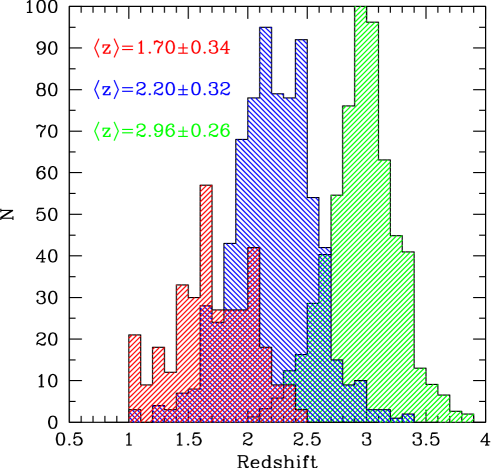
The current redshift histograms for the BX and BM samples are shown in Fig. 2, together with the histogram for the completed LBG survey of Steidel et al. (2003). The total number of new spectroscopic redshifts in the range , including both BX and BM samples, is 692, with 244 of those in the range .
| Mag | Attempted | Identified | % Identified | InterlopersaaNumber of objects with . | % InterlopersbbFraction of identified objects with . |
|---|---|---|---|---|---|
| cc6 of the 7 objects with and are QSOs. | 7 | 7 | 100.0 | 0 | 0.0 |
| 1 | 1 | 100.0 | 0 | 0.0 | |
| 2 | 2 | 100.0 | 0 | 0.0 | |
| 21 | 17 | 81.0 | 1 | 5.8 | |
| 38 | 29 | 76.3 | 3 | 10.3 | |
| 67 | 40 | 59.7 | 3 | 7.5 | |
| 30 | 17 | 56.7 | 0 | 0.0 | |
| 21 | 8 | 38.1 | 0 | 0.0 | |
| Total | 187 | 121 | 64.7 | 7 | 5.8 |
From the results of the survey so far we have established that star forming galaxies at are the main source of contamination in the BX sample (adopting the somewhat arbitrary definition of an interloper as any object at ). These are star forming dwarf galaxies whose Balmer break mimics the Lyman forest decrement of galaxies in the range. As can be seen from Table 2, they are dominant at the bright end of the distribution of apparent magnitudes but become negligible at faint magnitudes. Confining the spectroscopic follow-up to objects with would reduce the contamination to 5%, but at the expense of overlooking the intrinsically brightest galaxies at which are the most suitable for subsequent detailed spectroscopic studies. For this reason we have included many of these bright objects in the masks observed up to now. Based on the spectroscopic results, we estimate that the overall contamination of the BX photometric sample to by low-redshift interlopers is % of which 3% are stars and 6% are low redshift star forming galaxies. However, because we did not sample the photometric candidates evenly, but favored brighter objects, the interloper contamination of the BX spectroscopic sample to date is %. Of the 903 BX objects with measured redshifts, 749 are at with .
Objects satisfying the BM color criteria, on the other hand, do not suffer significant contamination from very low redshift galaxies or stars. While the targeted redshift range was , a significant number of galaxies in the range are included simply because some fraction of such galaxies are found in the same region of the color space as the targeted objects (see Table 3); their proportion can be reduced if additional color criteria are imposed (see Adelberger et al. 2004). Of the 114 BM objects with secure redshifts, 107 have , with an overall redshift distribution of ; 20 objects have .
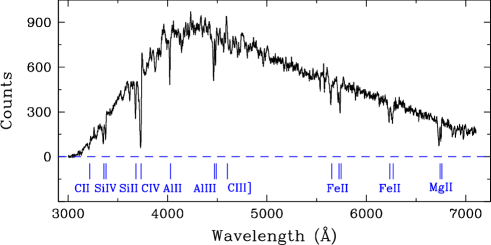
Example spectra of galaxies in the ‘redshift desert’ are shown in Figs. 3 and 4; the properties of these example objects, including their positions, magnitudes, and colors, are summarized in Table 4. In Fig. 3 we have reproduced the LRIS-B spectrum of Q1307-BM1163, a bright (, , ) galaxy at . We have plotted raw counts vs. observed wavelength specifically to show the relative count rate as a function of wavelength from 3000 to 7100 Å, the range encompassed by the blue channel of LRIS for this object. Useful signal is obtained all the way down to 3100 Å; some of the most prominent interstellar absorption and emission lines covered in our spectra of BM and BX galaxies, from C II to Mg II , are indicated in the figure. In §4 we use this example to illustrate the information which can be deduced on the stellar populations and the interstellar medium of galaxies at from the study of their rest-frame UV spectra.
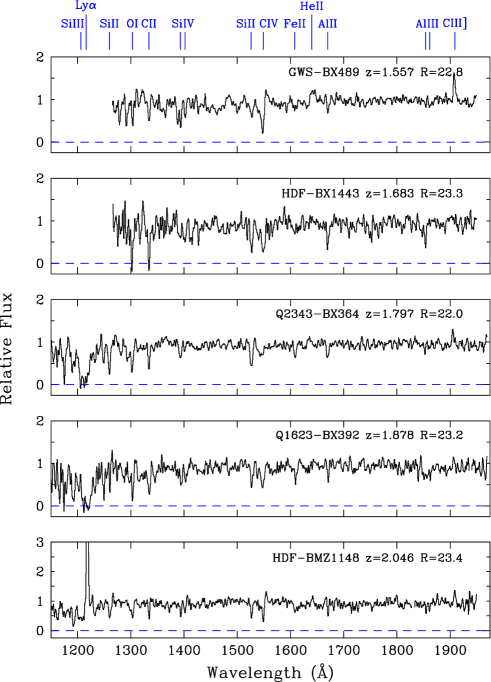
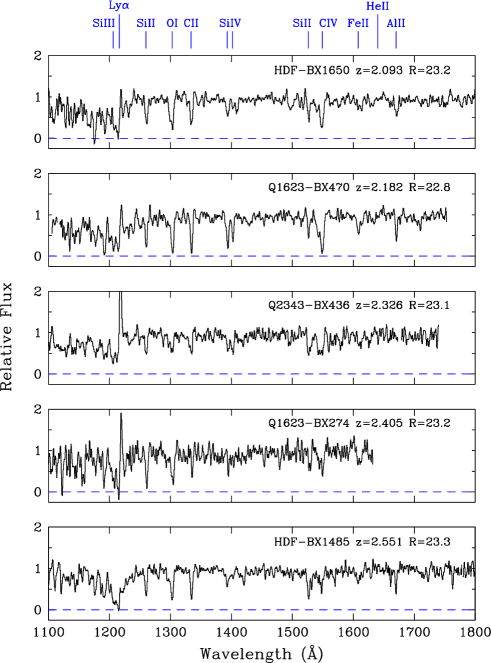
Figure 4 is a montage of ten spectra of some of the brighter BM and BX galaxies chosen to span the range of redshifts and spectral properties seen among our sample. Broadly speaking, the far-UV spectra of color-selected galaxies resemble those of Lyman break galaxies at in terms of continuum slope and spectral lines seen in emission and absorption. There is some evidence to suggest that the Lyman line appears less frequently in emission at these redshifts than at : while 33% of the LBGs in the survey by Steidel et al. (2003) have no measurable Lyman emission, the corresponding fraction in the current sample of BM and BX galaxies at (such that Lyman falls longward of Å) is 57%. It remains to be established whether this is due to a subtle selection effect or to real redshift evolution in the escape fraction of Lyman photons. We intend to address this issue in the future with simulations which are beyond the scope of this paper.
| Name | (J2000) | (J2000) | aaRedshift of the Lyman emission line, when observed. | bbAverage redshift defined by the interstellar absorption lines. | |||
|---|---|---|---|---|---|---|---|
| Q1307-BM1163 | 13:08:18.06 | 29:23:19.2 | 21.66 | 0.20 | 0.35 | 1.409 | |
| GWS-BX489 | 14:17:20.41 | 52:33:18.3 | 22.83 | 0.01 | 0.26 | 1.557 | 1.557 |
| HDF-BX1443 | 12:36:44.87 | 62:18:37.9 | 23.33 | 0.31 | 0.57 | 1.683 | |
| Q2343-BX364 | 23:46:14.97 | 12:46:53.9 | 21.96 | 0.31 | 0.71 | 1.797 | |
| Q1623-BX392 | 16:25:46.56 | 26:45:52.3 | 23.23 | 0.11 | 0.54 | 1.878 | |
| HDF-BMZ1148 | 12:36:46.15 | 62:15:51.1 | 23.38 | 0.20 | 0.29 | 2.053 | 2.046 |
| HDF-BX1650 | 12:37:24.11 | 62:19:04.7 | 23.24 | 0.18 | 0.74 | 2.100 | 2.093 |
| Q1623-BX470 | 16:25:52.80 | 26:43:17.5 | 22.80 | 0.20 | 0.93 | 2.193 | 2.182 |
| Q2343-BX436 | 23:46:09.07 | 12:47:56.0 | 23.07 | 0.12 | 0.47 | 2.332 | 2.326 |
| Q1623-BX274 | 16:25:38.20 | 26:45:57.1 | 23.23 | 0.25 | 0.89 | 2.415 | 2.405 |
| HDF-BX1485 | 12:37:28.12 | 62:14:39.9 | 23.29 | 0.35 | 0.96 | 2.551 |
Excluding QSOs which were already known in our survey fields (these QSOs are all brighter than ), we have identified 21 QSOs and seven narrow-lined AGN among the sample of 863 objects with . This AGN fraction of 3.2% is essentially the same as that deduced by Steidel et al. (2002) for LBGs at . However, we caution that we have not yet quantified the AGN selection function imposed by our color criteria and spectroscopic follow-up, so that the above estimate is only indicative at this stage. On the other hand, it is encouraging that the redshift distribution of the AGN (both BX and BM) is similar to that of the galaxies: and ), perhaps suggesting that differential selection effects may not be too severe.
3.2. Near-Infrared Spectroscopy
In parallel with the LRIS-B optical spectroscopy, we have been observing a subset of the BX and BM galaxies in the near-IR, targeting in particular the H and [N II] emission lines in the and -band. Initial results from this aspect of the survey were reported by Erb et al. (2003).
Briefly, we use the near-infrared echelle spectrograph (NIRSPEC) on the Keck II telescope (McLean et al. 1998) with a 0.76″42″ entrance slit and medium-resolution mode. In the -band, this set-up records a m wide portion of the near-IR spectrum at a dispersion of 4.2 Å per m pixel; the spectral resolution is Å FWHM (measured from the widths of emission lines from the night sky). In the -band, m are recorded at a dispersion of 2.8 Å per pixel and Å resolution. The 42″ length of the rotatable slit is normally sufficient to include two galaxies by choosing the appropriate position angle on the sky. Individual exposures are 900 s and we typically take between two and four exposures per galaxy (or pair of galaxies), offsetting the targets along the slit by a few arcseconds between exposures. The data are reduced and calibrated with the procedures described by Erb et al. (2003).
This near-IR spectroscopy has several goals, most of which are complementary to those achievable with the optical spectra described above: (1) Determine the redshifts of the nebular emission lines which, to our knowledge, give the closest approximation to the systemic redshifts of the galaxies. This is particularly important for examining the connection between the galaxies and the absorption lines seen along nearby QSO sight-lines, since uncertainties in the systemic galaxy redshifts are reduced from km s-1(see Adelberger et al. 2003) to km s-1; (2) Measure the velocity dispersion of the ionized gas and look for evidence of ordered motions, such as rotation, in order to estimate the galaxies’ dynamical masses (see Erb et al. 2003); (3) Determine the metallicity of the H II regions from consideration of the [N II]/H ratio; (4) Compare the star formation rate deduced from the H luminosity with that from the far-UV continuum. Initial results relevant to these topics were presented by Erb et al. (2003); in §4 we briefly touch on some of them again. More extensive results from the near-IR spectroscopic follow-up will be presented elsewhere.
4. THE SPECTRAL PROPERTIES OF UV-SELECTED GALAXIES AT
In this section we illustrate the astrophysical information that can be deduced from the analysis of the rest-frame far-UV spectra of galaxies in the ‘redshift desert’, using Q1307-BM1163 (Fig. 3) as an example. This is admittedly one of the brightest galaxies discovered in the survey to date (), and the spectrum reproduced in Fig. 3 is of higher signal-to-noise ratio than most. However, it must be borne in mind that this spectrum was recorded with only three 1800 s exposures. Data of similar quality can be secured for large numbers of galaxies in the sample with integrations of hours, and such observations are well underway. The character of the spectrum of Q1307-BM1163 is similar to those of many other BX and BM objects; thus we expect that our conclusions from its analysis should be applicable to at least a subset of the galaxies at , particularly those at the bright end of the luminosity function.
4.1. Integrated Stellar Spectra
In the far-UV spectra of star forming galaxies we see the integrated light of young stars of spectral types O and B; such spectra are most effectively analyzed with population synthesis models such as Starburst99666Available from http://www.stsci.edu/science/starburst99/ (Leitherer et al. 1999) which generally provide a good match to the observed spectral characteristics at high (e.g. Pettini et al. 2000; de Mello, Leitherer, & Heckman 2000), as well as low (Leitherer 2002), redshifts. This is also the case for Q1307-BM1163. In Fig. 5 we compare our LRIS-B spectrum of this galaxy with that calculated by Starburst99 for a continuous star formation episode which has been on-going for 100 million years, with solar metallicity and a power law IMF with Salpeter (1955) slope . The spectrum of Q1307-BM1163 has been reduced to the rest frame at redshift (see §4.4) and normalized to the continuum; continuum windows were selected with reference to the Starburst99 model spectrum.
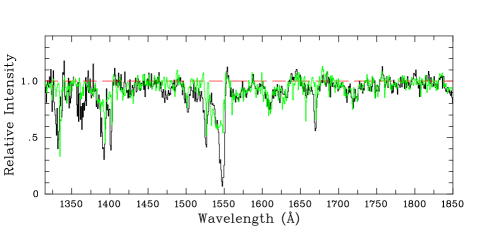
This simplest of models—100 million years is the age beyond which the far-UV model spectrum no longer changes with time—is an excellent match to the integrated stellar spectrum of Q1307-BM1163. The low-contrast blends of photospheric lines are reproduced very well, and most of the features which differ between the two spectra in Fig. 5 are interstellar absorption lines. Starburst99 makes no attempt to reproduce interstellar features; it is often the case that these lines are stronger in the observed spectra of star forming galaxies than in the models because the latter use empirical libraries of stellar spectra of relatively nearby OB stars, whereas the observations sample much longer pathlengths through a whole galaxy.

Figure 6 shows the comparison on an expanded scale, centered on the C IV doublet which is a blend of P-Cygni emission/absorption from the expanding atmospheres of massive stars, and narrower interstellar absorption. The dependence of mass-loss rate on both stellar luminosity and the ionization parameter that is modulated by stellar temperature makes the C IV P-Cygni profile most pronounced in the most massive stars (e.g. Walborn, Nichols-Bohlin, & Panek 1985). Thus, its strength relative to the underlying continuum light, produced collectively by all of the O and early B type stars, is very sensitive to the slope and upper end cut-off of the IMF, as illustrated in Fig. 6. Even relatively minor changes in and alter the appearance of the P-Cygni profile: excluding stars with masses reduces both emission and absorption components (middle panel of Fig. 6), while increasing the proportion of stars at the upper end of the IMF, by changing from 2.35 to 1.85, over-produces the P-Cygni feature (bottom panel of Fig. 6). The best overall agreement (from among these three models) is obtained with a standard Salpeter IMF (top panel).
To a lesser degree, the relative strength of the C IV P-Cygni profile is also sensitive to other parameters, in particular to the metallicity (Leitherer et al. 2001), since metal-poor stars experience lower mass-loss rates, and to age-dependent dust extinction (Leitherer, Calzetti, & Martins 2002). While one could imagine contrived scenarios in which all of these effects (IMF, metallicity, and dust obscuration) somehow balance each other, the most straightforward conclusion from the comparisons in Fig. 6 is that the metallicity of the early-type stars in Q1307-BM1163 is close to solar, and that the youngest stars do not suffer, overall, significantly higher extinction than the whole OB population. Evidently, at a redshift , which corresponds to a look-back time of Gyr, Q1307-BM1163 had already evolved to a stage where its young stellar population closely resembled the Population I stars of the Milky Way, at least in their spectral characteristics.
4.2. Metallicity
4.2.1 Stellar Abundances
While we have concluded that the metallicity of Q1307-BM1163 is likely to be close to solar, the wind lines are not ideal for abundance measurements because they respond to several other parameters, as explained above. On the other hand, the far-UV spectrum of star forming galaxies is so rich in stellar photospheric lines, as can be readily appreciated from Fig. 5, that it is worthwhile considering whether any of these can be used as abundance indicators. Since all of these features are blends of different lines, this question is best addressed with spectral synthesis techniques. For example, Leitherer et al. (2001) have used Starburst99 to show that the blend of Si III , C III , and Fe V , which they define as the ‘1425’ index, becomes stable after Myr (that is, its strength no longer depends on age in a continuous star formation episode) and its equivalent width decreases by a factor of , from Å to Å, as the metallicity of the stars drops from Milky Way to Magellanic Cloud values, that is from solar to solar. In Q1307-BM1163 we measure Å [adopting the same continuum normalization as Leitherer et al. (2001)], which suggests a near-solar metallicity.
Very recently, Rix et al. (in preparation) have explored the possibility of extending this type of approach to other photospheric blends and to a wider range of metallicities. These authors have identified a blend of Fe III lines between 1935 Å and 2020 Å, and defined a corresponding ‘1978’ index which is potentially very useful for two reasons. First, it is considerably stronger than ‘1425’ index of Leitherer et al. (2001) and can thus be followed to lower metallicities. Specifically, at metallicity , Å, or , and even at the lowest metallicity considered by Rix et al., , Å, which is greater than at . Second, this index is in a ‘clean’ region of the spectrum, where there are no strong interstellar, nor stellar wind, lines to complicate its measurement. In Q1307-BM1163 we measure Å which again implies that the metallicity of the young stars is close to solar.
The measurement of stellar abundances from UV spectral indexes is a technique which is still very much under development. It would be premature, for example, to use the above values of and to draw conclusions concerning the relative abundances of different elements. Nevertheless, these initial indications are certainly promising and raise the possibility that, once the indices are calibrated with independent abundance measures, it may be possible to determine stellar abundances to within a factor of for large numbers of high redshift galaxies from their rest-frame UV spectra, even if of only moderate signal-to-noise ratios.
4.2.2 Interstellar Gas Abundances
The most obvious way to calibrate the UV spectral indices is with reference to nebular abundances determined from the familiar rest-frame optical emission lines from H II regions. While nebular diagnostics generally apply to different elements (mostly oxygen), to a first approximation they should give the same ‘metallicity’ as the young stars which have recently formed out of the interstellar gas seen in emission. This is one of the scientific motivations to obtain near-IR spectra of a subsample of BX and BM galaxies (§4.3).
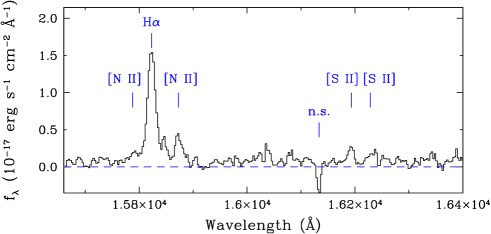
Figure 7 shows a portion of the -band spectrum of Q1307-BM1163 encompassing the H, [N II] , and [S II] emission lines. After subtracting the faint continuum, and fitting H and [N II] with Gaussian profiles, we measure a flux ratio [N II]/H ( random error). Denicoló, Terlevich & Terlevich (2002) have shown that, in a statistical sense, this ratio scales with the oxygen abundance. Adopting the recent calibration by Pettini & Pagel (2004):
| (3) |
where H), we deduce [the error includes both the random error in our measurement of the index and the dex accuracy of the calibrator (at the 68% confidence level)]. This value of (O/H) is consistent, within the errors, with the the most recent estimates of the abundance of oxygen in the Sun, (Allende-Prieto, Lambert, & Asplund 2001; Asplund et al. 2003), and in the Orion nebula, (Esteban et al. 1998; 2002). It would also be of interest to measure element abundances in the cool interstellar medium which produces the numerous absorption lines indicated in Fig. 3. This, however, will require data of higher spectral resolution, giving access to weaker absorption lines which are not saturated. In any case, such an analysis would only yield relative, rather than absolute, abundances because the Ly absorption line falls at 2931 Å, below the atmospheric cut-off.
Summarizing the results of §5.2, we have estimated the metallicity of Q1307-BM1163 from stellar wind lines, stellar photospheric absorption lines, and emission lines from ionized gas, and all these different indicators concur in pointing to an approximately solar abundance. Preliminary results from our on-going near-IR spectroscopic survey indicate that galaxies with are not unusual at redshifts , at least among the brighter BX and BM objects. In Q1307-BM1163 we seem to have an example of a galaxy which had already reached solar metallicity Gyr ago while continuing to support an extremely vigorous star formation, at a rate of more than yr-1 (see §5.3). This mode of star formation is very different from that undergone by the Milky Way disk at any time in its past (Freeman & Bland-Hawthorn 2002) and it is likely that the descendents of objects like Q1307-BM1163 are to be found among today’s elliptical galaxies and bulges of massive spirals.
4.3. Star Formation Rate
From the spectrum reproduced in Fig. 7, we measure an H flux erg s-1 cm-2. In the adopted cosmology, this implies an H luminosity erg s-1. With Kennicutt’s (1998) calibration
| (4) |
we then deduce a star formation rate SFR yr-1.
An independent estimate of the star formation rate is provided by the UV continuum at 1500 Å
| (5) |
(Kennicutt 1998); both eq. (4) and (5) assume continuous star formation with a Salpeter slope for the IMF from 0.1 to 100 . At , 1500 Å corresponds to an observed wavelength of 3617 Å, close to the center of the bandpass of our filter (Steidel et al. 2003). Then, the measured (AB) of Q1397-BM1163 corresponds to SFR yr-1. The good agreement between the values of SFR deduced from the H and the far-UV continuum luminosities is not unusual for bright UV-selected galaxies (Erb et al. 2003). To a first approximation, it presumably indicates that the UV continuum does not suffer a large amount of extinction by dust (see the discussion of this point by Erb et al. 2003).
4.4. Kinematics of the Interstellar Medium
From the Gaussian fit of the H line in Q1307-BM1163 we deduce a one-dimensional velocity dispersion of the ionized gas km s-1 and a redshift . The former is close to the mean km s-1 of the sample of 16 (mostly BX) galaxies at analyzed by Erb et al. (2003). It is however significantly higher than the mean km s-1 of the 16 Lyman break galaxies at studied by Pettini et al. (2001), and in fact exceeds the highest value found in that sample, km s-1. Erb et al. (2003) commented on the apparent increase in velocity dispersion of star forming galaxies between and ; it will be interesting to explore such kinematic evolution in more detail and to lower redshifts once our near-IR survey of BX and BM galaxies is more advanced.
Another important aspect of the internal kinematics of LBGs are the large velocity differences which are nearly always measured between interstellar absorption lines, nebular emission lines, and Ly emission. If we take the nebular lines to be at the systemic redshifts of the galaxies, the interstellar absorption lines and Ly are respectively blue- and red-shifted by several hundred km s-1 (Pettini et al. 2001; Shapley et al 2003). In this respect also Q1307-BM1163 is no exception– the numerous interstellar lines in the spectrum have centroids that are blue-shifted by 300 km s-1with respect to the redshift defined by the H emission line, and have velocity widths of km s-1; both of these values are quite typical [cf. Pettini et al. 2001, 2002, Shapley et al. 2003].) This kinematic pattern is most simply explained as being due to large-scale outflows from the galaxies, presumably powered by the energy deposited into the ISM by the star formation activity. The resulting ‘superwinds’ are likely to have a far-reaching impact on the surrounding intergalactic medium and are probably at the root of the strong correlation between LBGs and IGM metals found by Adelberger et al. (2003).
Indeed, a major motivation for pursuing galaxies in the ‘redshift desert’ is to investigate how the galaxy-IGM connection evolves from to lower redshifts. We can already address one aspect of this question by examining the velocity differences between interstellar absorption, nebular emission, and Ly in 27 BX and BM galaxies which we have observed at H with NIRSPEC and which also have LRIS-B spectra of sufficiently high quality to measure absorption and (when present) Ly redshifts with confidence.
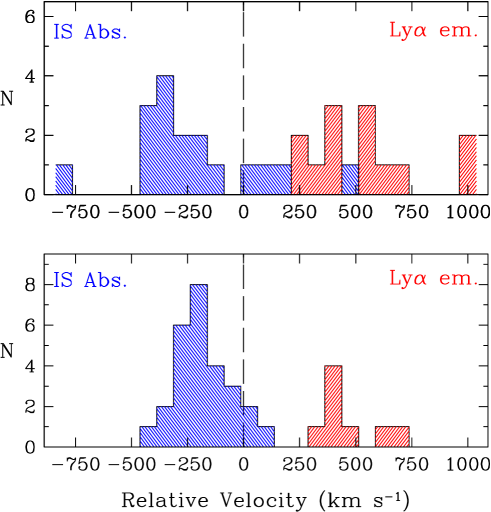
The results of this exercise are shown in Fig. 8. For these 27 galaxies, the mean velocity offset of the interstellar lines is km s-1. For the ten galaxies among them which exhibit detectable Ly emission, km s-1. These values, and their observed distributions, are very similar to those found at by Pettini et al. (2001) and Shapley et al. (2003)—a comparison with the data presented in Pettini et al. (2001) is included in Fig. 8. Thus, the superwinds generated in active sites of star formation appear to have similar kinematic characteristics from down to at least , even though their parent galaxies may become more massive over this redshift interval, if the hints provided by the nebular line widths have been correctly interpreted (Erb et al. 2003). These tentative conclusions make it all the more interesting to investigate how the galaxy-IGM connection may evolve to lower redshifts.
5. NEAR-IR PHOTOMETRIC PROPERTIES
We end with a brief comment on the -band magnitudes and colors of UV-selected star-forming galaxies in the ‘redshift desert’. In 2003 June we initiated a program of deep -band photometry of these galaxies using the Wide Field Infrared Camera (WIRC) on the Palomar 5.1 m Hale telescope. The camera employs a Rockwell HgCdTe array, and has a field of view of 87 87 with a spatial sampling of 025 per pixel. With hour integrations, the images reach 5 photometric limits (in 2 arcsec diameter apertures) of , sufficiently deep to detect % of the galaxies with spectroscopic redshifts. In Fig. 9 we show initial results from the first three WIRC pointings (in the Q1623+27, Q1700+64, and Q2343+12 fields, where only BX candidates have so far been observed spectroscopically); while preliminary, these data already allow a coarse comparison with other faint galaxy samples.
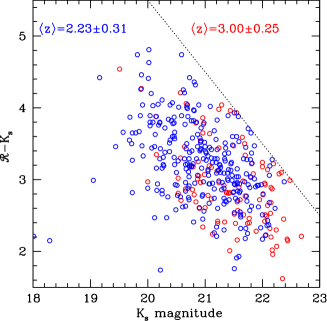
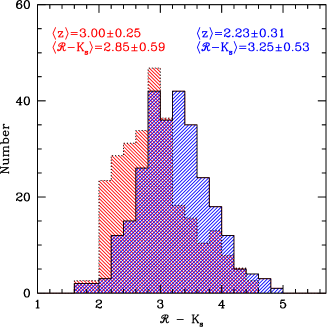
As can be seen from the left-hand panel of Fig. 9, % of UV-selected galaxies at are brighter than ; thus we expect a relatively small overlap between the BX population and the high redshift tail of published -selected samples (Cohen et al. 1999ab; Cimatti et al. 2002; Daddi et al. 2003). However, going only one magnitude deeper to should pick up an appreciable fraction of the spectroscopic BX sample.
It is intriguing to find a clear difference in the colors of BX galaxies at and LBGs at (Shapley et al. 2001), in the sense that the former are significantly redder than the latter, on average (see right-hand panel of Fig. 9). For a given star formation history and extinction, galaxies at and would have identical color (the k-corrections are identical in the two bands for model SEDs that fit the observed colors), meaning that whatever the cause, there is a significant intrinsic color difference in the UV-selected galaxies in the two redshift intervals. Since the and filters straddle the age sensitive Balmer break at these redshifts, one interpretation of the redder colors would be that, on average, star formation has been proceeding for longer periods of time in the galaxies as compared to similarly-selected galaxies at . If the LBGs continued to form stars during the Myr interval between the two epochs, such reddening of the color would be expected. However, we caution that there may be other reasons for the offset evident in Fig. 9, possibly related to higher dust extinction and/or larger contamination of the broad-band colors with line emission (most of the galaxies would have H in the K band, whereas most of the galaxies had [OIII] and H in the K band–although these tend to have roughly the same equivalent widths for the sub-samples that have been spectroscopically observed in the near-IR), as well as to the way the different samples were selected777The sample of Shapley et al. 2001 over-sampled the optically brightest galaxies and galaxies having the reddest UV colors relative to a random -selected spectroscopic sample, so that the two samples may not be exactly analogous. Possible differential selection effects will be better quantified in future work. At present, both the observed increase in one-dimensional line widths and the reddening of the optical/IR colors are qualitatively consistent with a significant overall increase in stellar mass among at least a substantial fraction of the UV-selected populations between and 888Very recently, an increase in the stellar mass of UV-selected galaxies has been inferred between and in the GOODS-S field, using similar arguments; Papovich et al. 2003. Ongoing near-IR spectroscopy targeting BX (and eventually BM) galaxies with red colors, and full modeling of the observed optical/IR SEDs using population synthesis, will allow us to reach firmer conclusions on the cause of the observed evolution.
6. SUMMARY
The main thrust of this paper has been to show that the redshift interval , which has so far been considered hostile to observations, is in fact ripe for scientific exploration. Galaxies in what used to be called the ‘redshift desert’ can in reality be easily identified from their broad-band colors and can be studied very effectively with a combination of ground-based optical and near-IR spectroscopy, provided the optical instrumentation has high efficiency in the near-UV. It is then possible to cover most of the rest-frame UV and optical spectra of these galaxies, from Ly to H, and gain access to a wider range of important spectral diagnostics than is usually available for the so-far better studied Lyman break galaxies at (or even galaxies at ). In addition, because the luminosity distances are lower, the galaxy luminosity function can be probed magnitudes deeper than is the case at , and there are more galaxies brighter than whose spectra can be recorded at high spectral resolution and S/N for further, detailed, investigation.
We have presented the first results from our survey for galaxies at , in seven fields totaling square degrees; five of the fields were chosen because they include one or more bright background QSOs. Over this area, we have identified thousands of candidates which satisfy newly defined BX and BM color selection criteria and have spectroscopically confirmed 863 of them to be at ; 692 are in the targeted range. The rest-frame UV spectra of BX and BM galaxies are very similar to those of LBGs, with a rich complement of stellar and interstellar lines. There seem to be proportionally fewer galaxies with detectable Ly emission, but we have not established yet whether this is related to the color selection cuts we have adopted or is a real effect. The fraction of faint AGN within this sample is 3.2%, essentially the same as in the LBG sample at .
We have illustrated the range of physical properties which can be investigated with the combination of rest-frame UV and optical spectroscopy using, as an example, one of the brightest objects in the sample, Q1307-BM1163. This galaxy is forming stars at a rate yr-1 and with a Salpeter slope at the upper end of the IMF. Various abundance indicators, based on stellar wind and photospheric lines, show that the metallicity of the youngest stars is close to solar; this is in good agreement, as expected, with the solar abundance of oxygen in its H II regions implied by the high [N II]/H ratio. We draw attention to the potential for abundance determinations of newly developed UV spectral indices which measure the strengths of blends of photospheric lines; once properly calibrated, these indices may allow the metallicities of large numbers of galaxies to be approximately assessed from spectra of only moderate signal-to-noise ratios. Viewed at a look-back time of Gyr, Q1307-BM1163 is clearly turning gas into stars, and enriching its ISM with their products, at a much faster rate than that experienced by the Milky Way disk at any time in its past. We speculate that by it will have become an elliptical galaxy or perhaps the bulge of a massive spiral.
The galactic-scale winds which are commonly seen in LBGs at are still present in star-forming galaxies at later epochs, generating velocity differences of several hundred km s-1 between absorption lines produced by the outflowing ISM and the emission lines from the star-forming regions. The typical velocity difference of km s-1 between emission and absorption does not seem to change between and , even though there is evidence that the velocity dispersion of the ionized gas increases by % between these two epochs, possibly reflecting a growth in the typical galaxy mass.
Initial results from deep -band imaging of spectroscopically confirmed BX galaxies show that a larger proportion of the galaxies have relatively red colors as would be expected if the galaxies have been forming stars at close to their observed rate for a longer period of time than their counterparts (and hence would have correspondingly larger stellar masses). Approximately 10% of the BX spectroscopic sample are very bright in the near-IR () and thus would be expected to comprise part of the high-redshift tail of current -selected spectroscopic surveys.
There are several other issues of interest
which can be addressed with a large sample
of galaxies at these intermediate redshifts,
such as their luminosity function and integrated
star formation rate density, the impact of the
‘superwinds’ on the galaxies’ environment and
the intergalactic medium at large, and the relationship
between galaxy morphology and kinematics.
We intend to consider these topics in the future, as our
survey progresses beyond the initial stages
which have been the subject of this paper.
We would like to thank the rest of the team responsible for the design, construction, and commissioning of the LRIS-B instrument and the upgraded CCD camera, particularly Jim McCarthy, John Cromer, Ernest Croner, Bill Douglas, Rich Goeden, Hal Petrie, Bob Weber, John White, Greg Wirth, Roger Smith, Keith Taylor, and Paola Amico. We have benefited significantly from software written by Drew Phillips, Judy Cohen, Patrick Shopbell, and Todd Small. CCS, AES, MPH, and DKE have been supported by grants AST00-70773 and AST03-07263 from the US National Science Foundation and by the David and Lucile Packard Foundation. NAR has been supported by an NSF Graduate Fellowship. KLA acknowledges support from the Harvard Society of Fellows.
Appendix A THE LRIS-B SPECTROGRAPH
The blue channel of the LRIS spectrograph (LRIS-B) was anticipated as an upgrade to the LRIS instrument (Oke et al. 1995) from the initial planning stages of the first-light Keck Observatory instrumentation suite, and was begun as a project in 1995. LRIS-B was installed on the LRIS instrument during the summer of 2000, and saw first-light in 2000 September. After the installation of LRIS-B, the spectrograph now provides two independent, optimized imaging spectrograph channels which simultaneously observe the same 55 by 80 field of view in two different wavelength ranges through the use of a dichroic beamsplitter. Figure 10 illustrates a section view of the LRIS instrument that is color-coded to indicate the light paths through the red and blue channels. The red side of the instrument maintains identical performance to the original LRIS spectrograph, and (as always) employs reflection gratings to disperse red light that is passed by the beamsplitter. The blue channel uses UV/blue optimized grisms as dispersers. An early technical description of LRIS-B is given by McCarthy et al. (1998); more recent information is available at http://www.keck.hawaii.edu/realpublic/inst/lris/lrisb.html .
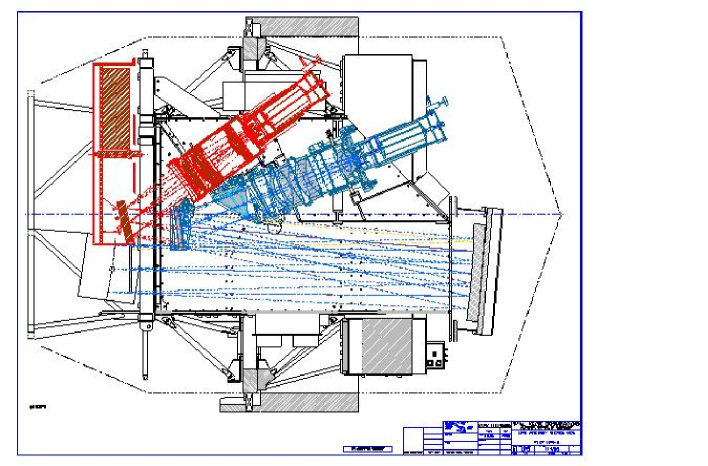
In brief, the LRIS-B upgrade involved the installation of a UV/blue-optimized spectrograph camera, replacement of the camera bulkheads for both the existing spectrograph (LRIS-R) and LRIS-B, and installation of independent carousels and transport mechanisms to store and deploy blue-side dichroics, grisms, and filters into the beam. In addition, all of the LRIS electronics were enclosed inside a glycol-cooled compartment for better control of the thermal environment at the Cassegrain focus of Keck I, and the overall instrument software was re-configured to accomodate the operations of both blue and red side mechanisms and the simultaneous operation of two independent detector trains. Each of the optical elements (moving from left to right on figure 10, the dichroic, grism, and filter) can be changed in less than 60 seconds, and in particular a grism or filter can be deployed or retracted from the beam in seconds, enabling rapid switching from imaging to spectroscopic mode which greatly improved the efficiency of slitmask alignment with LRIS.
The instrument currently allows the user to select one of 5 possible dichroic beam-splitting optics: a flat aluminized mirror, which sends all of the light into the blue camera, and dichroics that divide the beam at 4600 Å(d460), 5000 Å(d500), 5600 Å(d560), or 6800 Å(d680). The reflectivity of the dichroics for wavelengths shortward of the design cutoff are generally better than 96% (i.e., superior to the reflectivity of aluminum), with transmittance better than 90% longward of the cutoff.
The LRIS-B filters, which include publicly available u’, B, G, and V, are generally only used for imaging programs or for slitmask alignment images. User-supplied filters (which must be larger than by 8 inches in order not to vignette the parallel beam) may be installed in the filter carousel. With suitable choice of dichroic and red-side filter, it is possible to image in two passbands simultaneously.
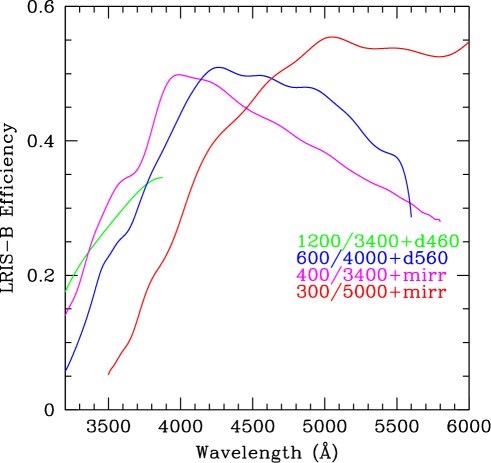
There are currently 4 grisms available with LRIS-B: a 1200 line/mm grism blazed at 3400 Å which can cover the wavelength range 3000-4300 Åwith a resolution of (with a 0.7 slit), a 600 line/mm grism blazed at 4000Å (), a 400 line/mm grism blazed at 3400 Å optimized for the highest throughput at wavlengths Å (), and a 300 line/mm grism blazed at 5000Å () . With suitable choice of dichroic beamsplitter and LRIS-red side grating, it is possible to cover all wavelengths from the atmospheric cutoff near 3000Å to 1 m with high efficiency.
Because both the red and blue channels of the spectrograph share the same paraboloidal reflecting collimator (see figure 10), the original protected silver coating on the 0.53m diameter collimator mirror was replaced by the hybrid coatings developed by the group at Lawrence Livermore National Laboratory (Thomas & Wolfe 2000) which provide reflectivity of at all wavelengths from 3100 Å to m.
The light path for LRIS-B goes as follows: a slitmask (or long slit) is deployed in the telescope focal plane, at a position centered 6 off axis. After passing into the intrument and through a field lens, all light is collimated by the reflecting collimator. The dichroic beam splitter (placed just in front of the red channel reflection grating) receives the collimated beam and reflects wavelengths shortward of the dichroic cutoff into the blue channel, passing light longward of the cutoff directly onto the red side grating (or flat mirror in the case of imaging). The blue light is then dispersed by a selectable grism, after which it passes through a selectable filter (tilted by about 6 degrees with respect to the collimated beam to avoid internal reflections) and into the LRIS-B camera. The camera is all refractive, constructed from 12 CaFl and fused silica elements with optimized coatings that achieve 0.5% reflection losses at each of the 8 air/glass surfaces. The LRIS-B camera has an aspheric first element that is placed slightly off-axis to correct much of the coma introduced by the parabolic collimator. Tests carried out during the commissioning period confirmed that the camera achieves images with RMS image diameters better than 22m (0.20″) over the full 8.0′ by 5.5′ field of view and from 3100 to 6000 Å without the need to re-focus. The camera performs well to Å, beyond which the image quality and throughput of the system deteriorate somewhat; in general, this is not a problem since red light is directed into the red channel of the spectrograph.
Initially, the LRIS-B detector was an engineering-grade SITe pixel CCD. This was replaced in 2002 June by a science grade mosaic of two EEV (Marconi) devices selected to have particularly high near-UV and blue quantum efficiency. With the new detector, LRIS-B records images and spectra over the full field of view of the instrument with the exception of a 13″ inter-chip gap that runs parallel to the dispersion direction, and which coincides with the bar that is used to support the slit masks in the slit mask frames. The plate scale at the detector is 0.135″ per 15m pixel.
To our knowledge LRIS-B is the only UV/blue optimized faint object spectrograph on an 8-10 m class telescope. It is particularly worthwhile implementing this type of instrument at a site such as Mauna Kea which, because of its high altitude, has atmospheric opacity in the Å range that is 20–30% lower at zenith than that at many other observatory sites. Because every optical element has been optimized for the blue and UV, the instrument achieves remarkably high efficiency. The total spectroscopic system throughput of Keck I+LRIS-B measured during the commissioning run with the science-grade CCD mosaic averages % in the Å range and 25% at 3500 Å; the corresponding values for the instrument alone (that is, neglecting telescope losses) are higher by about 30%. The measured instrumental throughput for a number of grism and dichroic combinations is shown in fig 11. LRIS-B represents an increase in spectroscopic efficiency over the original LRIS instrument (now LRIS-R) of a factor of at 4000Å and even at Å the throughput gain is relative to LRIS-R; the gain at wavelengths Å is more than a factor of 10 . Coupled with the very dark night sky background in the UV-visual range, LRIS-B allows for unprecedented spectral throughput and is optimized for very faint objects at intermediate to low spectral resolution.
At present, there is no atmospheric dispersion corrector (ADC) for the Keck I Cassegrain, so that the full broad-band capabilities of the instrument using multislit masks are not yet realized. However, at the time of this writing an ADC is being designed and contructed at the University of California Observatories, for deployment in late 2004.
References
- (1)
- (2) Adelberger, K. L., Steidel, C. C., Shapley, A. E., Hunt, M. P., Erb, D. K., Reddy, N. A., & Pettini, M. 2004, ApJ, submitted
- (3)
- (4) Adelberger, K. L., Steidel, C. C., Shapley, A. E., & Pettini, M. 2003, ApJ, 584, 45
- (5)
- (6) Allende Prieto C., Lambert D. L., & Asplund M. 2001, ApJ, 556, L36
- (7)
- (8) Asplund, M., Grevesse, N., Sauval, A. J., Allende Prieto, C., & Kiselman, D. 2003, A&A, submitted
- (9)
- (10) Cimatti, A. et al. 2002, A&A, 391, L1
- (11)
- (12) Chapman, S. C., Blain, A. W., Ivison, R. J., & Smail, I. R. 2003, Nature, 422, 695
- (13)
- (14) Cohen, J. G., Blandford, R., Hogg, D. W., Pahre, M. A., & Shopbell, P. L. 1999a, ApJ, 512, 30
- (15)
- (16) Cohen, J. G., Hogg, D. W., Pahre, M. A., Blandford, R., Shopbell, P. L., & Richberg, K. 1999, ApJS, 120, 171
- (17)
- (18) Coil, A.L., Davis, M., Madgwick, D.S., Newman, J.A., Conselice, C.J., Cooper, M., Ellis, R.S., Faber, S.M., Finbeiner, D., Guhathakurta, P., Kaiser, N., Koo, D.C., Phillips, A.C., Steidel, C.C., Weiner, B.J., Willmer, C.N.A., & Yan, R. 2003, preprint (astro-ph/0305586)
- (19)
- (20) Connolly, A. J., Szalay, A. S., Dickinson, M., Subbarao, M. U., & Brunner, R. J. 1997, ApJ, 486, L11
- (21)
- (22) Daddi, E. et al. 2003, ApJ, in press (astro-ph/0308456)
- (23)
- (24) de Mello, D. F., Leitherer, C., & Heckman, T. M. 2000, ApJ, 530, 251
- (25)
- (26) Denicoló, G., Terlevich, R., & Terlevich, E. 2002, MNRAS, 330, 69
- (27)
- (28) Dickinson, M., Papovich, C., Ferguson, H. C., & Budavári, T. 2003, ApJ, 587, 25
- (29)
- (30) Di Matteo, T., Croft, R. A. C., Springel, V., & Hernquist, L. 2003, ApJ, 593, 56
- (31)
- (32) Erb, D. K., Shapley, A. E., Steidel, C. C., Pettini, M., Adelberger, K. L., Hunt, M. P., Moorwood, A. F. M., & Cuby, J. 2003, ApJ, 591, 101
- (33)
- (34) Esteban C., Peimbert M., Torres-Peimbert S., & Escalante V. 1998, MNRAS, 295, 401
- (35)
- (36) Esteban, C., Peimbert, M., Torres-Peimbert, S., & Rodríguez, M. 2002, ApJ, 581, 241
- (37)
- (38) Fontana, A. et al. 2003, ApJ, 594, L9
- (39)
- (40) Freeman, K. & Bland-Hawthorn, J. 2002, ARAA, 40, 487
- (41)
- (42) Giavalisco, M., Dickinson, M., Ferguson, H. C., et al. 2003, ApJ, in press (astro-ph/0309065)
- (43)
- (44) Kennicutt, R. C. 1998, ARA&A, 36, 189
- (45)
- (46) Leitherer, C. 2002, in A Decade of HST Observations, ed. M. Livio, K. S. Noll, & M. Stiavelli (Cambridge: CUP), in press
- (47)
- (48) Leitherer, C., et al. 1999, ApJS, 123, 3
- (49)
- (50) Leitherer, C., Calzetti, D., & Martins, L. P. 2002, ApJ, 574, 114
- (51)
- (52) Leitherer, C., Leão, J. R. S., Heckman, T. M., Lennon, D. J., Pettini, M., & Robert, C. 2001, ApJ, 550, 724
- (53)
- (54) Lemoine-Busserolle, M., Contini, T., Pelló, R., Le Borgne, J.-F., Kneib, J.-P., & Lidman, C. 2003, A&A, 397, 839
- (55)
- (56) Madau, P., Ferguson, H. C., Dickinson, M. E., Giavalisco, M., Steidel, C. C., & Fruchter, A. 1996, MNRAS, 283, 1388
- (57)
- (58) McCarthy, J.K., et al 1998, SPIE, 3355, 81
- (59)
- (60) McLean, I. S., et al. 1998, Proc. SPIE, 3354, 566
- (61)
- (62) Oke, J.B., Cohen, J.G., Carr, M., Cromer, J., Dingizian, A., Harris, F.H., Labrecque, S., Lucinio, R., Schaal, W., Epps, H., & Miller, J. 1995, PASP, 107, 3750
- (63)
- (64) Papovich, C., Dickinson, M., Ferguson, H.C., Giavalisco, M., Lotz, J., Madau, P., Idzi, R., Kretchmer, C., Moustakas, L.A., de Mello, D.F., Gardner, J.P., Rieke, M.J., Somerville, R.S., & Stern, D. 2003, ApJL, in press (astro-ph/0310888)
- (65)
- (66) Pettini, M., & Pagel, B.E. 2004, MNRAS, submitted.
- (67)
- (68) Pettini, M., Rix, S. A., Steidel, C. C., Adelberger, K. L., Hunt, M. P., & Shapley, A. E. 2002a, ApJ, 569, 742
- (69)
- (70) Pettini, M., Rix, S. A., Steidel, C. C., Hunt, M. P., Shapley, A. E., & Adelberger, K. L. 2002b, Ap&SS, 281, 461
- (71)
- (72) Pettini, M., Shapley, A. E., Steidel, C. C., Cuby, J., Dickinson, M., Moorwood, A. F. M., Adelberger, K. L., & Giavalisco, M. 2001, ApJ, 554, 981
- (73)
- (74) Pettini, M., Steidel, C. C., Adelberger, K. L., Dickinson, M., & Giavalisco, M. 2000, ApJ, 528, 96
- (75)
- (76) Rudnick, G., et al. 2003, ApJ, submitted (astro-ph/0307149)
- (77)
- (78) Salpeter, E. E. 1955, ApJ, 121, 161
- (79)
- (80) Shapley, A. E., Steidel, C. C., Adelberger, K. L., Dickinson, M., Giavalisco, M., & Pettini, M. 2001, ApJ, 562, 95
- (81)
- (82) Shapley, A. E., Steidel, C. C., Pettini, M., & Adelberger, K. L. 2003, ApJ, 588, 65
- (83)
- (84) Steidel, C. C., Adelberger, K. L., Giavalisco, M., Dickinson, M., & Pettini, M. 1999, ApJ, 519, 1
- (85)
- (86) Steidel, C. C., Adelberger, K. L., Shapley, A. E., Pettini, M., Dickinson, M., & Giavalisco, M. 2003, ApJ, 592, 728
- (87)
- (88) Steidel, C. C., Hunt, M. P., Shapley, A. E., Adelberger, K. L., Pettini, M., Dickinson, M., & Giavalisco, M. 2002, ApJ, 576, 653
- (89)
- (90) Teplitz, H. I. et al. 2000, ApJ, 542, 18
- (91)
- (92) Thomas, N.L., & Wolfe, J. 2000, SPIE, 4003, 312
- (93)
- (94) Walborn, N.R., Nichols-Bohlin, J., & Panek, R.J. 1985, International Ultraviolet Explorer Atlas of O-type spectra from 1200 to 1900 Angstroms (NASA Ref. Pub. 1155; Baltimore, MD: NASA/STScI)
- (95)