GEMS: Galaxy Evolution from Morphologies and SEDs
Abstract
GEMS, Galaxy Evolution from Morphologies and SEDs, is a large-area (800 arcmin2) two-color (F606W and F850LP) imaging survey with the Advanced Camera for Surveys on HST. Centered on the Chandra Deep Field South, it covers an area of , or about 120 Hubble Deep Field areas, to a depth of mAB(F606W) and mAB(F850LP) for compact sources. In its central , GEMS incorporates ACS imaging from the GOODS project. Focusing on the redshift range , GEMS provides morphologies and structural parameters for nearly galaxies where redshift estimates, luminosities and SEDs exist from COMBO-17. At the same time, GEMS contains detectable host galaxy images for several hundred faint AGN. This paper provides an overview of the science goals, the experiment design, the data reduction and the science analysis plan for GEMS.
1 Introduction
The formation and the evolution of galaxies are driven by two interlinked processes. On the one hand, there is the dynamical assembly of the mass distribution in the context of dark-matter dominated, hierarchical structure formation. On the other hand, there is the star-formation history (SFH), i.e. the successive conversion of gas into stars, along with the ensuing feedback. By now, the cosmological background model and the corresponding large-scale structure growth are well constrained (e.g. Percival et al. 2002; Spergel et al. 2003; we will use , and km/s throughout), and the focus is shifting towards understanding on galaxy scales the dynamics and the physics of star formation, reflected in the structure and stellar populations of the resulting galaxies.
On the one hand, a comprehensive picture of galaxy formation must match the population statistics of integrated galaxy properties, e.g. the galaxy luminosity and mass functions or the overall spectral energy distributions (SED), and the dependence of these distributions on the larger environment. But a picture of galaxy formation should also explain the internal structure of galaxies: e.g. their size, bulge-to-disk ratio, degree of symmetry, internal population gradients, and nuclear properties. Many of the ingredients that determine the internal structure and the SFH are qualitatively clear. For example, the size of galaxies is linked to the angular momentum of the stars and their progenitor gas, created early on through tidal torquing; spheroid stars formed before or during the last episode of violent relaxation, whereas most disk stars in large galaxies have formed after the last major merger; and major mergers are effective triggers of powerful starbursts, if the progenitor galaxies have a sizeable supply of cold gas. These same mergers are also suspected to trigger nuclear (AGN) activity by funneling gas into the vicinity of the ubiquitous central black holes.
Quantitative theoretical predictions of the resulting internal structure and SFHs of individual galaxies are neither robust nor unique, as galaxy formation involves a vast range of spatial scales, from well below 1 pc to well above 1 Mpc, along with complex geometries. Neither direct numerical simulations (e.g. Katz & Gunn 1991; Steinmetz & Navarro 2002; Springel, Yoshida, & White 2001), nor semi-analytic models (e.g. Cole et al. 2000; Kauffmann, White, & Guiderdoni 1993; Somerville & Primack 1999) can currently capture all important aspects of the problem. Turning to empiricism in light of this situation, galaxy evolution is perhaps best studied by observing directly how the properties of the galaxy population change with cosmic epoch.
Observational constraints on the galaxy population in the present-day () universe have drastically improved over the last years, in particular through three large surveys: 2MASS imaging the sky in the near-infrared (Skrutskie et al. 1997), and the optical surveys SDSS (York et al. 2000) and 2DFRS (Colless et al. 2001). The galaxy luminosity functions, the galaxy (stellar) mass function, the galaxy correlation function, the distribution of spectral energy distributions, the distribution of galaxy sizes, etc. have been (re-)determined with unprecedented accuracy (e.g. Blanton et al. 2003c; Norberg et al. 2002; Shen et al. 2003; Kauffmann et al. 2003; Bell et al. 2003a; Strateva et al. 2001).
The observational challenge now is to come up with a correspondingly more detailed assessment of galaxy properties and galaxy population properties at earlier epochs. Over the last decade the ‘look-back’ approach to studying galaxy evolution has experienced a number of breakthroughs, both in obtaining distant galaxy samples with secure redshifts to study integrated galaxy properties, and in obtaining high-resolution imaging, mostly with HST, to study internal structure (e.g. Ellis et al. 1996; Lilly et al. 1996; Steidel et al. 1996; Williams et al. 1996; van Dokkum et al. 1998). Yet, for a full comparison with local samples, these data sets – typically a few hundred objects – have been much too small. This holds especially true considering only samples with redshift and internal structure information. For one, these samples are too small in number to allow dissecting the galaxy population by redshift, luminosity, color, size or even environment, and still be left with significant subsamples. Previous samples with redshifts and well-resolved images have also been drawn from too small an area. As a consequence, they cannot reflect the ‘cosmic average’ at any epoch, because luminous galaxies are clustered quite strongly at all epochs (e.g. Giavalisco et al. 1998, Phleps and Meisenheimer, 2003).
Existing studies of morphology and internal structure have shown that to the sizes and Hubble types of galaxies roughly resemble the nearby universe (e.g. Abraham et al. 1996; Lilly et al. 1998; Simard et al. 1999), whereby the significance of possible differences from (e.g. the higher incidence of distorted morphologies) is weakened by discrepant sample definitions, small sample sizes and survey volumes and by the observational effects of surface brightness dimming and of bandpass shifting. At , galaxy images lose their prima facie resemblance to the nearby universe and appear more compact, but there, too, the band pass shifting may give an exaggerated impression of true evolutionary effects of the galaxy population (e.g. Labbe et al. 2003).
Recently, the COMBO-17 project (Wolf et al. 2001; Wolf et al. 2003a, W03) has afforded a thirty-fold increase by number over the earlier redshift surveys [See also Fried et al. 2001; Im et al. 2002; Le Fevre et al. 2003; Davis et al. 2002 for other recent or ongoing surveys] . COMBO-17 incorporates deep () photometry in 17 optical filter bands, providing redshifts good to zz for both galaxies and AGNs. From a sample of galaxies with , the survey has explored the population and integrated properties of galaxies since these redshifts. Building on earlier results, COMBO-17 has detailed and quantified the increasing prominence of massive galaxies without young stars (Bell et al. 2003b), the shift of high specific star formation activity to low mass systems (W03), and the SED-differential evolution of galaxy clustering (Phleps & Meisenheimer 2003). Furthermore, COMBO-17 has provided a deep insight into the population and evolution of low-luminosity AGNs (Wolf et al. 2003b).
Yet, as any other ground-based imaging survey, COMBO-17 could add little to elucidating the evolution of internal structure over this redshift interval. The goal of the present project, GEMS (Galaxy Evolution from Morphologies and SEDs), is to provide an order of magnitude improvement in assessing the evolution of the internal structure and morphology of galaxies over the ‘last half’ of cosmic history (actually the last 8.5 Gyrs to ) through wide-area, high-resolution imaging with HST.
Foremost, GEMS should address a) how the galaxy merger and tidal interaction rate evolved since ; b) which portion of the global star formation rate at any given epoch is externally triggered, through tidal interaction or mergers; c) whether stellar disks grew “inside out”; d) whether the formation of bulges entirely preceded the formation of their surrounding disks; e) whether stellar bars are a recent () phenomenon; f) whether the drastic decay in nuclear accretion activity is reflected in any drastic change of the host galaxy population.
Obviously, we would be most interested in tracing the evolution of individual objects. Yet, only the evolution of population properties is observable. In practice, one tries to bridge this gap and answer the above questions by assessing separately the redshift evolution of various structural parameter relations and of space densities for different galaxy sub-samples: e.g. the relation of disk- or bulge-size vs. their luminosity or stellar mass; the space density of large disks; the ratio of disk and bulge stars at different epochs, the fraction of young stars in disks, etc..
GEMS, and a number of other cosmological imaging surveys (in particular the narrower, but deeper GOODS survey; Giavalisco et al. 2003, Ferguson et al. 2003, Moustakas et al. 2003) with HST, have been enabled by the advent of the Advanced Camera for Surveys (ACS, Ford et al. 2003), which vastly improves the survey speed of HST. The GEMS observations were planned at a time when much research effort in observational cosmology is centered around a number of selected fields, such as the HDF’s North and South, or the Chandra Deep Fields, where multiwavelength observations from the X-rays to the far-IR and radio are creating synergies; the GEMS mosaic encompasses such a field, the Chandra Deep Field South.
In the remainder of the paper we outline the experiment design (§2), the initial data reduction (§3), the image analysis and initial galaxy catalog (§4), and the planned science analysis.
2 Experimental Design
The immediate goal of the GEMS survey is to provide high resolution images from which to extract an empirical data base of ‘structural parameters’ that describe the stellar bodies for a large sample of distant galaxies. Here we outline the rationale for the particular survey implementation.
To resolve the internal structure of galaxies at , with expected typical scalelengths of kpc, one needs imaging at a spatial resolution considerably finer than their apparent size: e.g. 2 kpc project to at . To date HST is still far more efficient to deliver this over wide fields over wide fields than AO on large ground-based telescopes, such as afforded by CONICA on the VLT (Lenzen et al. 2003).
Sample Size: The desideratum is the distributions of galaxy size, light concentration, bulge-to-disk-ratio, and morphology as a function of redshift, luminosity, SED, and perhaps environment. Even considering only one number to characterize the internal structure of galaxies, one needs to estimate the frequency distribution of galaxies in a four-dimensional parameter space , (,L,SED,structure). For a handful of bins per axis and 10 galaxies per bin (or S/N ), one needs samples of galaxies.
Choice of Survey Area and Field: To approach representative sampling of environments, the field size must be well in excess of the correlation length of typical (L∗) galaxies, which is 5 Mpc comoving for , Phleps and Meisenheimer 2003; Coil et al. 2003), and even twice as large for red, early type galaxies (e.g. Daddi et al 2001). This scale corresponds to at , or three times HST’s field-of-view in a single pointing () with the ACS (Ford et al. 2003). The need for large samples with redshifts, faint limiting magnitudes and imaging with HST’s restricted field of view lead to a densely sampled, contiguous field. To date, the COMBO-17 survey provides redshifts and SEDs in three disjoint fields (WO3) of each, one including the Chandra Deep Field South (CDFS, Giacconi et al. 2001), which we refer to as the ‘extended CDFS’ (E-CDFS) area. Note that the results of W03 show, that even for such large field sizes the galaxy population variations due to large scale structure are still very significant, e.g. % rms for luminous red galaxies over redshift intervals of z.
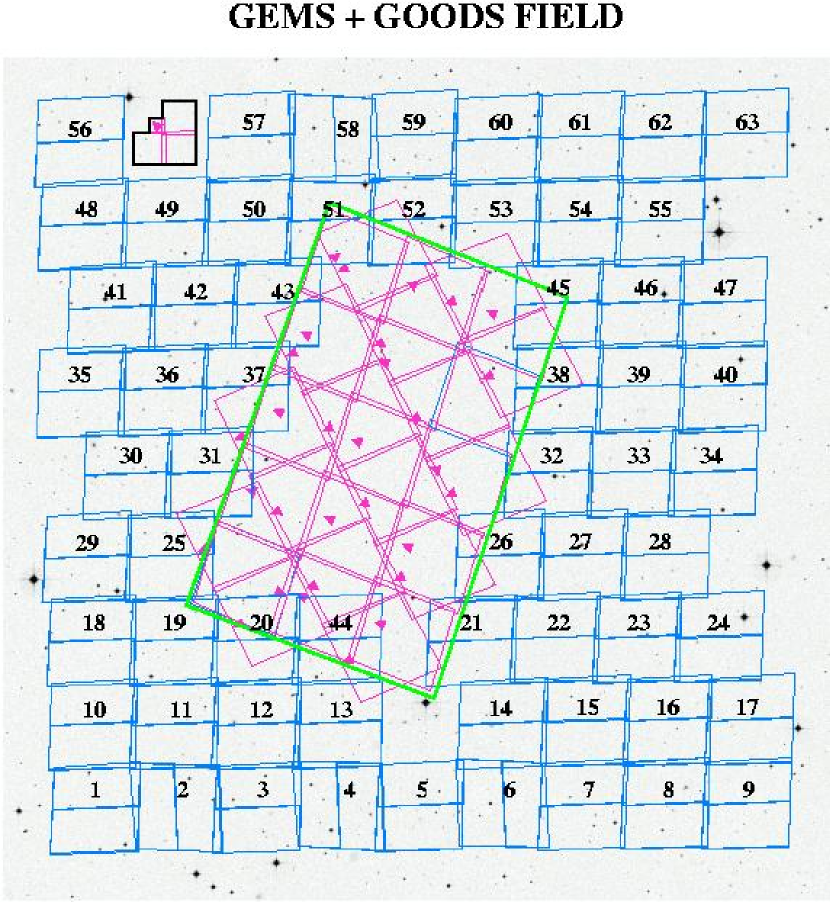
In part, we chose the E-CDFS because it appeared a priori representative with respect to its galaxy population, as opposed to e.g. the Abell 901 cluster field in COMBO-17. But foremost, the field is preferable because of the intense focus of research at other, complementary wavelengths, in particular in X-rays with Chandra and XMM observations (Rosati et al. 2002) and in the thermal infrared with upcoming SIRTF observations (GOODS, Dickinson et al. 2003). As we will detail in §3, GEMS imaging is coordinated with the multi-epoch GOODS imaging over the central 25% of the total GEMS area. The GEMS survey area and its spatial relation to the GOODS and COMBO-17 field is illustrated in Figure 1. The central co-ordinates of the COMBO-17, and hence GEMS, field are =03h 32m 25s, 50′′ (2000).
Flux Limit and Filters: To reach ‘typical’ galaxies (L ) to redshifts of z1, one needs samples with redshifts to a magnitude limit of 23.5 (WO3). The GEMS imaging depth was designed to permit robust galaxy model fits for most objects that are in the COMBO-17 redshift sample, . To get S/N 20 on extended objects near this magnitude requires about one orbit of exposure time with the ACS in F850LP.
The structural parameters (de Jong 1996; Kranz, Slyz, & Rix 2003) and morphology (see e.g. Rix & Rieke 1993), especially of late types galaxies, depend on the observed wavelength. Therefore, one must study morphology evolution at comparable rest-frame wavelengths across the explored redshift. The ACS filters chosen were F606W (between the Johnson V and R bands, hereafter “V”) and F850LP (corresponding approximately to, and hereafter referred to as, the z-band). For some redshift ranges these observations provide immediately galaxy images in the rest-frame B-band ( 4500 Å). For most redshifts one can reconstruct such a rest-frame image through pixel-by-pixel interpolation across the two bands, or through modest extrapolation in the other redshift ranges. The lowest redshifts of interest, z0.2, require a blueward extrapolation of the observed V-band flux by 10% in and the highest redshifts, z=1.2, a 10% redward extrapolation of the z-band flux. For redshifts in between one can interpolate between the two observed filters; at z0.33 our V-band corresponds directly to rest-frame B, as does the z-band at z1. This choice of filters also provides consistency with the GOODS data at the field center.
Observations in two filters are crucial not only for the reconstruction of the rest-frame B-band, but also for color information, especially radial gradients, within one galaxy. Given limited observing time, area and imaging depth were deemed more important than a third filter. In cycle 11, 125 orbits of HST time (G0-9500, PI: Rix) were awarded to carry out this program. All these data have no proprietary period and are freely accessible.
3 Data
The full details of tile lay-out (Figure 1), the observations, the data reduction, and the data quality assessment will be given in Caldwell et al. 2004 (in prep., C04); here we provide a brief overview.
3.1 Observations
The bulk of the GEMS observations (59 visits, or 117 orbits) were carried out with the ACS’s WFC (Ford et al. 2003) between Nov 4 and Nov 24, 2002. Two visits were executed on Sep 14, 2002 and one each on Feb 24 and Feb 25, 2003. The first epoch observations of the GOODS survey that cover the central position of the GEMS field were taken in July and August 2002 (Giavalisco et al. 2003). The tile pattern of the overall mosaic (Figure 1) was laid out to a) encompass the GOODS epoch 1 data; b) create a large contiguous imaging field; and c) avoid excessively bright stars that would lead to excessive charge bleeding and scattered light on the CCD. Of the 63 tiles, 59 are oriented North-South. For four tiles, the availability of guide stars forced an orientation at right angles to the remaining ones (see Figure 1).
Each HST orbit visit (see labels in Fig. 1) consisted of three separate 12 min to 13 min exposures each for both V-band (F606W) and z-band (F850LP), dithered by 3” between exposures. The exposures of each tile in each filter required one full orbit with overhead. The dithering was chosen both to close the inter-chip gap and to provide sub-pixel sampling for drizzling of the final image. In each visit the first orbit was spent on V and the second on the z-band, where the rapid re-acquisition allowed a slightly longer (by 3 min) total exposure time.
3.2 Data Reduction
For the first version of the GEMS data the underlying approach was to reduce each tile in each filter separately, i.e. each set of 3 dithered exposures taken within an orbit was first treated as a completely independent data set. To assure data homogeneity, we re-reduced the first epoch GOODS data at the center of the overall GEMS area in the exactly same way as the GEMS data.
Each frame was processed using CALACS ( www.stsci.edu/hst/acs/analysis ) to take care of bias and dark current subtraction, flatfielding and to include the photometric calibration information. Frame combination and cosmic-ray rejection were accomplished with multidrizzle (Mutchler, Koekemoer, & Hack 2003), resulting in a combined image and a variance array on a 0.”03/pixel grid (as opposed to the original 0.”05/pix of the individual frames). We opted for a relatively fine 0.”03 scale, to avoid resolution degradation in subsequent operations, even though it implies more strongly correlated pixel noise (C04).
Cosmic ray rejection with three dithered frames worked excellently. As GEMS does not address time variable phenomena, any faint and rare residual cosmic rays are not of concern for its immediate science goals.
The astrometry of each image tile was tied to the overall catalog from the ground-based COMBO-17 r-band image (Wolf et al. 2001, W03), with an rms of per source (see also §4.1). Both filters of each GEMS tile are tied to the COMBO-17 frame independently, but the V-band frames were subsequently micro-registered to a fraction of a pixel with respect to the z-band frame, for the color distribution analysis of individual sources.
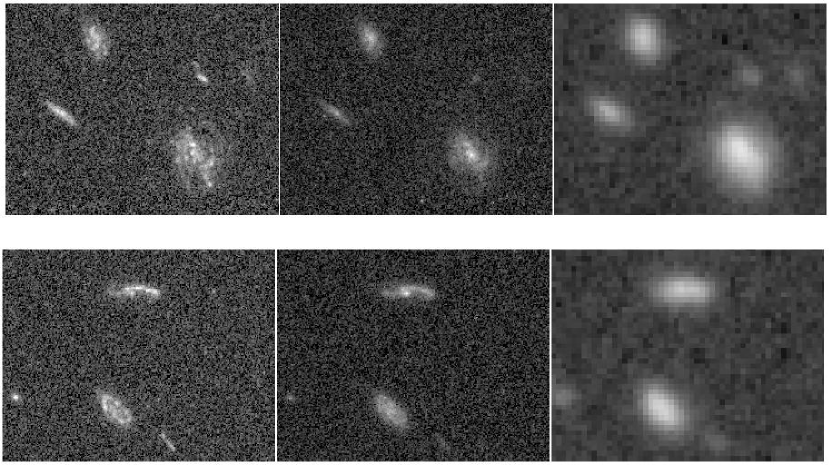
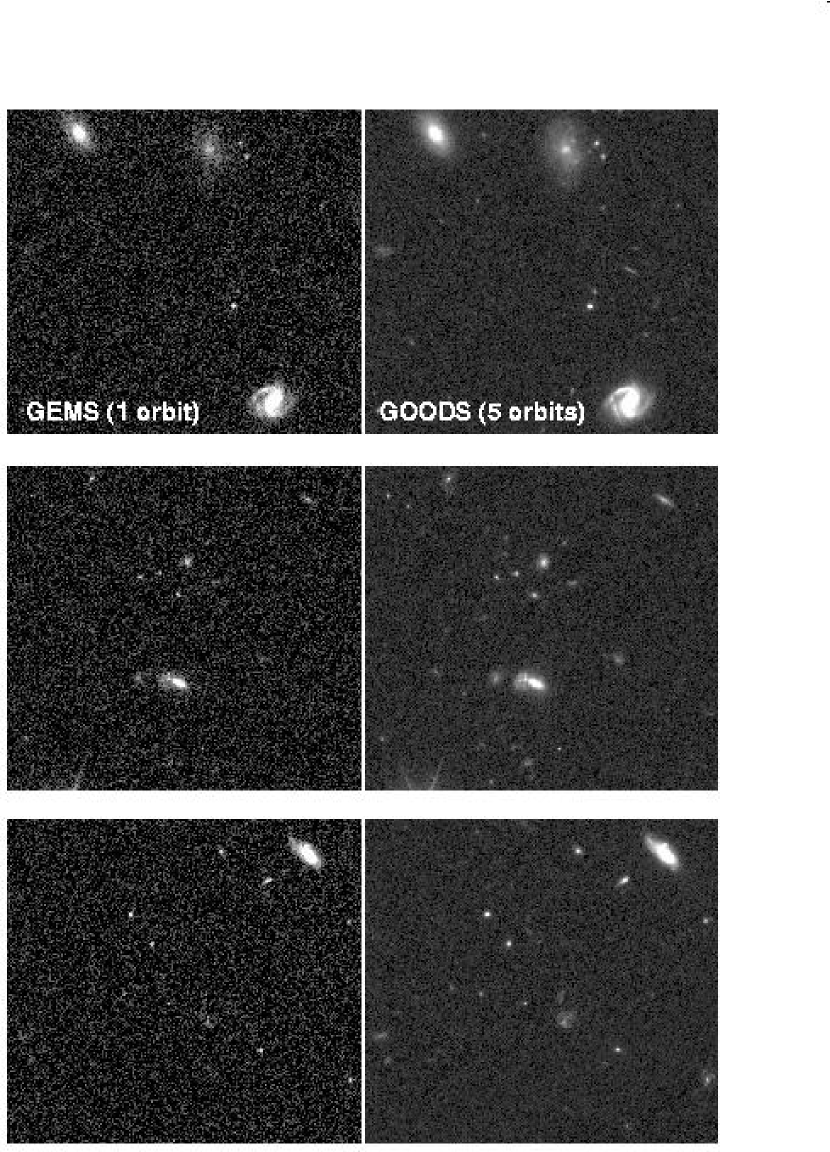
Flux calibration was done using the best available zero points as of Feb. 2003, and . The resulting point source sensitivities (5 ) are: (V) = 28.25 and (z)= 27.10, in AB magnitudes. The angular resolution of the images, /D and in V-band (F606W) and z-band (F850LP), respectively, corresponds to physical resolutions of 500 pc and 700 pc for galaxies at , comparable to galaxies in the Coma Cluster imaged with 1′′ seeing. Figures 2 and 3 give a visual impression of how the GEMS images compare to the two most immediately related data sets: the deep r-band image from COMBO-17 and the deep, 5-orbit GOODS images. The total affective area of the GEMS mosaic is 796 arcmin2.
We have not found any significant tile-to-tile variations in the relevant data properties (noise, sensitivity, etc. ) and it appears that the intra-tile variations in sensitivity are also negligible. Further details will be given in C04.
4 Data Analysis
As the largest, multi-color image taken with HST to date, GEMS can be applied to wide range of scientific problems. Yet, the immediate focus of GEMS is to study the internal structure of galaxies for which redshifts and SEDs exist from COMBO-17. To accommodate the narrow and broader goals, the data analysis is broken down into three steps: 1) a catalog of “all” objects well detected in the GEMS z-band (F850LP) image, 2) a match-up with the COMBO-17 catalog, 3) the fitting of parameterized image models to selected source postage stamps. At a later stage this will be followed by the creation and analysis of color images. As for many applications of immediate interest, the longest accessible rest-frame wavelength is most relevant, thus the first version of the GEMS catalog is “driven” by the -band image, with the -band image providing color information.
4.1 Object Detection and Deblending
For parsing an image into an object catalog, the most widely used image software at present is SExtractor (Bertin & Arnouts 1996). As for the COMBO-17 catalogs, we apply SExtractor to the GEMS mosaic to obtain positions and a variety of photometric parameters for each detected source. We configure SExtractor to produce a GEMS source catalog that a) contains nearly all objects from the statistical COMBO-17 sample (m); b) avoids spurious deblending of the largest galaxies, which show ample substructure in the HST images, reflecting spiral arms, OB associations, etc. ; c) provides a homogeneous, flux- and surface brightness-limited catalog of all sources in the -band GEMS mosaic, regardless of COMBO-17 or other external information.
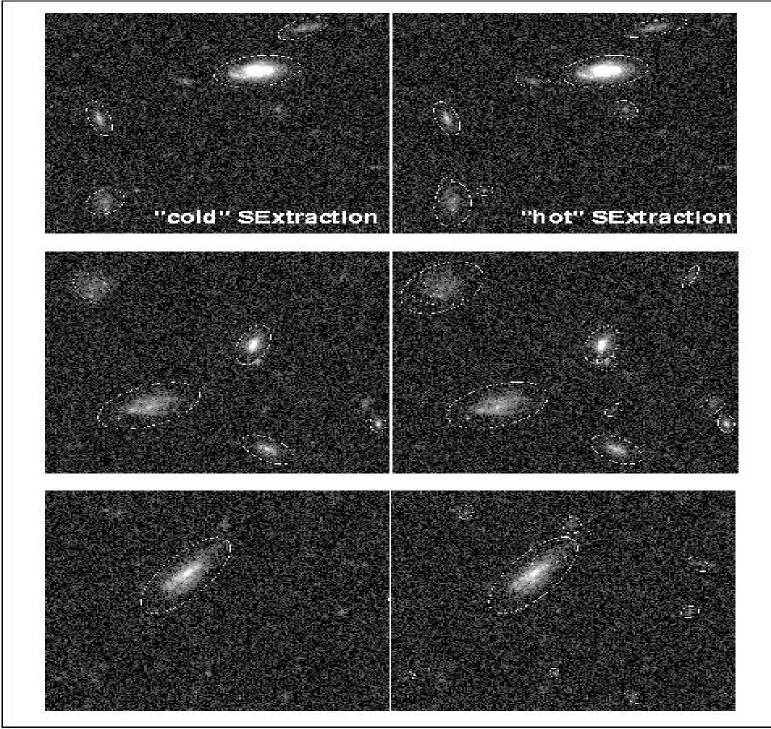
Even the first two requirements cannot be achieved with a single SExtractor parameter setting. The point-source flux limit of the GEMS -band image is more than two magnitudes fainter than the COMBO-17 catalog limit (for typical SEDs). But the ground-based data, drawing on long exposures and large pixels, have at least as high a surface brightness sensitivity as the ACS data (see Fig. 2). To pick up all diffuse, low-surface brightness objects from COMBO-17, the SExtractor program requires an object detection threshold that is so sensitive that inevitably weak features in the outer parts of large galaxies get deblended spuriously, as illustrated in Figure 4. The judgment of “over-deblending” was made by visual inspection, independently by two of the co-authors (DHM & MB).
To meet our catalog requirements, we then employ two different source detection configurations with SExtractor: a) a conservative, cold setting that avoids spurious deblending of large objects with strong substructure, but does not pick up all faint, low-surface-brightness objects in the COMBO-17 catalog; and b) a hot version, assured to detect all faint objects at the expense of an occasional over-deblending of a large source (see Fig. 2). The following SExtractor configuration parameters define cold and hot source detections: (i) the detection threshold above background DETECT_THRESH = (cold), (hot); (ii) the minimum number of connected pixels above threshold DEBLEND_MINAREA = 100 (cold), 45 (hot); (iii) the minimum contrast between flux peaks for deblending multiple sources DEBLEND_MINCONT = 0.065 (cold), 0.06 (hot); and (iv) the number of sub-thresholds considered during deblending DEBLEND_NTHRESH = 64 (cold), 32 (hot). For both cases we employ a weight map () and a 3 pixel (FWHM) tophat filtering kernel. The use of weight maps reduces the number of spurious detections in low signal-to-noise (S/N) areas of each image (e.g. near image edges).
We apply SExtractor to our -band mosaic only; galaxies appear to have more substructure in the bluer -band imaging, which increases the number of spurious over-deblendings and hampers meeting our detection criteria. Our final catalog consists of all (18,528) objects detected with our cold configuration, augmented by an additional (23,153) hot detections, but only those found outside of the isophotal area of sources from the “cold” catalog. Note, that while the SExtractor parameters for the hot and cold configurations were fine tuned interactively, the final GEMS catalog (of 41,681 unique sources) is produced strictly algorithmically. This GEMS catalog will be published and described in complete detail in C04.
We cross-correlate the final GEMS source catalog with the ground-based COMBO-17 redshift catalog solely on the basis of the object coordinates. There are 9,833 objects with redshifts from COMBO-17 (m) in the E-CDFS field of COMBO-17. We consider as a match the nearest redshift coordinate of a GEMS -band position if it is within . The average RMS angular separation between matches is and the fraction of unclear or blended detections at COMBO-17 coordinates is . We find 8,312 unique GEMS sources with redshift matches resulting in a 84,5% success rate; the roughly 14.5% COMBO-17 objects without GEMS detections are due to the larger coverage of the E-CDFS region by COMBO-17 compared to our ACS imaging (Figure 1).
4.2 Image Simulations
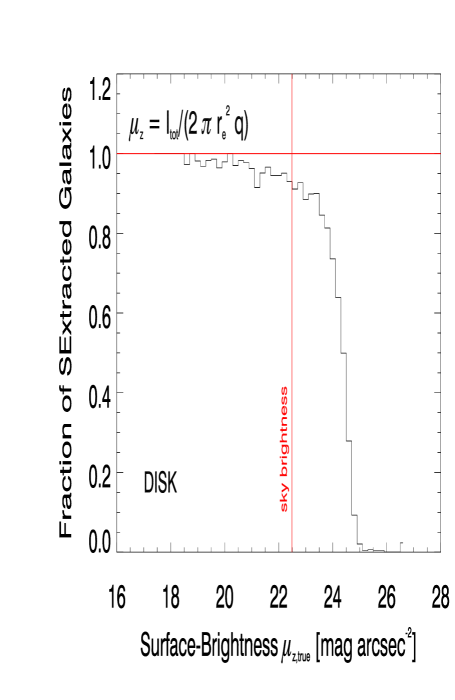
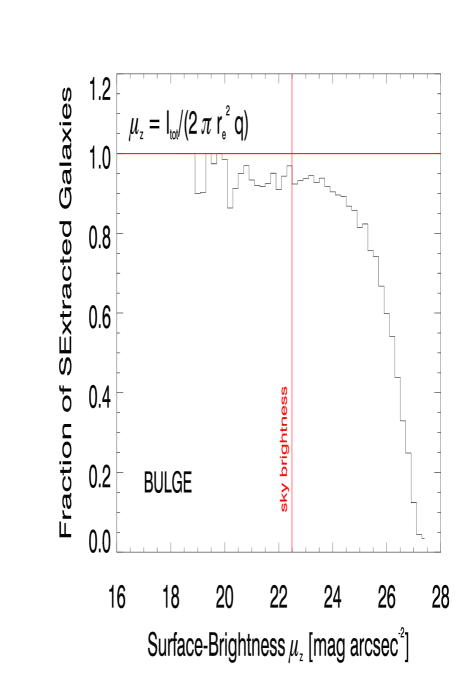
We explore the detection limits of the GEMS mosaic, with the above described SExtractor coldhot object detection configurations, by extensive Monte-Carlo simulations (Häußler et al. 2004, in prep). Simulated galaxy images were added to the actual data frames and processed as above. The detectability - and the subsequent ability to extract structural parameters - depends mostly on the effective surface brightness of the object (Figures 5 and 6), with much weaker dependences on the overall size and the axis ratio (Häußler et al. 2004, in prep). When defining the mean surface brightness of a galaxy image as:
where is the total flux, is the effective, or half-light radius and is the axis ratio, we find the characteristic (80%) completeness limit of the GEMS galaxy sample to be for exponential profiles and mag arcsec-2 for R1/4 profiles.
4.3 Point Spread Function
While the majority of galaxies in the combined COMBO-17/GEMS sample are resolved in the sense that the intrinsic half-light radius, Re, is larger than the diffraction limit of HST ( at -band), virtually all objects have central flux gradients on angular scales much smaller than the point spread function’s (PSF) FWHM. This is particularly true in the cases of AGNs, where the unresolved central source often dominates. Any image modeling of the galaxies in GEMS requires therefore an accurate knowledge of the PSF.
There are two basic ways to construct a model PSF for the subsequent image interpretation: a calculation of the theoretically predicted PSF, using e.g. TinyTim (Krist 1993) or an empirical construction from the point sources within the data (e.g. daophot, Stetson et al. 1987). By necessity, the synthetic PSF is based on model assumptions, some of which are not sufficiently understood. On the other hand, the empirical PSF depends on a finite number of bright but unsaturated stars in the data. For strong PSF variations within the field, they may be hard to derive from fields at high Galactic latitude.
The large number of ACS images obtained within GEMS, homogeneously acquired and reduced, has enabled us to study the inter- and intra-tile variations of the PSF in some detail. We found that variations among different tiles are negligible, while the PSF dependence on position within an ACS frame is noticeable but still small. We have performed extensive simulations assuring us that for fitting galaxy images without prominent AGN components, one universal, empirical high S/N PSF per filter is fully sufficient for all tiles and for all positions within each tile (Häußler et al. 2004, in prep.).
Active Galaxies with a strong nuclear point source require a more elaborate treatment, due to the spatial PSF variations within the tiles. For such cases we use appropriate sub-tile PSF representations, jointly derived from all pointings. For each AGN the sub-tile PSF is constructed from at least stellar images near its pixel position (Jahnke et al. 2004, in prep.).
5 Science Analysis Plan
The science analysis plan is obviously evolving, as we learn about the potential and limitations of the data, and as we learn from the data themselves.Here, we provide an outline of the current efforts:
Galaxy Fitting
Quantifying the radial distribution, shape, and morphology of galaxy images with a small number of parameters is a challenging problem with a long history. No single simplified image description can fit all science goals and we have therefore chosen a multi-pronged approach.
First, one can try to specify model-independent numbers, such as the magnitude within a set of fiducial apertures, or the effective (= half light) radius, or the luminosity-weighted mean ellipticity of the image. This requires a PSF deconvolution and proper noise weighting. Second, one can fit a parameterized, usually two-dimensional galaxy model to the image portions. Such models can be single component, e.g. exponential disks (Freeman 1970), de Vaucouleurs (1959) models, or the more general Sérsic (1968) models, or they can be multi-component models, e.g. representing a bulge, a disk, and perhaps an active nucleus. We fit the galaxy images with two different codes for parameterized models: GALFIT (Peng et al. 2002) and GIM2D (Simard et al. 1999).
On the other hand, non-axisymmetric components such as stellar bars and spiral arms, as well as asymmetries, tidal tails, and other distorted features do not lend themselves to a parameterized model description. In order to identify stellar bars and characterize their properties such as ellipticities and sizes, we perform isophotal fits to galaxy images (Jogee et al. 2004 in prep.). These isophotes provide a guide to the underlying orbital structure of the bar and disk, with the bar leading to a characteristic peak in ellipticity over a plateau in position angle (e.g, Wozniak et al. 1995; Friedli et al 1996; Jogee et al. 2002) over the region dominated by the family of stellar orbits (Contopoulos & Papayannopoulos 1980). The resulting profiles of surface brightness and ellipticity are deprojected to derive intrinsic bar properties.
Furthermore, we use the CAS code (Conselice, Bershady, & Jangren 2000) to quantify the asymmetry A and concentration C of the images. We measure A in the rest-frame -band in order to trace distorted features such as prominent tails, arcs, and double nuclei characteristic of interacting and merging systems, and thereby constrain the merger/interaction history (Jogee et al. 2004 in prep.. These techniques are augmented by a qualitative, by-eye classification for a subset (Bell et al. 2003b). The resulting structural parameters will then be used to study the luminosity–size, mass-size, compactness-color (Bell et al. 2003b), relations and their redshift evolution.
A detailed comparison and test of these approaches is underway (Häußler et al. 2004, in prep).
A separate fitting effort is underway to explore the host galaxies for all known AGNs in the GEMS field (e.g. Wolf et al. 2003b), requiring foremost the removal of the nuclear component of the image. Compared to existing host galaxy studies, the relatively faint nuclei, promise a very high success rate in host galaxy detection.
GEMS and COMBO-17
Beyond drawing on COMBO-17 redshifts to derive intrinsic luminosities and sizes, there are many intriguing ways to combine the two data sets. One can define “early-type” galaxies samples completely independently on the basis of SED or on radial luminosity profile (high Sersic index) and compactness, and compare to which extent the definitions lead to the same sample as color selection (Bell et al. 2003c). One can explore the evolution of the luminosity–size and luminosity–(stellar) mass relations for the overall galaxy population and for disks and spheroids separately. One can study the evolution of the galaxy size function, i.e. the evolution of the space density of galaxies with a given size. The stellar masses estimated from SED modeling (Borch et al. 2003, in prep.) of COMBO-17 data can be used to explore the structural and star-formation properties of galaxies as a function of stellar mass and of stellar surface-mass density.
Nearby Galaxy Comparison Sample
Any study of galaxy evolution should be anchored at the present epoch. At low redshifts (), the volume of GEMS is “small”, i.e. smaller than the galaxy correlation length. To increase the effective redshift range over which to study evolution, it is tantamount to assemble and analyze consistently a sample of present-epoch galaxies. Even though the data for the present-day universe have drastically improved, e.g. through SDSS, local universe data need considerable tailoring to mesh optimally with GEMS. We have chosen the SDSS galaxy sample from the DR1 (Abazijan et al. 2003) for this comparison. Remarkably, only to distances of is the spatial resolution of the SDSS imaging (at angular resolution) sufficient to match the ACS’s resolution for objects at . For this local comparison sample we are deriving SED-based estimates of the stellar mass and U-V rest-frame color estimates for consistency with the COMBO-17 data on the GEMS field.
Model Comparison and Follow-Up
Initial comparison between GEMS data and cosmological models will focus on semi-analytic models (Somerville et al. in prep.) that incorporate predictions for the sizes of disks and spheroids. Owing to the computational expense of N-body/SPH simulations, semi-analytic models are the only ones that can predict population statistics of structural parameters.
Modeling of the colors in terms of stellar populations, and estimating e.g. mass-to-light ratios will build on COMBO-17’s multi-band SED modeling (Borch et al. 2003). With GEMS such an analysis can be done pixel-by-pixel, using observations in two bands and following the approach of Bell & de Jong (2001). This analysis will ultimatively allow to estimate e.g. half-mass, rather than half-light, radii for the stellar bodies of galaxies.
To understand better the stellar populations of the galaxies in the GEMS field, to increase the redshift range over which galaxies can be studied, to improve the stellar mass estimates and star formation rate estimates, a suite of analyses is underway within the GEMS collaboration and by others. This includes near-IR imaging (e.g. Chen et al. 2003) and X-ray imaging with Chandra (Cycle 5, PI: N. Brandt). With this follow-up, the data from GEMS seem certain to be scientifically fruitful beyond the project’s initially articulated goals.
6 Summary
The GEMS project, which stands for “Galaxy Evolution from Morphologies and SEDs”, has produced the largest color image taken with HST to date, providing structural and morphological information for over 10,000 distant galaxies. As an overarching summary and reference for a series of papers with individual results from GEMS, we have presented here an overview of the science goals, the experiment layout, the observations, the main data reduction steps and the initial data modeling philosophy.
While the core science goals, mapping the evolution of galaxy bulges, disks and mergers over the last half of the universe’s age, can draw on a single data processing approach, described here, the investigation of AGN host galaxies, of gravitational lensing, and of internal color gradients in galaxies will require further processing. To ensure broad scientific impact of the GEMS data, we will provide all processed data, along with redshifts for 10,000 galaxies, via the World Wide Web in Spring 2004.
References
- Abazajian et al. (2003) Abazajian, K., et al. 2003, AJ, 126, 2081
- Abraham et al. (1996) Abraham, R. G., Tanvir, N. R., Santiago, B. X., Ellis, R. S., Glazebrook, K., & van den Bergh, S. 1996, MNRAS, 279, L47
- Bell & de Jong (2001) Bell, E. F., & de Jong, R. S. 2001, ApJ, 550, 212
- Bell, McIntosh, Katz, & Weinberg (2003a) Bell, E. F., McIntosh, D. H., Katz, N., & Weinberg, M. D. 2003a, ApJS, in press (astro-ph/0302543).
- Bell et al. (2003b) Bell, E. F., Wolf, C., Meisenheimer, K., Rix, H.-W., Borch, A., Dye, S., Kleinheinrich, M., & McIntosh, D. H. 2003b astro-ph/0303394
- Bell et al. (2003c) Bell, E. F., et al. 2003c, submitted to ApJL (astro-ph/0308272)
- Bertin & Arnouts (1996) Bertin, E., & Arnouts, S. 1996, A&AS, 117, 39
- Blanton et al. (2003c) Blanton, M. R., et al. 2003c, submitted to ApJ (astro-ph/0210215)
- Borch, Meisenheimer, Wolf, & Gray (2003) Borch, A., Meisenheimer, K., Wolf, C., & Gray, M. 2003, Ap&SS, 284, 965
- Chen et al. (2003) Chen, H., et al. 2003, ApJ, 586, 745
- Coil et al. (2003) Coil, A., et al. 2003, ApJ, submitted (astro-ph/0305586)
- Cole, Lacey, Baugh, & Frenk (2000) Cole, S., Lacey, C. G., Baugh, C. M., & Frenk, C. S. 2000, MNRAS, 319, 168
- Colless et al. (2001) Colless, M., et al. 2001, MNRAS, 328, 1039
- Conselice, Bershady, & Jangren (2000) Conselice, C. J., Bershady, M. A., & Jangren, A. 2000, ApJ, 529, 886
- Contopoulos, G. & Papayannopoulos, T. (1980) Contopoulos, G. & Papayannopoulos, T. 1980, A&A, 92, 33
- Daddi et al. (2001) Daddi, E., Broadhurst, T., Zamorani, G., Cimatti, A., Röttgering, H., & Renzini, A. 2001, A&A, 376, 825
- Davis et al. (2003) Davis, M. et al. 2003, Proc. SPIE, 4834, 161
- de Jong (1996) de Jong, R. S. 1996, A&A, 313, 45
- de Vaucouleurs (1959) de Vaucouleurs, G. 1959, Handbuch der Physik, 53, 311.
- Dickinson, Giavalisco, & The Goods Team (2003) Dickinson, M., Giavalisco, M., & The Goods Team 2003, The Mass of Galaxies at Low and High Redshift. Proceedings of the ESO Workshop held in Venice, Italy, 24-26 October 2001, 324
- Ellis et al. (1996) Ellis, R. S., Colless, M., Broadhurst, T., Heyl, J., & Glazebrook, K. 1996, MNRAS, 280, 235
- Ferguson et al. (2003) Ferguson, H. et al. 2003, astro-ph/0309058.
- Ford et al. (2003) Ford, H. C., et al. 2003, Proc. SPIE, 4854, 81
- Freeman (1970) Freeman, K. C. 1970, ApJ, 160, 811
- Fried et al. (2001) Fried, J. W., et al. 2001, A&A, 367, 788
- Friedli et al. (1996) Friedli, D., Wozniak, H., Rieke, M., & Bratschi, P. 1996, A&AS, 118, 461
- Giacconi et al. (2001) Giacconi, R., et al. 2001, ApJ, 551, 624
- Giavalisco et al. (1998) Giavalisco, M., Steidel, C. C., Adelberger, K. L., Dickinson, M. E., Pettini, M., & Kellogg, M. 1998, ApJ, 503, 543
- Giavalisco & GOODS Team (2003) Giavalisco, M. & GOODS Team 2003, American Astronomical Society Meeting, 202,
- Im et al. (2002) Im, M., et al. 2002, ApJ, 571, 136
- Jogee et al. (2002) Jogee, S., Knapen, J. H., Laine, S., Shlosman, I., Scoville, N. Z., & Englmaier, P. 2002, ApJL, 570, L55 (astro-ph/0201208)
- Katz & Gunn (1991) Katz, N. & Gunn, J. E. 1991, ApJ, 377, 365
- Kauffmann, White, & Guiderdoni (1993) Kauffmann, G., White, S. D. M., & Guiderdoni, B. 1993, MNRAS, 264, 201
- Kauffmann et al. (2003) Kauffmann, G., et al. 2003, MNRAS, 341, 33
- Kranz, Slyz, & Rix (2003) Kranz, T., Slyz, A., & Rix, H.-W. 2003, ApJ, 586, 143
- Krist (1993) Krist, J. 1993, ASP Conf. Ser. 52: Astronomical Data Analysis Software and Systems II, 2, 536
- Labbé et al. (2003) Labbé, I., et al. 2003, ApJ, 591, L95
- Le Fèvre et al. (2003) Le Fèvre, O., et al. 2003, The Messenger, 111, 18
- Lenzen et al. (2003) Lenzen, R., et al. 2003, Proc. SPIE, 4841, 944
- Lilly, Le Fèvre, Hammer, & Crampton (1996) Lilly, S. J., Le Fèvre, O., Hammer, F., & Crampton, D. 1996, ApJ, 460, L1
- Lilly et al. (1998) Lilly, S., et al. 1998, ApJ, 500, 75
- Moustakaset al. (2003) Moustakas L. et al. 2003, astro-ph/0309187.
- Mutchler et al. (2003) Mutchler, M., Koekemoer, A, & Hack, W. 2003, 2002 HST Calibration Workshop, STScI, 2002, eds. Arribas, S., et al.
- Norberg et al. (2002) Norberg, P., et al. 2002, MNRAS, 336, 907
- Peng, Ho, Impey, & Rix (2002) Peng, C. Y., Ho, L. C., Impey, C. D., & Rix, H.-W. 2002, AJ, 124, 266
- Percival et al. (2002) Percival, W. J., et al. 2002, MNRAS, 337, 1068
- Phleps & Meisenheimer (2003) Phleps, S. & Meisenheimer, K. 2003, A&A, 407, 855
- Rix & Rieke (1993) Rix, H.-W., & Rieke, M. J. 1993, ApJ, 418, 123
- Rosati et al. (2002) Rosati, P., et al. 2002, ApJ, 566, 667
- Sersic (1968) Sérsic, J. L. 1968, Cordoba, Argentina: Observatorio Astronomico, 1968
- Shen et al. (2003) Shen, S., et al. 2003, MNRAS, 343, 978
- Simard et al. (1999) Simard, L., et al. 1999, ApJ, 519, 563
- Simard et al. (2002) Simard, L. et al. 2002, ApJS, 142, 1
- Skrutskie et al. (1997) Skrutskie, M. F., et al. 1997, in ‘The Impact of Large Scale Near-IR Sky Surveys’, eds. F. Garzon, et al. (Dordrecht: Kluwer Academic Publishing Company), 25
- Somerville & Primack (1999) Somerville, R. S. & Primack, J. R. 1999, MNRAS, 310, 1087
- Spergel et al. (2003) Spergel, D., et al. 2003, ApJ, in press
- Springel, Yoshida, & White (2001) Springel, V., Yoshida, N., & White, S. D. M. 2001, New Astronomy, 6, 79
- Steidel et al. (1996) Steidel, C. C., Giavalisco, M., Pettini, M., Dickinson, M., & Adelberger, K. L. 1996, ApJ, 462, L17
- Steinmetz & Navarro (2002) Steinmetz, M. & Navarro, J. F. 2002, New Astronomy, 7, 155
- Stetson (1987) Stetson, P. B. 1987, PASP, 99, 191
- Strateva et al. (2001) Strateva, I., et al. 2001, AJ, 122, 1861
- van Dokkum, Franx, Kelson, & Illingworth (1998) van Dokkum, P. G., Franx, M., Kelson, D. D., & Illingworth, G. D. 1998, ApJ, 504, L17
- Williams et al. (1996) Williams, R. E., et al. 1996, AJ, 112, 1335
- Wolf et al. (2001) Wolf, C., Dye, S., Kleinheinrich, M., Meisenheimer, K., Rix, H.-W., & Wisotzki, L. 2001, A&A, 377, 442
- Wolf et al. (2003a) Wolf, C., Meisenheimer, K., Rix, H.-W., Borch, A., Dye, S., & Kleinheinrich, M. 2003a, A&A, 401, 73
- Wolf et al. (2003b) Wolf, C., Wisotzki, L., Borch, A., Dye, S., Kleinheinrich, M., Meisenheimer, K. 2003b, A& A, in press astro-ph/0304072
- Wozniak et al. (1995) Wozniak, H., Friedli, D., Martinet, L., Martin, P., Bratschi, P. 1995, A&AS 111, 115.
- York et al. (2000) York, D. G., et al. 2000, AJ, 120, 1579