CHANDRA TEMPERATURE MAPS FOR GALAXY CLUSTERS WITH RADIO HALOS
Abstract
We analyze Chandra temperature maps for a sample of clusters with high-quality radio halo data, to study the origin of the radio halos. The sample includes A520, A665, A754, A773, A1914, A2163, A2218, A2319, and 1E 0657–56. We present new temperature maps for all but two of them (A520 and A754). All these clusters exhibit distorted X-ray morphology and strong gas temperature variations indicating ongoing mergers. Some clusters, e.g., A520, A665, 1E 0657–56, exhibit the previously reported spatial correlation between the radio halo brightness and the hot gas regions. However, it is not a general feature. While most mergers are too messy to allow us to disentangle the projection effects, we find clear counterexamples (e.g., A754 and A773) where the hottest gas regions do not exhibit radio emission at the present sensitivity level. This cannot be explained by projection effects, and therefore argues against merger shocks — at least those relatively weak ones responsible for the observed temperature structure in most clusters — as the main mechanism for the halo generation. This leaves merger-generated turbulence as a more likely mechanism. The two clusters with the clearest radio brightness – temperature correlation, A520 and 1E 0657–56, are both mergers in which a small dense subcluster has just passed through the main cluster, very likely generating turbulence in its wake. The maximum radio brightness and the hot gas are both seen in these wake regions. On the other hand, the halos in 1E 0657–56 and A665 (both high-velocity mergers) extend into the shock regions in front of the subclusters, where no strong turbulence is expected. Thus, in high-velocity () mergers, both shock and turbulence acceleration mechanisms may be significant.
Subject headings:
galaxies: clusters: general — galaxies: clusters: individual (A520, A665, A754, A773, A1914, A2163, A2218, A2319, 1E 0657–56) — intergalactic medium — X-rays: galaxies: clusters — Radio continuum1. INTRODUCTION
The baryonic content of the galaxy clusters is dominated by the hot ( keV) intergalactic gas whose thermal emission is observed in X-rays. Many clusters also exhibit diffuse radio sources that have no apparent connection to any individual cluster galaxy. In this paper, we are interested in the extremely low-brightness, large-scale sources classified as radio halos. They often span the whole cluster and are unpolarized. Other diffuse radio sources, not considered here, include strongly elongated relics, which are highly polarized and often found at the cluster periphery, and mini-halos which are found around the powerful central radio galaxy; for recent reviews see e.g. Kempner et al. (2003), Feretti (2003).
While the cluster X-ray emission is due to thermal electrons with energies of several keV, the radio halo emission at GHz is produced by synchrotron radiation of relativistic electrons with energies of GeV in magnetic fields with G. These electrons should coexist with the thermal population. Their origin is still uncertain; the difficulty in explaining their presence arises from the combination of the large sizes of halos ( Mpc) and the short synchrotron lifetime of these electrons ( yrs). One needs a mechanism by which these electrons are locally and simultaneously (re-)accelerated over the halo volume. Several such mechanisms of feeding energy to the relativistic electrons have been proposed (see, e.g., recent reviews by Enßlin 1999; Sarazin 2001; Brunetti 2002; Petrosian 2002 and references therein). We will briefly review theoretical arguments in §4.
On the observational side, the number of known radio halos is already sufficient to start looking for correlations with other cluster properties in order to elucidate their acceleration mechanism. Halos are typically found in clusters with significant substructure in the X-ray brightness which indicates merger activity (e.g., Feretti 1999; Buote 2001). Halos are present in rich clusters, characterized by high X-ray luminosities and temperatures. The percentage of clusters with halos in a complete X-ray flux-limited sample (that includes systems with erg s-1 in the keV band) is %. The halo fraction increases with the X-ray luminosity, to % for clusters with erg s-1 (Giovannini, Feretti, & Govoni 1999a). The radio power of a halo, if one is present, strongly correlates with the cluster luminosity, gas temperature (e.g., Liang et al. 2000; Colafrancesco 1999; Feretti 1999), or total mass (Govoni et al. 2001a). In a number of well-resolved clusters, a spatial correlation between the radio halo and X-ray brightness is observed (Govoni et al. 2001b). These observations indicate that radio halos are closely related to the intra-cluster thermal gas, its history and energetics. However, details of this connection need further investigations.
Because the halos appear to be related to cluster mergers, cluster gas temperature maps, which contain information on the merger geometry, stage, and velocity, can provide further information on their origin. Indeed, Chandra studies of A2163, A665 (Markevitch & Vikhlinin 2001, hereafter MV01), 1E 0657–56 (Markevitch et al. 2002a, hereafter M02a) and A520 (Markevitch et al. 2002b, hereafter M02b) revealed a possible spatial correlation between the high-temperature cluster regions and the diffuse radio emission. A665 showed a spatial correlation between the radio halo brightness and the location of a possible bow shock, appearing to support a merger shock origin for the relativistic halo electrons.
Clearly, an X-ray and radio study of a greater cluster sample is needed to see whether a spatial correlation between the radio halo and the gas temperature is a common feature. We present Chandra X-ray images and temperature maps for such a sample.
We make the radio – X-ray comparison for the clusters A520, A665, A754, A773, A1914, A2163, A2218, A2319, and 1E 0657–56. Chandra maps for A754 and A520 are reproduced from Markevitch et al. (2003a) and M02b, respectively. For A2163 and 1E 0657–56, we present temperature maps from new observations, deeper than those analyzed by MV01 and M02a; the full derivation of these maps will be presented by Markevitch et al. (in prep.) A higher-accuracy temperature map for A665 is derived in this work by adding a new long observation to the one used in MV01. For A773, A1914, A2218, and A2319, we derive the first high-resolution temperature maps here.
The radio data were taken from previously published work (A2319: Feretti, Giovannini, & Böhringer 1997; A665, A2218: Giovannini & Feretti 2000; 1E 0657–56: Liang et al. 2000; A520, A773: Govoni et al. 2001a; A2163: Feretti et al. 2001; A754, A1914: Bacchi et al. 2003).
We use km s-1 Mpc-1, and .
| Name | ObsID | exposure, | Observation | |
| ksec | date | |||
| A520 | 0.1990 | 528 | 9.3 | 2000 Oct 10 |
| A665 | 0.1819 | 531 | 8.5 | 1999 Dec 29 |
| 3586 | 23.8 | 2002 Dec 28 | ||
| A754 | 0.0542 | 577 | 39.1 | 1999 Oct 30 |
| A773 | 0.2170 | 533 | 10.4 | 2000 Sep 5 |
| 3588 | 8.3 | 2003 Jan 25 | ||
| A1914 | 0.1712 | 3593 | 17.6 | 2003 Sep 3 |
| A2163 | 0.2030 | 1653 | 69.6 | 2001 Jun 16 |
| A2218 | 0.1756 | 553 | 5.2 | 1999 Oct 19 |
| 1454 | 10.9 | 1999 Oct 19 | ||
| 1666 | 22.8 | 2001 Aug 30 | ||
| A2319 | 0.0557 | 3231 | 14.0 | 2002 Mar 15 |
| 1E 0657–56 | 0.296a | 3184 | 69.6 | 2002 Jul 12 |
| Col. 1: Cluster name; | ||||
| Col. 2: Redshift (Struble & Rood 1999; a Tucker et al. 1998) | ||||
| Col. 3: Chandra observation ID number; | ||||
| Col. 4: Clean exposure time; | ||||
| Col. 5: Observing date. | ||||
2. X-RAY ANALYSIS
We used archival and our proprietary Chandra ACIS data to derive X-ray images and gas temperature maps. ACIS111http://asc.harvard.edu/cal has an energy band of 0.3–9 keV and combines angular resolution and a moderate energy resolution. We used the CIAO222http://cxc.harvard.edu/ciao software package for data processing, XSPEC and A. Vikhlinin’s ZHTOOLS to fit the overall spectra and analyze images, and our own code to derive the temperature maps.
The X-ray observations are identified by their ID numbers (ObsID) in Table LABEL:chandra, where the clean exposure time and the observing date are listed. All observations were performed with the ACIS-I detector which covers a field of view of 16′16′.
Except for A1914, A2163, and 1E 0657–56, for which we use the longer of the two available exposures (of very different length), when more than one observation existed for the same object, the observations were combined.
2.1. X-ray data preparation
For each observation, standard screening was applied to the photon list. We removed bad pixels and columns, events with ASCA grades 1,5 and 7, and cosmic ray afterglows. The background was modeled using a composite blank-field background dataset corresponding to the period of the observations, cleaned and normalized as described by Markevitch et al. (2003b). In particular, we first excluded flare periods, extracting the X-ray light curves from the source-free parts of the field and requiring that the 0.3–12 keV background rate be within a factor of 1.2 of the nominal background. After the flare exclusion, we normalized the blank-sky background dataset to the cluster observation by the ratio of counts at high energies (in the PHA interval of 2500–3000 ADU; approximately 10–12 keV) which is free from the sky emission. This correction was always small, within 10% of the exposure ratio. If an observation was performed in VF mode, and if the corresponding VF-mode background dataset existed (ObsIDs 1666, 1653, 3184, 3231, 3586, 3588, 3593), additional particle background reduction (Vikhlinin 2001) was applied to the cluster and background data.
The soft Galactic background in the direction of the analyzed clusters (Snowden et al. 1997) is not much different than in the regions included in the blank-sky background — so no special treatment was required — for all clusters but A2163 and A2319. For A2163, treatment of the soft Galactic excess is described in MV01; the central region of A2319 that we analyze here is so bright that such an excess does not matter. In general, our temperature maps are limited to the brightest regions of the clusters where the background accuracy is not critical.
2.2. X-ray spectra
For consistency checks, we first derived the average temperatures of our clusters, extracting spectra from circular regions of Mpc (or smaller if such a region did not fit within the field of view). This radius encompasses most of the cluster emission. Point sources were excluded. The corresponding spectral Redistribution Matrix Files (RMF) and Auxiliary Responce Files (ARF) were generated using the A. Vikhlinin’s software and were weighted by the cluster brightness. The large quantum efficiency (QE) spatial non-uniformity caused by CTI in the data prior to Feb 2000 (with the ACIS focal plane C) was modeled using the formula from Vikhlinin (2000); for other data, the standard QE uniformity maps were used. ARFs for the ACIS-I observations also included the time- and position-independent fudge factor of 0.93 at keV to account for the backside / frontside illuminated CCD flux discrepancy in the current calibration. The time-dependent, position-independent correction for the soft absorption caused by contamination buildup (Plucinsky et al. 2003) was included in the ARFs.
Spectra were fit in the keV energy band with the MEKAL model (Kaastra 1992) by fixing the absorption column to the Galactic value (Dickey & Lockman 1990). Two exceptions are A2163 and 1E 0657–56 where it is known to be significantly different, higher for A2163 (e.g., Elbaz, Arnaud, & Böhringer, 1995) and lower for 1E 0657–56 (e.g., Liang et al. 2000). For A2163, it was fit as a free parameter, while for 1E 0657–56, the Liang et al.’s best-fit ROSAT value was used, which is in good agreement with our data.
The resulting average temperatures and abundances, at the 90% confidence, are given in Table 2 together with the extraction radii and absorption columns. All the obtained temperature are in good agreement with previously derived values found in the literature.
2.3. Temperature maps
Temperature images of the cluster central regions were derived as described in Markevitch et al. (2000a) and MV01. Specifically, we excluded point sources, extracted images in several energy bands, subtracted the background, divided the resulting images by the exposure maps, and smoothed them by a Gaussian filter with variable width (same in all bands) to get useful statistical accuracy over the interesting brightness range. A temperature in each pixel of the map was obtained by fitting values in each pixel of these images with a thermal plasma, fixing to the Galactic (or other, see above) value and the element abundance to 0.3 solar. To verify the resulting temperature maps, we fit spectra from several interesting regions of each cluster using XSPEC. The outlying areas of the temperature maps, where noise starts to dominate (usually where the errors are greater than keV), were cut off.
| Name | , | abund. | radius, | |
| keV | ′′ | cm-2 | ||
| A520 | 7.1 0.7 | 0.240.12 | 245 | 7.80 |
| A665 | 8.2 0.5 | 0.270.07 | 260 | 4.24 |
| A754 | 10.00.3 | 0.300.05 | 540 | 4.36 |
| A773 | 7.5 0.8 | 0.340.11 | 230 | 1.44 |
| A1914 | 10.90.7 | 0.240.08 | 275 | 0.95 |
| A2163 | 12.40.7 | 0.200.03 | 240 | |
| A2218 | 6.70.5 | 0.100.07 | 270 | 3.24 |
| A2319 | 10.10.4 | 0.300.05 | 540 | 7.93 |
| 1E 0657–56 | 0.250.05 | 180 | 4.60 | |
| Col. 1: Cluster name; | ||||
| Col. 2: Cluster temperature; | ||||
| Col. 3: Abundance relative to solar; | ||||
| Col. 4: Radius of the spectrum extraction region | ||||
| Col. 5: Galactic absorption column (Dickey & Lockman 1990), | ||||
| except for A2163 and 1E 0657–56, see text. | ||||
3. Results
Below we present our X-ray images and temperature maps, discuss how they elucidate the merger state and geometry, and compare them to the radio halo images. For each cluster, we present a temperature map with an X-ray and a radio contour plot overlaid, an optical image with an X-ray contour plot overlaid, and an X-ray image with a radio contour plot overlaid.
3.1. Abell 520
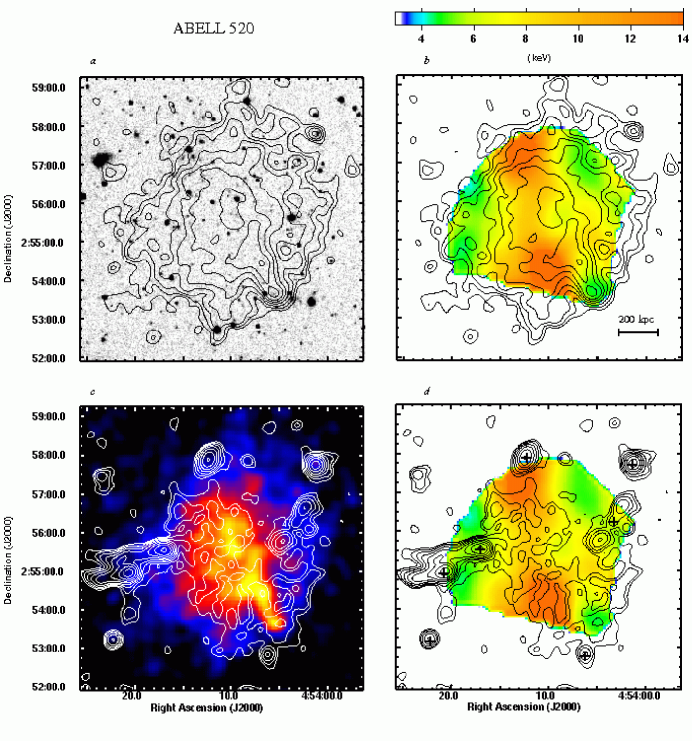
Optical spectroscopic data on A520 suggest that this cluster is undergoing strong dynamical evolution (Proust et al. 2000). A short Chandra observation (Table 1) placed this X-ray-luminous cluster in the ACIS chip I3. The X-ray observation confirms that A520 is in the middle of a merger. In Fig. 1, we compare an X-ray image and a temperature map (from M02b) derived from this Chandra observation, a VLA radio halo image at 1.4 GHz from Govoni et al. (2001a), and an optical Digitized Sky Survey (DSS)333http://archive.stsci.edu/dss plate.
The most prominent feature in the X-ray data is a dense, compact — but clearly extended — cool gas clump southwest of the center. Apparently, it has just passed straight through the main cluster from the northeast, accompanying a possible group of galaxies (although not centered on any one galaxy). The temperature map shows that the bright gas trail it has left behind is cool, and reveals a hot strip of apparently shock-heated gas along this trail. Most of the radio halo emission appears to follow this hot strip, and not the cool bright trail. The X-ray image hints at a possible bow shock in front of the dense clump, coincident with the southwest edge of the radio halo, but a longer observation (planned for late 2003) is needed to determine the nature of that feature. This cluster is one of the best examples of a spatial correlation between the radio halo brightness and the gas temperature. It is also one of only two clusters in our sample with a simple and clear merger geometry (the other being 1E 0657–56).
3.2. Abell 665
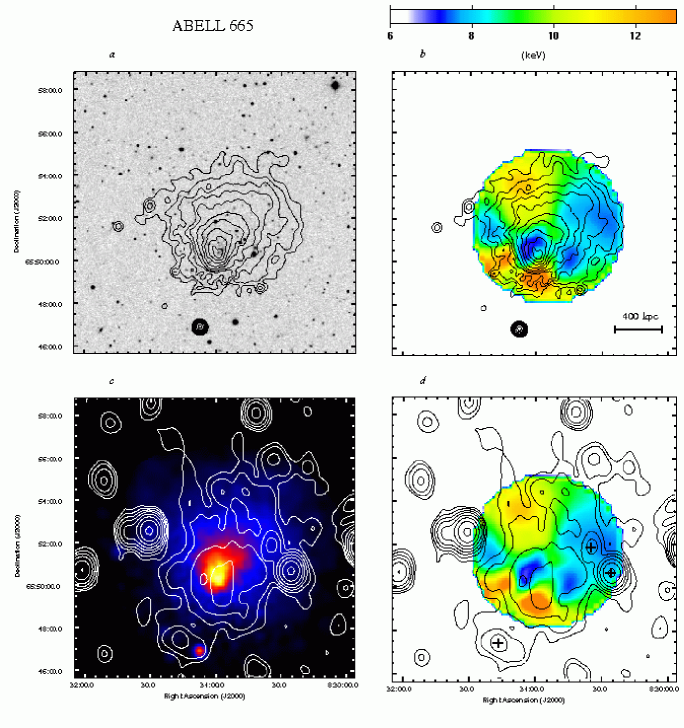
The X-ray image of A665 strongly suggests that the cluster is undergoing a merger (e.g., Jones & Saunders 1996; Gómez, Hughes, & Birkinshaw 2000). The merger apparently occurs in the direction of the elongation of the galaxy distribution (Geller & Beers 1982; Beers & Tonry 1986). Indeed, a Chandra temperature map revealed large variations and a possible shock with in the expected location (MV01). A luminous radio halo in A665 was discovered by Moffet & Birkinshaw (1989), confirmed by Jones & Saunders (1996) and further studied by Giovannini & Feretti (2000).
The cluster was observed by Chandra twice (see Table 1). Here we derive a more accurate temperature map than that presented in MV01, by including the recent longer exposure. In Fig. 2, the resulting map and an ACIS image are compared to the 1.4 GHz VLA image (Giovannini & Feretti 2000) and an optical DSS plate. The new map confirms the presence of hot — most probably shock-heated — gas south or in front of the cool core. The new image, however, still does not show any corresponding density feature as sharp as the bow shock observed in 1E 0657–56. The edge of the cool core is also not as sharp as in some other clusters, so the merger probably proceeds at an angle to the sky plane.
The X-ray brightness peak is offset from the central galaxy, indicating gas motion in the core. Indeed, the new temperature map reveals complex temperature structure inside the core as well as in its wake, including two streams (or trails) of cool gas in the NW and NE directions from the core, and a hot stream north of the core.
The radio halo is very extended and elongated in the SE-NW direction, which is the apparent merger direction and the X-ray elongation. As noted by MV01, the “leading edge” of the halo extends beyond the cool core and coincides with the shock region. MV01 presented an image of the ratio of the radio brightness to the square root of the X-ray brightness, which has the approximate meaning of the density of relativistic electrons to thermal electrons (assuming a uniform magnetic field). Its maximum coincided with the southern shock region.
3.3. Abell 754
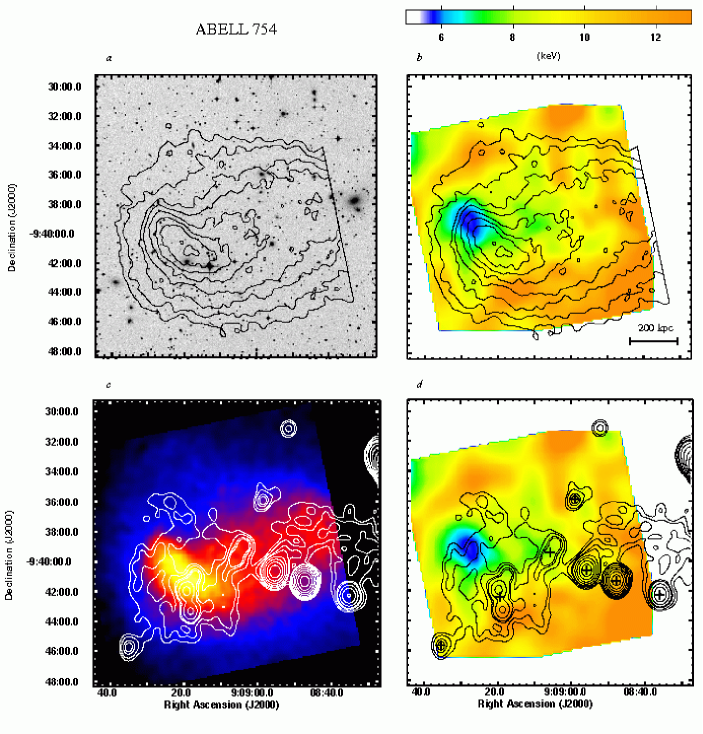
Optical and X-ray studies (e.g., Fabricant et al. 1986; Bird 1994; Slezak, Durret, & Gerbal 1994; Zabludoff & Zaritsky 1995; Henry & Briel 1995; Henriksen & Markevitch 1996; Bliton et al. 1998; De Grandi & Molendi 2001) showed that A754 is undergoing a violent merger. Markevitch et al. (2003a) noted that it is difficult to explain the complex details revealed by the Chandra X-ray image and temperature map (which we reproduce here in Fig. 3) with a simple two-cluster merger model. Krivonos et al. (2003) noted a possible weak bow shock east of the bright core in the ROSAT image; it is located approximately at the leftmost X-ray brightness contour in Fig. 3.
A radio halo in A754 was discovered by Harris, Kapahi, & Ekers (1980) and recently confirmed by Kassim et al. (2001) through radio observation at 0.3 GHz. A hard X-ray excess at keV with respect to thermal emission was also reported (Fusco-Femiano et al. 2003). The most likely explanation is inverse Compton emission from the same relativistic electrons responsible for the diffuse radio emission,
In Fig. 3, we compare the Chandra X-ray image and temperature map with a DSS optical plate and a 1.4 GHz VLA image from Bacchi et al. (2003). The radio diffuse emission is complex and very extended. Bacchi et al. (2003) noted that it consists of two large components, roughly coincident with the two main galaxy concentrations. The temperature map shows strong spatial variations, such as a large hot area in the south and southwest and cool gas at the tip of the bright tongue-like structure. This structure appears to be the remains of the core of one of the subclusters, presently flowing in the northeast direction. The eastern diffuse radio emission is located around the eastern interface between the tongue and the surrounding gas. The western radio emission extends beyond the boundary of our temperature map. That region was covered by the ASCA map (Henriksen & Markevitch 1996) which showed hot gas; more details will soon be provided by XMM (P. Henry & A. Finoguenov, private communication). Significantly, the large, hot southern region in the present map does not exhibit radio emission at the present sensitivity level.
3.4. Abell 773
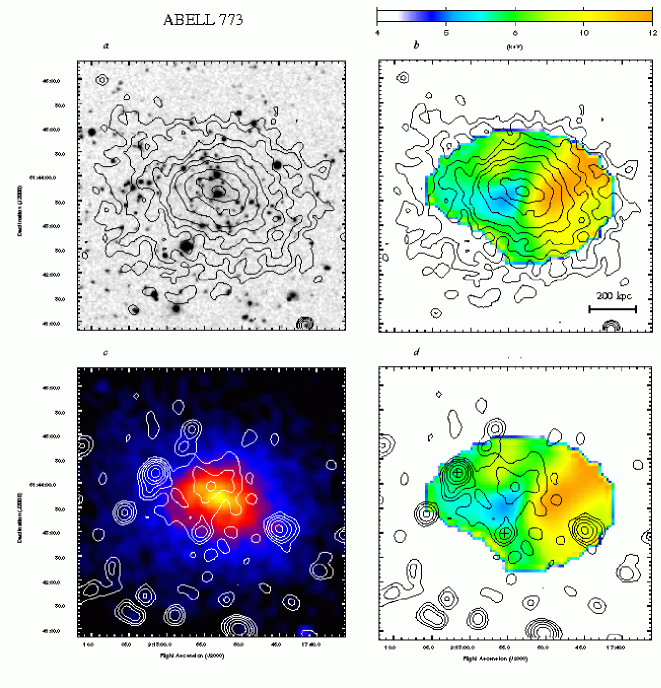
An irregular X-ray shape of A773 was noticed in the ROSAT data (e.g., Pierre & Starck 1998; Rizza et al. 1998; Govoni et al. 2001a). A radio halo in this cluster was suggested by Giovannini, Tordi, & Feretti (1999b) from the NRAO VLA Sky Survey (NVSS, Condon et al. 1998) and confirmed by Govoni et al. (2001a) through a dedicated VLA observation at 1.4 GHz. In Fig. 4, we compare this radio image with an optical DSS plate, and our temperature map and Chandra image. This is the first temperature map for A773. It reveals strong temperature variations in the keV range.
The optical image clearly shows two galaxy subclusters, one in the center of the X-ray emission and another at the eastern outskirt. Taking into account the temperature map, it appears as thought the eastern galaxy group is currently exiting the merger site, having shed its gas due to ram pressure at the entry into the main cluster at its southwest side. The collision of the gas clouds has generated a shock-heated area there, seen in the temperature map.
The radio halo does not follow the X-ray brightness, nor temperature distribution – moreover, the hottest cluster region is not at all bright in the radio (although a more sensitive, lower spatial resolution radio image shows a faint extension mostly southward; Govoni et al. 2001a). Instead, the radio halo is centered in the relatively cool region between the two galaxy subclusters.
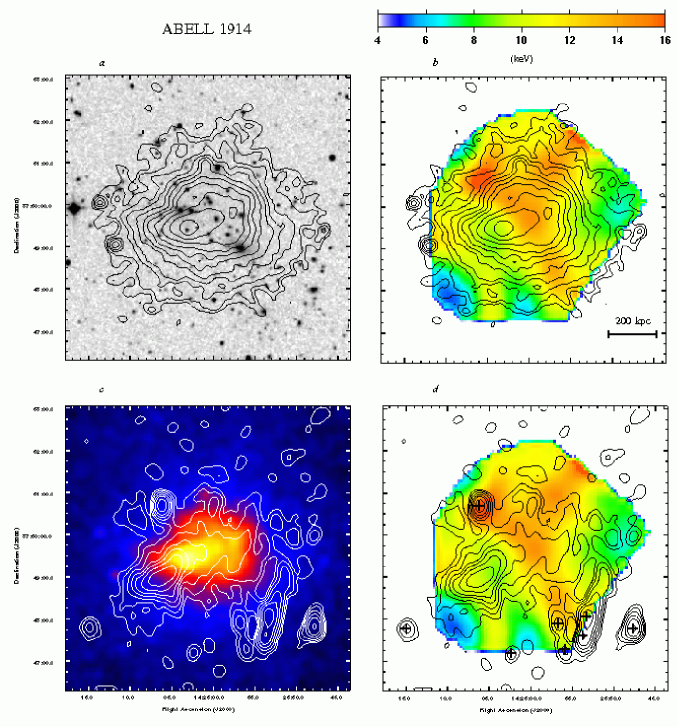
3.5. Abell 1914
The presence of a radio halo in A1914 was suggested by Giovannini et al. (1999b) from an NVSS search. It was detected by Kempner & Sarazin (2001) in the Westerbork Northern Sky Survey (WENSS) at 0.3 GHz, and confirmed by Bacchi et al. (2003) in deep VLA observations at 1.4 GHz.
A1914 was observed by Chandra twice, but because of the relatively short useful exposure of the first observation (ObsID 542), only the second one is used here. In Fig. 5, we compare the radio image from Bacchi et al. (2003) with our Chandra X-ray image and temperature map, and a DSS plate. This temperature map, the first for A1914, immediately provides a likely merger scenario, not at all obvious from the X-ray and optical images alone. In this scenario, the NE-SW arch-like hot region through the cluster center, which coincides with a distinct component in the X-ray image, is a shock between the two infalling subclusters. One of them has arrived from the southeast, where the map shows cool gas probably stripped from that subcluster. Its gas core was partly shocked and stopped by the collision around the position of the present X-ray brightness peak. This gas is currently squirting sideways along the hot arch, creating the prominent cooler elongation to the east. Its galaxies appear to have penetrated further, inside the shock-heated gas, and are now seen as a northeastern galaxy concentration. The brightest cluster galaxy was probably at the center of the other colliding subcluster, which arrived from the west. Its cooler core was left behind and is currently seen as a western cool extension, some of it possibly squirting along the western side of the shocked region, similarly to the situation on the southeastern side of the cluster. If this merger had a smaller impact parameter and occurred closer to the sky plane, we would now see a classical picture from the simulations with two subclusters just before core passage and a shocked region between them (e.g., Schindler & Müller 1993 and many later works).
The diffuse radio emission in A1914 is unusual in that it has a distinct, bright, elongated region, approximately along the presumed path traveled by the eastern subcluster. It is accompanied by a more typical, diffuse, low-brightness halo in the cluster center. The bright feature is clearly extended (Bacchi et al. 2003). It would be interesting to determine if this region is physically distinct from the rest of the halo. An upper limit on its polarization is 3% (Bacchi et al. 2003), which excludes the possibility that it is a relic projected onto the cluster center. The remaining low-brightness region of the radio halo approximately coincides with the hot central region of the X-ray cluster and may even follow the presumed streams of the gas of the two subclusters. However, a detailed comparison requires better accuracy and a removal of the radio sources in the south and the resolution of the nature of the bright feature.
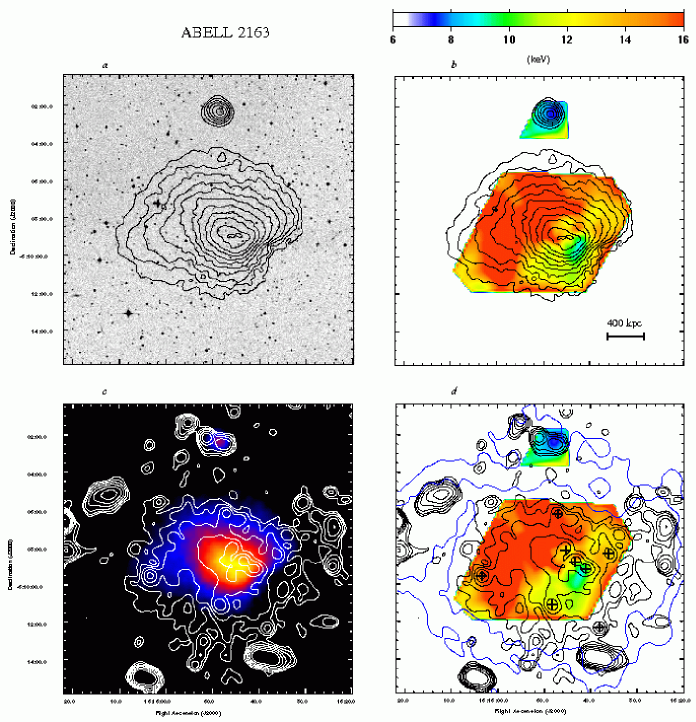
3.6. Abell 2163
A2163 is among the hottest and most X-ray luminous clusters known (e.g., Arnaud et al. 1992). The presence of an extended, powerful radio halo in A2163 was first reported by Herbig & Birkinshaw (1994). The ROSAT image (e.g., Elbaz et al. 1995), crude ASCA temperature map (Markevitch et al. 1994) and the previously published Chandra temperature map (MV01) clearly show that the cluster is a merger. However, even with the temperature map, its geometry is difficult to determine.
In Fig. 6, we present a new temperature map derived from a deeper Chandra exposure by Markevitch et al. (in preparation). It is in agreement with but more accurate than the MV01 map. The X-ray image and the new map show streams of hot and cold gas flowing in different directions, as well as a possible remnant of a cool gas core. It still does not clarify the geometry of the merger, however. This, the absence of any sharp features in the high-statistics X-ray image, and the optical spectroscopic data (Soucail et al., in preparation) all point to the possibility that the merger is occurring at a large angle to the sky plane.
The temperature map is compared with an optical DSS plate and the radio halo image from Feretti et al. (2001). The latter combines two images with different FWHM resolutions, (inner black contours) and the more sensitive (outer blue contours), respectively, to show the large extent of the radio halo. The halo extension east of center coincides with the hottest region of the cluster; however, as noted in MV01, this region also coincides with the X-ray brightness extension. In general, the halo brightness follows the distribution of the X-ray brightness quite well (Ferretti et al. 2001).
3.7. Abell 2218
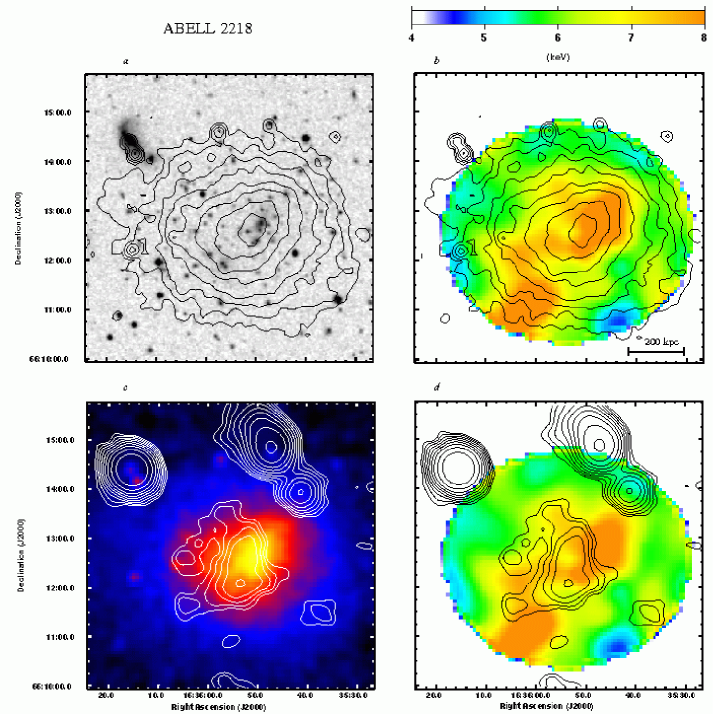
In A2218, strong and weak lensing mass reconstruction revealed two distinct mass peaks inside the cluster core, approximately around the two brightest galaxies along the NW-SE direction seen in the optical plate Fig. 7a (e.g., Abdelsalam, Saha, & Williams 1998; Squires et al. 1996; Kneib et al. 1995, 1996). ROSAT images suggested that the cluster is not relaxed (e.g., Kneib et al. 1995; Squires et al. 1996; Markevitch 1997), although at large scales, it appeared relatively symmetric.
The cluster was observed with Chandra three times. Analysis of the first two exposures was presented by Markevitch et al. (2000b) who found a central peak in the radial temperature profile, and Machacek et al. (2002) who reported an azimuthally asymmetric temperature structure in the core. Here we add a more recent, longer exposure and derive the first detailed temperature map of A2218. It is shown in Fig. 7 along with the X-ray image, a 1.4 GHz VLA image from Giovannini & Feretti (2000), and an optical DSS plate.
The map confirms the results from the earlier Chandra analyses and reveals strong asymmetric temperature variations in the keV range. Together with the relatively symmetric X-ray image, such an irregular but centrally peaked temperature map suggests that A2218 is at a later merger stage, when the violent gas motions are starting to subside, as seen, e.g., in the simulations by Roettiger, Stone, & Mushotzky (1998).
The relatively small radio halo in A2218 (Giovannini & Feretti 2000) is slightly (by about ) offset from the X-ray brightness peak and does not show a particularly strong correlation with the temperature map — in fact, the hottest spot in the cluster is not seen in the radio, as in A754 and A773. The radio image has a relatively low sensitivity, however.
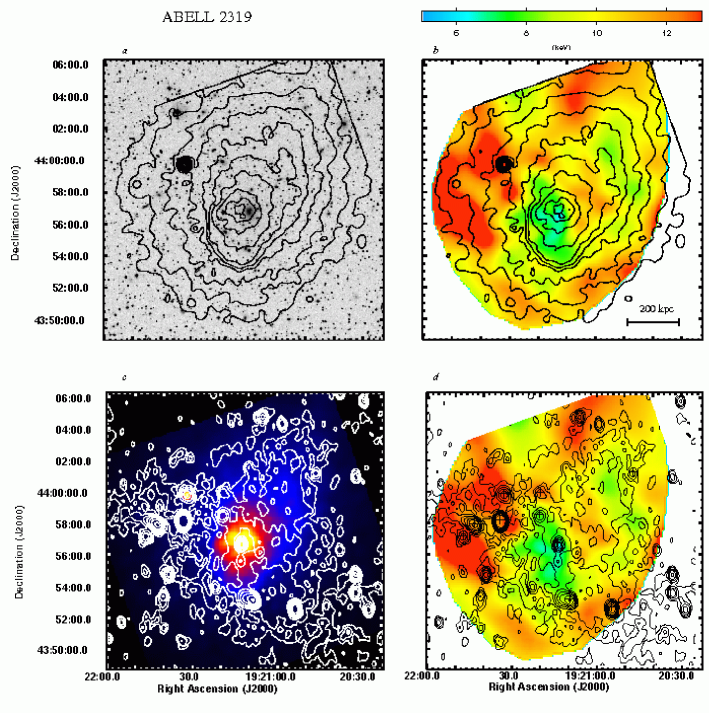
3.8. Abell 2319
Optical analyses of the bright nearby cluster A2319 (e.g., Faber & Dressler 1977, Oegerle, Hill, & Fitchett 1995, Trèvese, Cirimele, & De Simone 2000) suggested that it consists of two components superimposed along the line of sight, with a subcluster around the second-brightest galaxy projected about northwest of the cD galaxy (seen in Fig. 8a). That subcluster is seen as a cool X-ray extension in the ROSAT image and the crude ASCA temperature map (Markevitch 1996). A2319 exhibits an extended and powerful radio halo (Harris & Miley 1978) with an irregular morphology well correlated with the X-ray brightness (Feretti et al. 1997).
We use a Chandra observation of A2319 to derive the first detailed temperature map of this cluster, shown in Fig. 8 along with our X-ray image and a 1.4 GHz VLA image from Feretti et al. (1997). The most prominent feature seen in the X-ray data is a sharp cold front southeast of the cD galaxy, such as those discovered by Chandra in many other merging clusters (e.g., Markevitch et al. 2000a; Vikhlinin, Markevitch & Murray 2001). The central cool gas cloud is clearly moving southeast with respect to the ambient hotter gas (or, equivalently, the hotter gas is flowing around it to the northwest). The cD galaxy is neither at the centroid nor at the coolest spot of the cluster, suggesting that the cool gas core is moving independently of this galaxy. The cD galaxy appears to have its own gas density peak on a smaller linear scale, itself displaced eastward from the galaxy. (We note that this brightness peak falls exactly on the ACIS-I central low-exposure spot, so the apparent temperature dip there may be an artifact.) We can also see a cool arm extending around the cluster center from the tip of the cold front in the general direction of the northwestern subcluster. It may either be a tail of that subcluster, or gas stripped from the cold front cloud, unrelated to the subcluster. Overall, the picture suggests a later stage of a merger, well past the initial encounter.
The radio halo follows remarkably closely the distribution of the cool gas in the core, except for two low-brightness extensions into the hotter gas northeast and southwest of the cold front. The radio halo is more extended southwest of the X-ray brightness centroid — toward the cooler gas that we observe there.
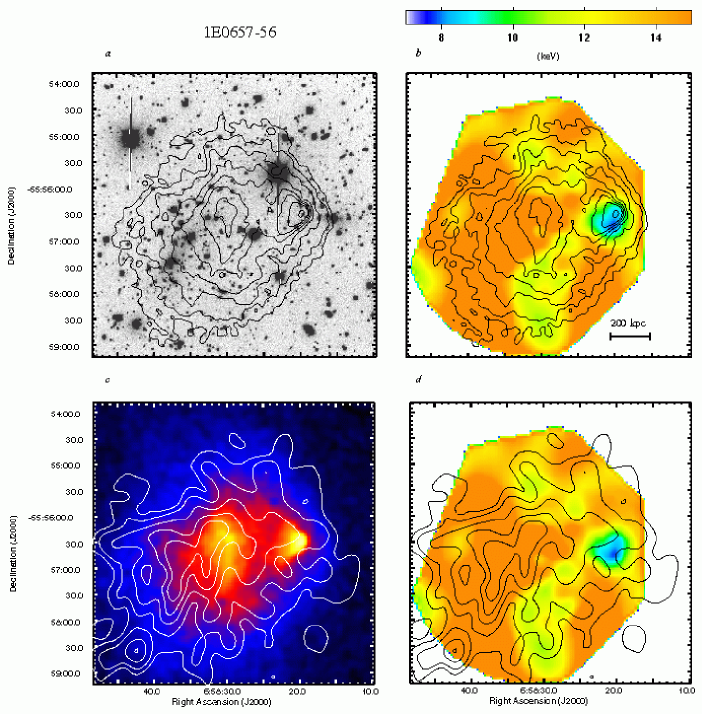
3.9. 1E 0657–56
1E 0657–56 is one of the hottest, most luminous clusters known (Tucker et al. 1998) which also contains the most luminous radio halo (Liang et al. 2000). An early Chandra observation revealed a spectacular bow shock propagating in front of a dense, cool bullet-like subcluster exiting the site of the collision with a bigger subcluster (M02a). Those authors derived an approximate temperature map of this merger and noticed that the radio halo brightness peaks at the hottest cluster region.
In Fig. 9, we compare the Liang et al. (2000) 1.3 GHz radio image with a new, more accurate temperature map obtained from a deeper Chandra exposure by Markevitch et al. (in preparation). The new map and the X-ray image suggest that the smaller subcluster has arrived at the collision site from the southeast. Most of its outer gas was shocked and stripped during the collision with a bigger subcluster (whose largest galaxies are now seen in the east). This stripped gas, together with the shocked gas from the other subcluster, form the north-south bar-like structure seen in the X-ray image, which is probably a pancake in projection. Shocks could not penetrate and stop the dense core of the subcluster, and it is now continuing to the west, preceded by a bow shock with . This subcluster should be generating vigorous turbulence in its wake.
The radio halo peak is clearly offset from the X-ray brightness peak (in the region that excludes the bullet), and instead is centered in the hottest cluster region. The halo’s eastern part is elongated along the presumed infall trajectory of the subcluster. Interestingly, the western part of the halo extends all the way to the bow shock.
4. Discussion and conclusions
Substructure in the X-ray images and the galaxy spatial and velocity distributions, as well as complex gas temperature structure, are signatures of cluster mergers. All these properties are common in clusters containing radio halos. On the other hand, we do not know of extended radio halos in relaxed clusters. Therefore, the available data suggest that radio halos are related to mergers.
From the energetic grounds, mergers can indeed dissipate enough kinetic energy — simultaneously over a megaparsec-scale volume — for the maintenance of a radio halo. However, it is not clear how exactly the relativistic particles are accelerated. In-situ acceleration (or re-acceleration) of relativistic electrons during a merger can occur in shocks (e.g. Sarazin 1999, Fujita & Sarazin 2001) or in the gas turbulence (e.g. Schlickeiser, Sievers, & Thiemann 1987; Brunetti et al. 2001; Ohno, Takizawa, & Shibata S. 2002, Fujita, Takizawa, & Sarazin 2003).
There are theoretical arguments against the shock hypothesis. Most importantly, a relatively strong shock with is believed to be necessary for generation of an observable halo (e.g., Brunetti 2002). Such high Mach numbers should be very rare, as most merger shocks should have at the cluster center. Gabici & Blasi (2003) argued that shocks expected in mergers of clusters with comparable masses are too weak to result in significant non-thermal emission (the expected Mach number increases with the mass ratio of the merging subclusters). Moreover, according to Miniati et al. (2001), such radio emission would look more like radio relics at the cluster periphery rather than as radio halos. However, physics of collisionless shocks in clusters is not well understood, and so at present even relatively weak merger shocks cannot be completely ruled out as an acceleration mechanism.
Indeed, comparison of the radio halo and gas temperature maps for a few merging clusters (MV01, M02a, M02b) hinted at their spatial correlation, which could be easily explained if electrons were accelerated in shocks. A currently propagating or just-passed merger shock would leave clear imprint in the cluster gas temperature maps in the form of hot regions. After the shock passage, regions of shock-heated gas quickly expand adiabatically and come into pressure equilibrium with the surroundings. Large-scale gas motions during the merger subsequently mix gases of different temperature, resulting in patchy temperature structure (as seen in simulations, e.g., Roettiger, Stone, & Burns (1999), Takizawa 2000, Ricker & Sarazin 2001) which persists for a considerable time in the absence of thermal conduction (Markevitch et al. 2003a). Any relativistic electrons accelerated as the shock passes through the gas, will be prevented from diffusing far from their origin by the magnetic fields (the same fields that suppress thermal conduction and diffusion of thermal electrons, e.g., Vikhlinin et al. 2001; Markevitch et al. 2003a), and will follow the bulk motion of their host gas. Thus, if relativistic electrons are accelerated by merger shocks, and assuming a uniform magnetic field (or, at least, a field uncorrelated with the gas temperature), one expects strong spatial correlation between the radio halo brightness and the hottest gas regions (in the absence of strong projection effects, of course).
On the other hand, the gas turbulence, although not directly observable at present, is expected to exist throughout the merging clusters, including shock-heated and cooler gas regions (e.g., Sunyaev, Norman & Bryan 2003). Therefore in the turbulence scenario, there should be no strong correlation between the radio brightness and the temperature.
The analysis presented here is a qualitative attempt to distinguish between the shock and turbulence acceleration mechanisms by means of a systematic comparison of radio halo maps with the temperature maps for a sample of halo clusters with good radio and X-ray data.
All clusters studied here reveal clear signs of ongoing mergers and the accompanying strong spatial temperature variations. Although in most of these clusters, the merger geometry is ambiguous and the likely projection effects complicate comparison with the radio data, we can draw several conclusions.
We confirm the previously reported spatial coincidence of bright radio features with the high temperature regions in A665, A2163, and 1E 0657–56, which was based on the shorter X-ray observations. 1E 0657–56 and A520 are the best examples of this temperature-radio connection. This spatial “coincidence” is not quite a “correlation’ — these clusters also exhibit bright radio emission from some of the cool gas regions, but in the presense of projection effects, exact correlation is not expected. As discussed by MV01, the leading edge of the “limb-brightened” (Jones & Saunders 1996) halo in A665 coincides with the apparent location of a possible relatively strong shock ahead of the fast-moving cool core. This observation appear to argue for the shock acceleration mechanism.
On the other hand, in A2319, which is at a very similar merger stage to A665, we do not detect a particularly hot, shock-heated region in front of the moving cool core, so its Mach number should be low. Yet, the cluster exhibits a radio halo whose brightest part follows rather closely the distribution of the cooler gas in the core (although at a lower brightness level, the halo’s NE-SW extension appears to coincide with the outlying hotter regions).
Moreover, in A754 and A773, the hottest cluster regions do not show radio emission, at least at the present sensitivity, while there is radio emission elsewhere in these clusters. The same appears true for the small halo in A2218, although the sensitivity of the radio data here is poor. While radio emission from cooler areas can be explained by projection effects, given that the X-ray-derived projected temperature is biased toward the denser, cooler gas on the line of sight, projection cannot explain the absence of the radio emission from the hottest cluster regions. We believe that this is a strong observational argument against merger shocks, at least the relatively weak ones expected in most mergers, as the main acceleration mechanism.
This leaves turbulence as a more viable mechanism. Indeed, all clusters in our sample where the merger geometry is tractable — 1E 0657–56, A520, A2319, and A665 — exhibit relatively small, dense, cool moving clouds which are likely to generate turbulence in their wake. The radio halos are observed along the path of these moving clouds. In A754, the eastern halo lies along the bright cool X-ray tongue, which is likely to be the flow of dense gas possibly generating turbulence at its interface. In A773, the passage of the eastern mass peak through the gas of the main subcluster may also generate turbulence in the bright radio area. The remaining clusters have sufficiently uncertain merger geometries to be consistent with the possibility of strong turbulence in the right regions.
However, with turbulence alone, it is difficult to explain the observed extension of the radio halo in 1E 0657–56 ahead of the gas bullet all the way to the bow shock, a similar extension into the shock region ahead of the core in A665, and possibly in A520. Turbulence caused by these cores cannot precede the fast-moving core, especially in such a high-velocity merger as 1E 0657–56. Thus, in systems like these, at least some of the relativistic electrons should be accelerated in shocks. Incidentally, 1E 0657–56 has a shock with the highest-known Mach number (, M02a) and A665 appears to contain a relatively high- shock as well (, MV01).
We conclude that in most clusters, the radio halo electrons are probably accelerated by turbulence, but in those rare cases when shocks with are present, these shocks also appear to contribute in the acceleration. In this regard, we note that Kempner & David (2003) performed a similar radio–X-ray comparison for another halo cluster, A2744, and concluded that both turbulence and shock acceleration may be present in that cluster.
In conclusion, we note that maps of the spectral index of the radio halo emission would be invaluable for pinpointing the electron acceleration sites (because the halo spectrum steepens as the relativistic electrons lose energy). Such data would be especially illuminating in clusters such as 1E 0657–56, A665 (Feretti et al., in preparation), and A520, where both turbulence and shocks are likely to be present and can be separated spatially. Also, for these clusters, higher-resolution halo images are required to determine if the front edges of the halos indeed coincide with the shock fronts.
References
- (1) Abdelsalam, H. M., Saha, P., & Williams, L. L. R., 1998, AJ, 116, 1541
- (2) Arnaud M., Hughes J.P., Forman W., Jones C., Lachieze-Rey M., Yamashita K., & Hatsukade I., 1992, ApJ 390, 345
- (3) Bacchi, M., Feretti, L., Giovannini, G., & Govoni, F., 2003, A&A, 400, 465
- (4) Beers, T. C., & Tonry, J. L., 1986, ApJ, 300, 557
- (5) Bird C.M., 1994, AJ 107, 1637
- (6) Bliton M., Rizza E., Burns J.O., Owen F.N., & Ledlow M.J., 1998, MNRAS 301, 609
- (7) Brunetti, G., Setti, G., Feretti, L., & Giovannini, G., 2001, MNRAS, 320, 365
- (8) Brunetti G., 2002, Proc. “Matter and Energy in Clusters of Galaxies”, Taiwan, ASP Conf. Series, eds. S. Bowyer & C.-Y. Hwang, in press (astro-ph/0208074)
- (9) Buote, D. A., 2001, ApJ, 553, L15
- (10) Colafrancesco S., 1999, Proc. Ringberg workshop on Diffuse Thermal and Relativistic Plasma in Galaxy Clusters, ed. H. Böhringer, L. Feretti, & P. Schuecker, MPE report 271, 269
- (11) Condon, J. J., et al. 1998, AJ 115, 1693
- (12) De Grandi S., & Molendi S., 2001, ApJ 551, 153
- (13) Dickey J.M., & Lockman F.J., 1990, ARA&A, 28, 215
- (14) Elbaz D., Arnaud M., & Böhringer H., 1995, A&A 293, 337
- (15) Enßlin T.A., 1999, in The Universe at low radio frequencies, Symp. IAU 199, Pune (India), in press, (astro-ph/0001433)
- (16) Faber, S. M. & Dressler, A., 1977, AJ, 82, 187
- (17) Fabricant D., Beers T.C., Geller M.J., Gorenstein P., Huchra J.P., & Kurtz M.J., 1986, ApJ 308, 530
- (18) Feretti L., Giovannini G., & Böhringer H., 1997, New Astronomy, 2, 501
- (19) Feretti L., 1999, in The Universe at low radio frequencies, Symp. IAU 199, Pune (India), in press (astro-ph/0006379)
- (20) Feretti L., Fusco-Femiano R., Giovannini G., & Govoni F., 2001, A&A, 373, 106
- (21) Feretti L., 2003, XXI Texas Symposium on Relativistic Astrophysics , Florence, Italy (astro-ph/0309221)
- (22) Fujita, Y. & Sarazin, C. L., 2001, ApJ, 563, 660
- (23) Fujita, Y., Takizawa, M., & Sarazin, C. L., 2003, ApJ, 584, 190
- (24) Fusco-Femiano, R., Orlandini, M., De Grandi, S., Molendi, S., Feretti, L., Giovannini, G., Bacchi, M., & Govoni, F., 2003, A&A 398, 441
- (25) Gabici, S. & Blasi, P., 2003, ApJ, 583, 695
- (26) Geller, M. J., & Beers, T. C., 1982, PASP, 94, 421
- (27) Giovannini, G., Feretti, L., & Govoni, F., 1999a, in The Universe at low radio frequencies, Symp. IAU 199, Pune, in press, (astro-ph/0006380)
- (28) Giovannini, G., Tordi, M., & Feretti, L., 1999b, New Ast. 4, 141
- (29) Giovannini, G., & Feretti, L., 2000, New Astronomy, 5, 335
- (30) Gómez, P. L., Hughes, J. P., & Birkinshaw, M., 2000, ApJ, 540, 726
- (31) Govoni, F., Feretti, L., Giovannini, G., Böhringer, H., Reiprich, T.H., & Murgia, M., 2001a, A&A, 376, 803
- (32) Govoni, F., Enßlin, T. A., Feretti, L., & Giovannini, G., 2001b, A&A, 369, 441
- (33) Harris, D. E. & Miley, G. K., 1978, A&AS, 34, 117
- (34) Harris, D.E., Kapahi, V.K., & Ekers, R.D., 1980, A&AS, 39, 215
- (35) Henriksen, M.J., & Markevitch M.L., 1996, ApJ, 466, L79
- (36) Henry J.P., & Briel U.G., 1995, ApJ, 443, L9
- (37) Herbig T., & Birkinshaw M., 1994, BAAS, 26, 1403
- (38) Kaastra, J. S., 1992, “An X-Ray Spectral Code for Optically Thin Plasmas” (Internal SRON-Leiden Report, updated version 2.0)
- (39) Kassim, N. E., Clarke, T. E., Enßlin, T. A., Cohen, A. S., & Neumann, D. M., 2001, ApJ, 559, 785
- (40) Kempner, J. C., Blanton, E. L., Clarke, T. E., Enßlin, T., Johnston-Hollitt, M., & Rudnick, L., 2003, Proc. “The Riddle of Cooling Flows in Galaxies and Clusters of Galaxies”, eds. T. H. Reiprich, J. C. Kempner, & N. Soker (astro-ph/0310263)
- (41) Kempner, J. C., & David, L. P., 2003, MNRAS, submitted (astro-ph/0310185)
- (42) Kempner J.C., Sarazin C.L., 2001, ApJ, 548, 639
- (43) Krivonos, R. A., Vikhlinin, A. A., Markevitch, M. L., & Pavlinsky, M. N., 2003, Astronomy Letters, 29, 425
- (44) Kneib J.P., Mellier Y., Pello R., Miralda-Escude J., Le Borgne J.-F., Böhringer H., & Picat J.-P., 1995, A&A, 303, 27
- (45) Kneib, J. P., Ellis, R. S., Smail, I., Couch, W. J., & Sharples, R. M. 1996, ApJ, 471, 643
- (46) Liang, H., Hunstead, R.W., Birkinshaw, M., & Andreani, P., 2000, ApJ 544, 686
- (47) Machacek, M.E., Bautz, M.W., Canizares, C., & Garmire, G.P., 2002, ApJ 567, 188
- (48) Markevitch, M., Yamashita, K., Furuzawa, A., & Tawara, Y., 1994, ApJ, 436, L71
- (49) Markevitch, M., 1996, ApJ, 465, L1
- (50) Markevitch, M., 1997, ApJ, 483, L17
- (51) Markevitch, M., et al., 2000a, ApJ, 541, 542
- (52) Markevitch, M., Vikhlinin, A., Mazzotta, P., & VanSpeybroeck, L., 2000b, Proc. “X-ray astronomy 2000”, Palermo, September 2000, eds. R. Giacconi, L. Stella, S. Serio, ASP Conf. Ser., 234, CDROM (astro-ph/0012215)
- (53) Markevitch, M., & Vikhlinin, A., 2001, ApJ 563, 95 (MV01)
- (54) Markevitch, M., Gonzalez, A. H., David, L., Vikhlinin, A., Murray, S., Forman, W., Jones, C., & Tucker, W., 2002a, ApJ 567, L27 (M02a)
- (55) Markevitch, M., Vikhlinin, A., & Forman, W. R., 2002b, Proc. “Matter and Energy in Clusters of Galaxies”, Taiwan, ASP Conf. Series, eds. S. Bowyer & C.-Y. Hwang, 301, 37 (M02b), (astro-ph/0208208)
- (56) Markevitch, M., et al., 2003a, ApJ, 586, L19
- (57) Markevitch, M., et al., 2003b, ApJ 583, 70
- (58) Miniati, F., Jones, T. W., Kang, H., & Ryu, D. 2001, ApJ, 562, 233
- (59) Moffet, A. T. & Birkinshaw, M., 1989, AJ, 98, 1148
- (60) Oegerle, W. R., Hill, J. M., & Fitchett, M. J., 1995, AJ, 110, 32
- (61) O’Hara, T. B., Mohr, J. J., & Guerrero, M. A. 2004, ApJ, submitted (astro-ph/0311402)
- (62) Ohno, H., Takizawa, M., & Shibata, S. 2002, ApJ, 577, 658
- (63) Petrosian, V., 2002, Proc. “Matter and Energy in Clusters of Galaxies”, ASP Conf. Series, eds. S. Bowyer & C.-Y. Hwang, in press, (astro-ph/0207481)
- (64) Pierre, M.,& Starck, J.L., 1998, A&A 330, 801
- (65) Plucinsky, P. P., et al., 2003, Proc. SPIE, 4851, 89
- (66) Proust, D., et al., 2000, A&A 355, 443
- (67) Jones, M., & Saunders, R., 1996, in Röntgenstrahlung from the Universe, ed. H. U. Zimmermann et al. (MPE Report 263), 553
- (68) Ricker, P. M. & Sarazin, C. L., 2001, ApJ, 561, 621
- (69) Rizza, E., Burns, J.O., Ledlow, M.J., Owen, F.N., Voges, W., & Bliton, M., 1998, MNRAS, 301, 328
- (70) Roettiger, K., Stone, J. M., & Mushotzky, R. F., 1998, ApJ 493, 62
- (71) Roettiger, K., Stone, J. M., & Burns, J. O. 1999, ApJ, 518, 594
- (72) Sarazin, C. L., 1999, ApJ, 520, 529
- (73) Sarazin, C.L., 2001, in “Merging Processes in Clusters of Galaxies”, edited by L. Feretti, I. M. Gioia, and G. Giovannini, in press, (astro-ph/0105418)
- (74) Schlickeiser, R., Sievers, A., & Thiemann, H., 1987, A&A, 182, 21
- (75) Schindler, S., & Müller, E., 1993, A&A, 272, 137
- (76) Slezak, E., Durret, F., & Gerbal, D., 1994, AJ, 108, 1996
- (77) Snowden, S. L., et al., 1997, ApJ, 485, 125
- (78) Squires G., et al., 1996, ApJ, 461, 572
- (79) Struble, M.F., & Rood, H., 1999, ApJ, 125, 35
- (80) Sunyaev, R.A., Norman, M.L., & Bryan, G.L., 2003, Astronomy Letters, in press, (astro-ph/0310041)
- (81) Takizawa, M., 2000, ApJ, 532, 183
- (82) Trèvese, D., Cirimele, G., & De Simone, M., 2000, ApJ, 530, 680
- (83) Tucker, W., et al., 1998, ApJ, 496, L5
- (84) Vikhlinin, A., 2000, Chandra calibration memo, http://asc.harvard.edu/cal/Links/Acis/acis/Cal-prods/qe/12-01-00
- (85) Vikhlinin, A., 2001, Chandra calibration memo, http://asc.harvard.edu/cal/,”ACIS”, “ACIS Background”, “VF mode”
- (86) Vikhlinin, A., Markevitch, M., & Murray, S. S., 2001, ApJ, 551, 160
- (87) Zabludoff, A.I., & Zaritsky, D., 1995, ApJ, 447, L21