The nature of the Ly-emission region of FDF-4691 ††thanks: Based on observations obtained at the ESO VLT at Cerro Paranal, Chile.
In order to study the origin of the strong Ly emission of high-redshift starburst galaxies we observed and modeled the emission of the galaxy FDF-4691 (rest-frame = 103 Å). The observations show that FDF-4691 is a young starburst galaxy with a (for this redshift) typical metallicity. The broad, double-peaked profile of the Ly emission line can be explained assuming a highly turbulent emission region in the inner part of the starburst galaxy, and a surrounding extended shell of low-density neutral gas with a normal dust/gas ratio and with Galactic dust properties. The detection of the Ly emission line is explained by the intrinsic broad Ly emission and a low HI column density of the neutral shell. A low dust/gas ratio in the neutral shell is not needed to explain the strong Ly line.
Key Words.:
galaxies: high redshift – galaxies: starburst – line: formation – galaxies: ISM1 Introduction
In all star-forming galaxies Ly photons are produced by recombination in HII regions ionized by young stars. However, these Ly photons are resonance scattered and thus have a large optical path in a neutral gas where they can be absorbed by dust grains (see e.g. Neufeld neufeld (1990)). This may explain the absence of Ly emission from many local and medium-redshift starburst galaxies (Charlot & Fall charlot (1993)). On the other hand, Ly emission is often the most conspicuous feature of the spectra of high-redshift galaxies. In fact, Ly emission is one of the most efficient tools to detect and identify high-redshift galaxies (e.g. Rhoads et al. rhoads (2000); Hu et al. hu (1999)). Of 25 galaxies with discussed by Taniguchi et al. (taniguchi (2003)), all but two show strong Ly emission. Moreover, in short exposure spectra of high-redshift galaxies often no continuum is detected, while the Ly emission line is conspicuously present. Kudritzki et al. (kudritzki (2000)) argued that such galaxies must have a very low dust content. However, as noted by Kunth et al. (kunth (1998)) a higher escape probability of Ly photons could also be caused by a suitable velocity field, which reduces the number of resonance scattering events.
In order to clarify the cause of the strong Ly emission of high-redshift galaxies, we observed the Ly emission line galaxy FDF-4691 (from the catalog of Heidt et al. heidt (2003)) at low and medium spectral resolution. Moreover, we carried out radiative transfer model computations to reproduce the observed complex Ly line profile and to constrain the velocity fields and physical conditions of the Ly emitting volume. Throughout this letter we adopt = 0.7, = 0.3 and H0 = 70 km s-1Mpc-1.
2 Observations and data reduction
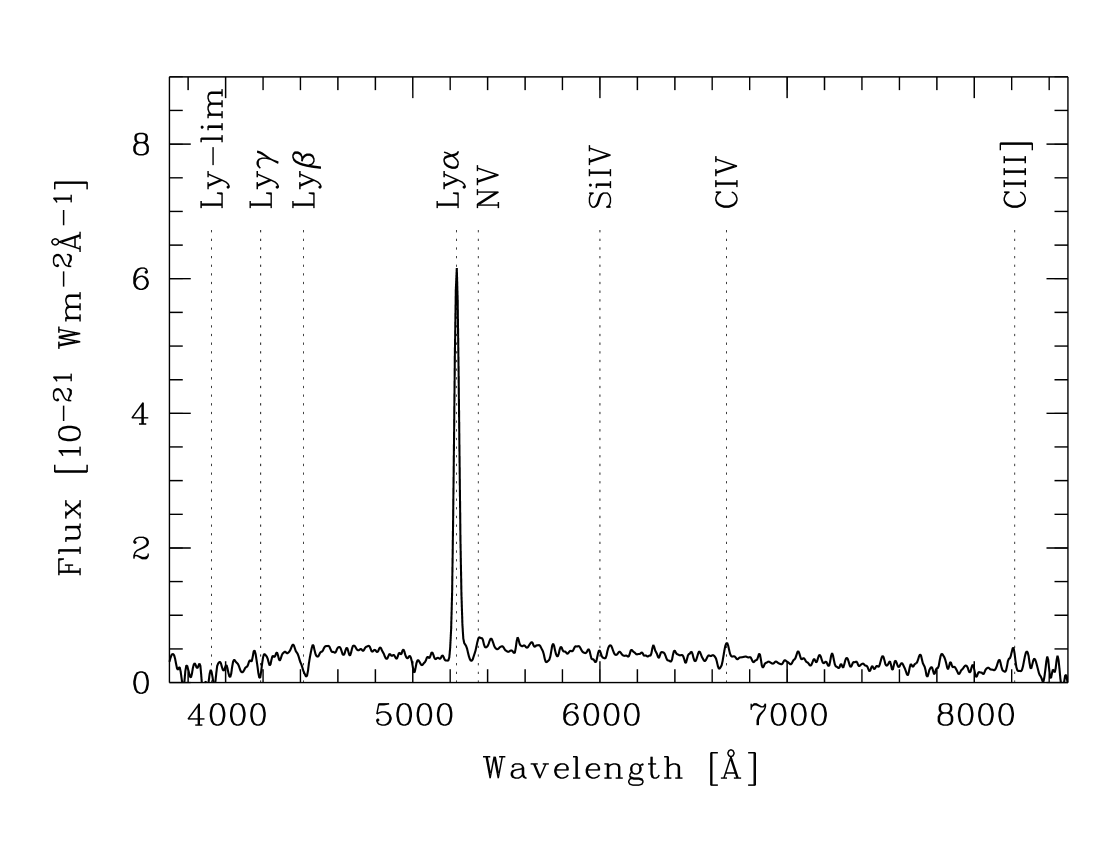
The low-resolution spectrum () of FDF-4691 (Figs. 1 and 2) has been taken from the atlas of Noll et al. (noll (2004)), where the observational details are described. It is based on a total integration time of 550 min and has a continuum SNR of about 7 between 4000 and 8000 Å.
Medium-resolution spectroscopic observations of FDF-4691 were obtained in August 2002 in service mode, together with other objects. 8 exposures with 47 min integration time each were taken using FORS2 and the 1400V grism resulting in a total integration time of 6.25 h. The co-added spectrum covers the range from 4500 to 6100 Å and has a resolution of 2000 ( 150 km s-1). The spectra were reduced using MIDAS. Since FDF-4691 is relatively faint ( mag), the continuum SNR of the medium resolution spectrum is 3 throughout the observed spectral range. Hence this spectrum provides little additional information on the absorption features.
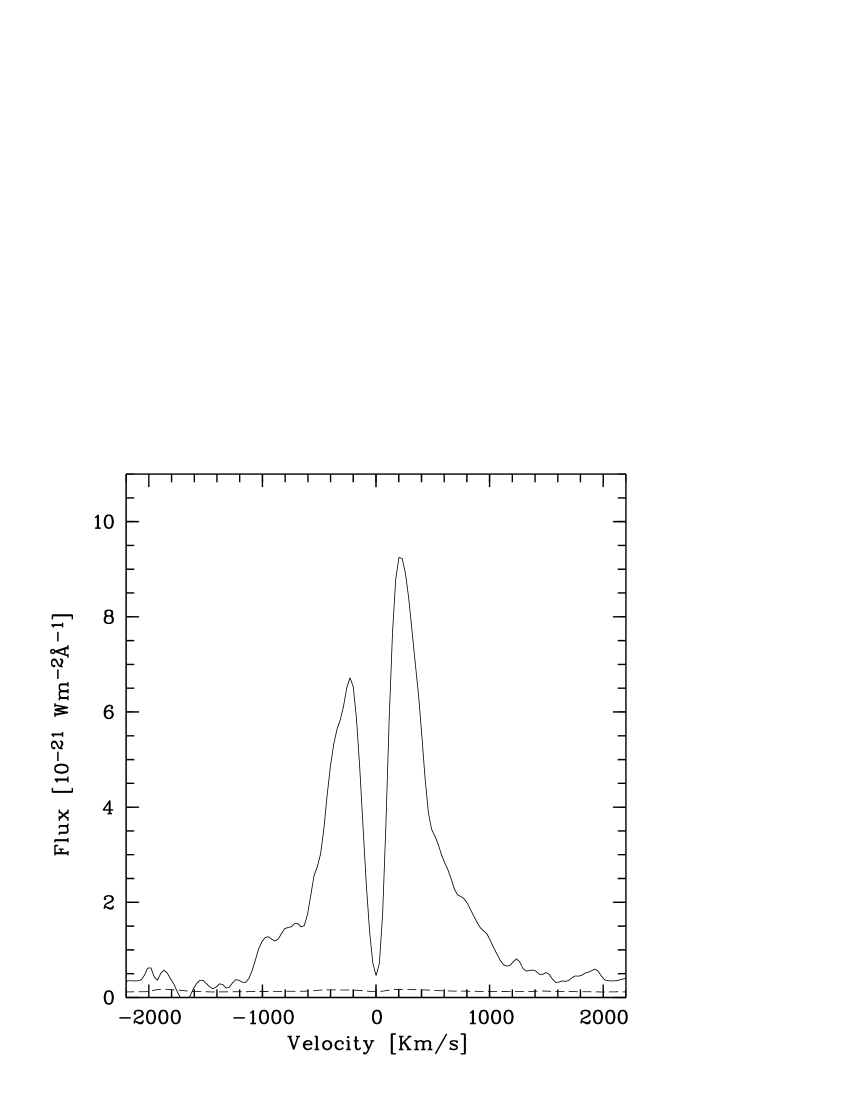
A much better SNR ( 60) was reached for the Ly emission line profile. Fig. 3 shows the observed profile. The abscissa gives the radial velocity relative to the central absorption component (which corresponds to a redshift of ).
3 Results
3.1 Basic observed properties
Apart from the exceptionally strong Ly line the low-resolution spectrum (Fig. 1) shows a for this redshift normal starburst spectrum. The continuum break at the wavelength of Ly is caused by absorption of the Ly forest. The UV luminosity at 1500 Å is = 1.63 0.06 1034 W Å-1, which is typical for galaxies between z = 3 and z = 4 in the FDF spectroscopic survey (Noll et al. 2004). The rest-frame Ly equivalent width is 103 15 Å, while the line flux amounts to W m-2. These are only lower limits since Ly photons are more affected by dust than the surrounding continuum. The Ly luminosity is W, if the emission is isotropic.
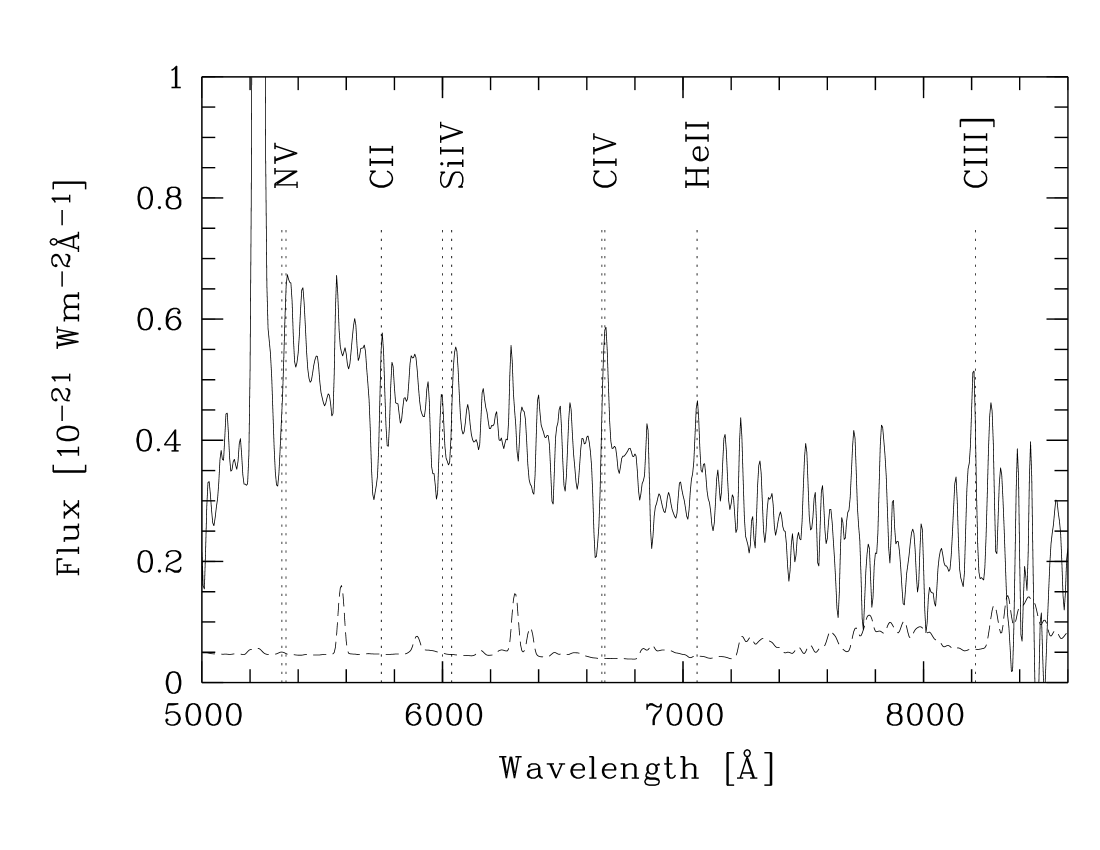
As shown by Fig. 2 at least three prominent stellar wind lines are detected: NV 1239, 1243 and CIV 1548, 1551 show P Cygni profiles and SiV 1394, 1403 is mainly in absorption. HeII 1640 (total flux 5.3 1.6 10-21 W m-2) and CIII] 1909 (total flux 8.8 2.0 10-21 W m-2) appear in emission. A strong absorption ( ) blue-wards from the indicated position of CII 1335 is discussed in Section 3.3.
3.2 AGN or starburst?
Our Ly profile ( km s-1) differs from Ly profiles of high-redshift galaxies observed by, e.g., Dawson et al. (dawson (2002)), which show narrower, asymmetric profiles with km s-1 with a sharp blue cut-off and a red wing. On the other hand, van Ojik et al. (ojik (1997)) found for high-redshift radio galaxies symmetric Ly profiles with line widths of the order of km s-1. As some of these profiles have the same line widths and similar profiles as FDF-4691, one might suspect that the Ly line of FDF-4691 is excited by an AGN.
However, the hard radiation field of an AGN would be expected to result in NV / Ly, CIV / Ly and CIII] 1909 / Ly line ratios which are not observed. For example, the observed CIV / Ly = 0.025 is ten times smaller than the ratio in the composite spectra of AGNs (CIV / Ly = 0.25, Osterbrock osterbrock (1989)).
Moreover radio observations of the FDF have shown that at 1.4 GHz no radio source 100 Jy is present at the position of FDF-4691 (Wagner 2003, private communication).
Therefore, we conclude that the Ly emission of FDF-4691 is excited by the continuum radiation of the hot stars of this galaxy.
3.3 Comparsion with STARBURST99 models
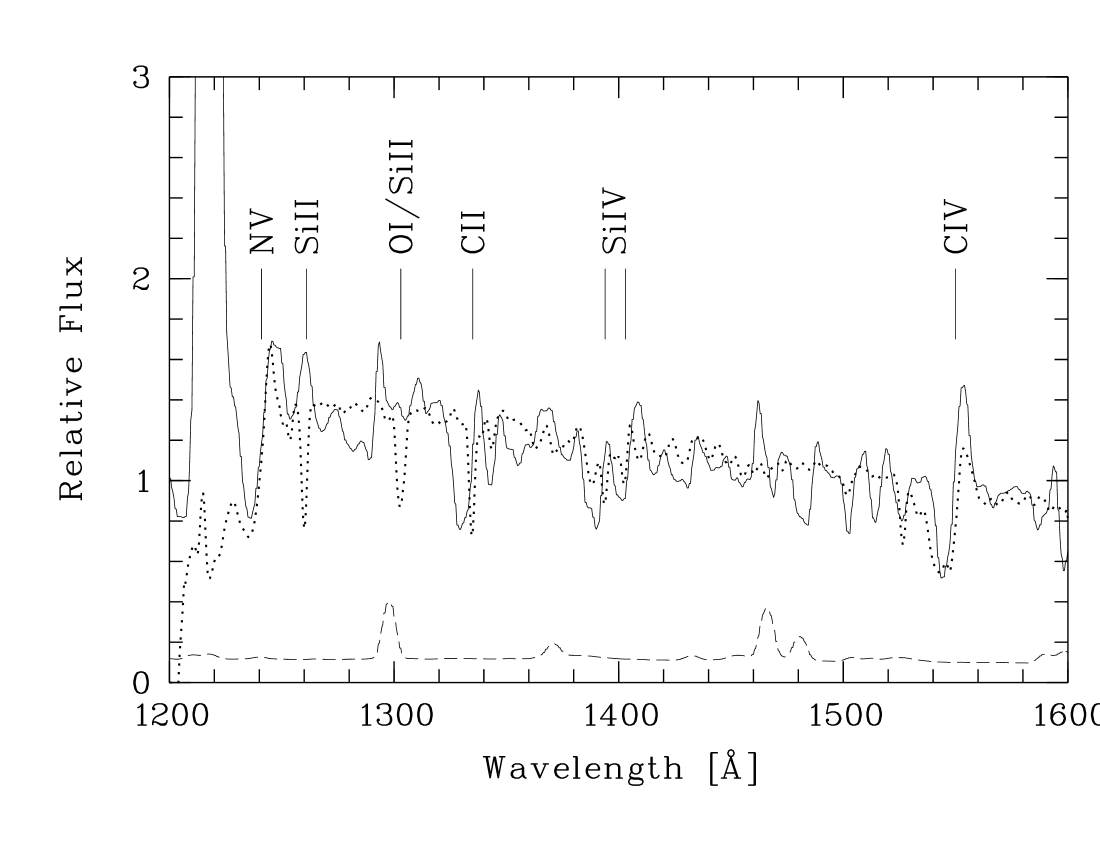
In order to constrain the starburst age and metallicity of FDF-4691 we compared our spectrum with STARBURST99 models (Leitherer et al. leitherer (1999)), assuming a Calzetti et al. (calzetti (2000)) reddening curve. The best fit for the UV slope and the profiles of the stellar wind lines was found for continuous star-formation, low starburst age ( 20 Myr), LMC/SMC metallicity, a non-Salpeter IMF of and mag (Fig. 4). The metallicity derived from the CIV absorption equivalent width ( ) using the calibration given in Mehlert et al. (mehlert (2002)) is also in agreement with the LMC/SMC value. This metallicity is normal for this redshift (Mehlert et al. mehlert (2002)). The reddening of mag is among the lowest observed in this redshift range in the FDF spectroscopic survey. Note that this value depends on the reddening curve used. The steeper extinction law of the SMC (Bouchet et al. bouchet (1985)) would yield mag. The low reddening is not unexpected in view of the anticorrelation between the strength of the Ly line and the reddening as derived from the UV continuum slope found by Shapley et al. (shapley (2003)). But deriving all the parameters mentioned above from UV data alone is not very constraining. Other combinations also provide good fits, including models with an instantaneous starburst and a very young age ( 5 Myr).
The CIV 1548, 1551 emission component is stronger in FDF-4691 than in the model. This may indicate the presence of early O stars or Wolf-Rayet stars, which are known to show such CIV profiles (Wu et al. wu (1983); Walborn & Panek walborn (1984); Willis & Garmany willis (1989)). The fact that the low-ionisation interstellar lines (SiII 1260, OI/SiII 1303, CII 1335), visible in the STARBURST99 model, are not present in FDF-4691, is again consistent with the correlation found by Shapley et al. (shapley (2003)) between the reddening and the strength of the interstellar absorption lines. The presence of the strong CII 1335 line (blue-shifted by 1400 kms-1 in respect to the Ly line) may be explained by the presence of WC stars in FDF-4691, which tend to show strong blue-shifted CII 1335 lines (Willis & Garmany willis (1989)). WC stars may also provide an explanation for the strength of the HeII and CIII] emission. The presence of very young stars and WR stars together with the large equivalent width of Ly indicate that the starburst is very young ( Myr).
The star-formation rate of FDF-4691 was obtained from the Ly luminosity ( M⊙ yr-1) and from the UV luminosity ( M⊙ yr-1). In both cases we used the calibration given in Kennicutt (kennicutt (1998)). The agreement indicates that Ly is not significantly attenuated relative to the continuum.
4 Comparison with line profile models
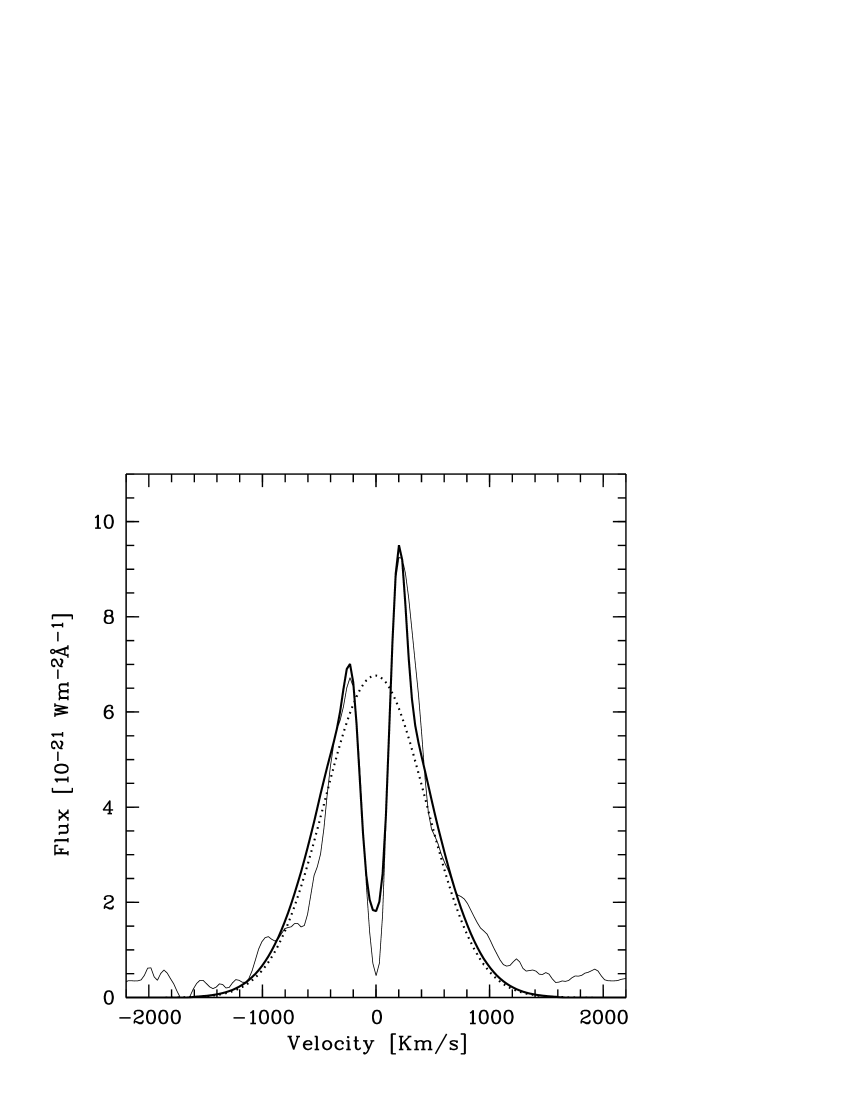
In order to constrain the physical properties of the Ly emitting volumes of FDF-4691 we calculated model profiles using the finite element line formation code of Richling and Meinköhn (Richling et al. richling (2001); Meinköhn & Richling meinkoehn (2002)), which is particularly well suited for calculating the radiative transfer in a non-static scattering medium. Since the width and the shape of the lower part of the observed line profile is best explained by the emission of (high-velocity) turbulent H II regions, while the narrow central absorption can be produced only in a low-velocity H I layer in front of the emission region, we assumed a spherical two-component model with a central line emission region surrounded by a shell of neutral HI gas. Configurations of this type have been suggested and investigated earlier by Tenorio-Tagle et al. (tenoriotagle (1999)), Ahn et al. (ahna (2001), ahnb (2003)) and Mas-Hesse et al. (mashesse (2003)). For the emission from the central region we assumed a broad Gaussian Ly emission profile. This assumption seems reasonable in view of the expected supernova rate and stellar wind activity in the observed compact starburst region. The turbulent velocity of the central source was adjusted to fit the outer wings of the observed profile which are not affected by the low-velocity gas of the shell.
The computed model profile fitting the observed profile best is reproduced in Fig. 5. The theoretical model was convolved with the instrumental profile. The parameters for this model are turbulence velocities of about 600 km s-1 in the emission region, of 63 km s-1 in the scattering shell, and an outflow velocity of the shell of 12 km s-1. The central HI column density of the shell was cm-2, corresponding to an optical depth of the shell in the line center of .
In the model described above the central absorption of the line profile is produced by the removal of Ly photons from the line center by multiple resonance scattering. Without dust absorption the resonance scattering redistributes all these photons in velocity space to produce the blue and and red peaks framing the central absorption. Calculations with Galactic dust/gas ratio and Galactic dust properties and without dust in the neutral shell showed that with the model parameters given above the dust in the shell had no detectable effect on the line profile. Dust in the central emission region, if not destroyed by the strong radiation field, only reduces the total emission without modifying the profile.
In this model the strong Ly emission line is caused by an intrinsic broad Ly line, allowing a high fraction of Ly photons to escape unaffected by the neutral shell, and a low column density of the neutral shell. Note that with Galactic dust/gas ratio the amount of dust in the shell is very low.
Since the shell turbulence velocity appears too high with respect to the velocity of sound in (mainly) neutral interstellar matter and the rest intensity at the line center is somewhat to high in our model, we expect that we underestimated the neutral column density. A higher neutral column density would increase the separation between the two peaks, allowing to reproduce a similar model as in Fig. 5 with lower shell turbulence velocity. Unfortunately, at present, our code cannot handle much higher optical depths.
Additional model calculations with an increased dust/gas ratio and analytical models (Neufeld neufeld (1990)) suggest that a up to 100 higher column density of the neutral shell with Galactic dust/gas ratio will not result in a significant reduction of Ly photons in the shell. At higher neutral column densities the destruction of Ly photons will become important.
5 Conclusion
Our observations have shown that the Ly galaxy FDF-4691 is a young starburst galaxy with a (for this redshift) normal metallicity and a modest amount of reddening. The Ly flux of the galaxy appears not significantly more attenuated by dust absorption than the UV continuum. According to our models the observed line profile can be explained assuming that a turbulence-produced broad profile of a central emission region is modified by frequency redistribution in a resonance scattering neutral shell around the central H II region. Although the model fit does not constrain the physical parameters of the model well (and the model may be much too simplistic), the computations demonstrate that the detection of the high Ly flux is caused by a low neutral column density and an intrinsic broad emission line. A low dust/gas ratio in the neutral shell is not needed to explain the strong Ly line.
Acknowledgements.
We are grateful to the referee for helpful comments. Our research has been supported by the German Science Foundation DFG (SFB 439).References
- (1) Ahn, S.-H., Lee, H.-W., & Lee, H. M. 2001, ApJ, 554, 604
- (2) Ahn, S.-H., Lee, H.-W., & Lee, H. M. 2003, MNRAS, 340, 863
- (3) Bouchet, P., Lequeux, J., Maurice, E., et al. 1985, A&A, 149, 330
- (4) Calzetti, D., Armus, L., Bohlin, R. C., et al. 2000, ApJ, 533, 682
- (5) Charlot, S., & Fall, S. M. 1993, ApJ, 415, 580
- (6) Dawson, S., Spinrad, H., Stern, D., et al. 2002, ApJ, 570, 92
- (7) Heidt, J., Appenzeller, I., Gabasch, A., et al. 2003, A&A, 398, 49
- (8) Hu, E. M., McMahon, R.G., & Cowie, L.L. 1999, ApJ, 522, L9
- (9) Kennicutt, R. C., Jr. 1998, ARA&A, 36, 189
- (10) Kudritzki, R.-P., Méndez, R. H., Feldmeier, J. J. et al. 2000, ApJ, 536, 19
- (11) Kunth, D., Mas-Hesse, J. M., Terlevich, E., et al. 1998, A&A, 334, 11
- (12) Leitherer, C., Schaerer, D., Goldader, J. D., et al. 1999, ApJSS, 123, 3
- (13) Mas-Hesse, J.M. , Kunth, D., Tenorio-Tagle, G., et al. 2003, ApJ, 598, 858
- (14) Mehlert, D., Noll, S., Appenzeller, I., et al. 2002, A&A, 393, 809
- (15) Meinköhn, E., & Richling, S. 2002, A&A, 392, 827
- (16) Neufeld, D. A. 1990, ApJ, 350, 216
- (17) Noll, S., et al. 2004, submitted
- (18) Van Ojik, R., Roettgering, H. J. A., Miley, G. K., & Hunstead, R. W. 1997, A&A, 317, 358
- (19) Osterbrock, D. E. 1989, ”Astrophysics of Gaseous Nebulae and Active Galactic Nuclei”, University Science Books
- (20) Richling, S., Meinköhn, E., Kryzhevoi, N., & Kanschat, G. 2001, A&A, 380, 776
- (21) Rhoads, J. E., Malhotra, S., Dey, A., et al. 2000, ApJ, 545, 85
- (22) Shapley, A. E., Steidel, C. C., Pettini, M., & Adelberger, K. L. 2003, ApJ, 588, 65
- (23) Taniguchi, Y., Shioya, Y., Masaru, A., et al. 2003, JKAS, 36, 22
- (24) Tenorio-Tagle, G., Silich, S. A., Kunth, D., et al. 1999, MNRAS, 309, 332
- (25) Walborn, N. R., & Panek, R. J. 1984, APJ, 280, 27
- (26) Willis, A.J., & Garmany, C.D. 1989, ”Wolf-Rayet Stars” in Exploring the Universe with the IUE Satellite, eds. Y.Konda et al., 1989 Kluwer, p. 157
- (27) Wu, C.-C., Ake, T. B., Boggess, A., et al. 1983, ”The IUE Ultraviolet Spectral Atlas”, NASA Newsletter, No. 22