THE -PROCESS IN SUPERNOVAE: IMPACT OF NEW MICROSCOPIC MASS FORMULAS
Abstract
The astrophysical origin of -process nuclei remains a long-standing mystery. Although some astrophysical scenarios show some promise, many uncertainties involved in both the astrophysical conditions and in the nuclear properties far from the -stability have inhibited us from understanding the nature of the -process. The purpose of the present paper is to examine the effects of the newly-derived microscopic Hartree-Fock-Bogoliubov (HFB) mass formulas on the -process nucleosynthesis and analyse to what extent a solar-like -abundance distribution can be obtained. The -process calculations with the HFB-2 mass formula are performed, adopting the parametrized model of the prompt explosion from a collapsing O-Ne-Mg core for the physical conditions and compared with the results obtained with the HFB-7 and droplet-type mass formulas. Due to its weak shell effect at the neutron magic numbers in the neutron-rich region, the microscopic mass formulas (HFB-2 and HFB-7) give rise to a spread of the abundance distribution in the vicinity of the -process peaks ( and 195). While this effect resolves the large underproduction at and 140 obtained with droplet-type mass formulas, large deviations compared to the solar pattern are found near the third -process peak. It is shown that a solar-like -process pattern can be obtained if the dynamical timescales of the outgoing mass trajectories are increased by a factor of about , or if the -decay rates are systematically increased by the same factor.
1 INTRODUCTION
The origin of the rapid neutron-capture (-process) nuclei is still a mystery. One of the underlying difficulties is that the astrophysical site (and consequently the astrophysical conditions) in which the r-process takes place has not been identified. Although some scenarios such as “neutrino-driven winds” from nascent neutron stars (Woosley et al., 1994; Takahashi et al., 1994; Qian & Woosley, 1996; Cardall & Fuller, 1997; Otsuki et al., 2000; Wanajo et al., 2001; Thompson, Burrows, & Meyer, 2001), “prompt supernova explosions” from small iron cores (Sumiyoshi et al., 2001) or from O-Ne-Mg cores (Wanajo et al., 2003), and “neutron star mergers” (Freiburghaus, Rosswog, & Thielemann, 1999) show some promise, each of them faces severe problems and cannot at the present time be called for to explain the production and galactic enrichment of the -process nuclei observed in nature.
Another underlying difficulty is due to the uncertainties in the theoretical predictions of nuclear data far from the -stability, for which essentially no experimental data exist. In particular, mass predictions for neutron-rich nuclei play a key role since they affect all the nuclear quantities of relevance in the -process, namely the neutron capture, photodisintegration and -decay rates, as well as the fission probabilities . Although most of the recent mass formulas show fits to experimental masses of similar quality (characterized by an rms error of about MeV), the mass extrapolations far from the valley of -stability can differ from each other quite significantly (for a recent review, see Lunney, Pearson, & Thibault, 2003). Recently, Hartree-Fock mass formulas with fully microscopic approaches have been constructed (Goriely, Tondeur, & Pearson, 2001; Samyn et al., 2002; Goriely et al., 2002; Samyn et al., 2003; Goriely et al., 2003). The latest Hartree-Fock-Bogoliubov formula, labeled HFB-2 up to HFB-7(Goriely et al., 2002; Samyn et al., 2003; Goriely et al., 2003), are among the most accurate mass formulas, predicting the 2135 measured masses with a root-mean-square error around 0.670 MeV for nuclei with , i.e with the same accuracy or even better than the one obtained with droplet-like mass formulas (Hilf et al., 1976; Möller et al., 1995). A brief comparison of these mass models is given in § 2.
The purpose of this study is to examine the effects of the newly-derived microscopic mass formula on the -process nucleosynthesis and analyse to what extent a solar-like distribution can be obtained. Most of previous works devoted to the study of nuclear mass formulas and their impact on the -process nucleosynthesis were based on site-independent approaches, the so-called canonical model assuming a constant temperature and neutron number density during the neutron-capture phase (Goriely & Arnould, 1996; Cowan et al., 1999; Goriely & Clerbaux, 1999; Goriely & Arnould, 2001; Schatz et al., 2002). This approach is understandable since the astrophysical -process site has not been unambiguously identified. Another approach consists in considering promising sites and in modifying some of the relevant characteristics to force a successful -process. In this case, the free parameter space is usually reduced and an easier analysis can be performed. In addition, some works based on such site-specific approaches have demonstrated that the abundance distributions are sensitive to the astrophysical conditions adopted, in particular during the “freezeout” phase (Surman et al., 1997; Freiburghaus et al., 1999; Surman & Engel, 2001; Wanajo et al., 2002).
We adopt, here, for the physical conditions the semi-realistic astrophysical model of the “prompt supernova explosion” from the collapsing O-Ne-Mg core by Wanajo et al. (2003) (§ 3). The -process nucleosynthesis with the HFB-2 mass formula in each outgoing mass trajectory is then calculated with a nuclear reaction network code. The mass-averaged yields over the mass shells relevant for the -process is compared with the -process abundance patterns in the solar system and in an extremely metal-poor star (CS 22892-052), as well as with those obtained with other mass formulas, more specifically the HFB-7 mass prediction and the extensively used droplet formulas of Hilf et al. (1976) and Möller et al. (1995) (§ 4). Uncertainties stemming from the astrophysical conditions and extra nuclear ingredients are discussed in § 5. A summary follows in § 6.
2 MICROSCOPIC MASS MODELS
Among the ground state properties, the atomic mass is obviously the most fundamental quantity and influences the -process abundance predictions mainly through the competition taking place in the neutron-rich region. The calculation of the reaction rates also requires the knowledge of other ground state properties, such as the deformation, density distribution, single-particle level scheme, pairing force and shell correction energies. Recently, impressive progress has been made experimentally. This situation results largely from recent measurements with Penning-trap or Schottky spectrometers which have enlarged the region of known masses, in particular towards the neutron-deficient side of the valley of nuclear stability (for a recent review, see Lunney, Pearson, & Thibault, 2003). The new Atomic Mass Evaluation (Audi & Wapstra, 2001) contains 2214 measured masses, i.e 250 more than the 1995 one (Audi & Wapstra, 1995). A more accurate mass determination is also available now for about 132 nuclides originally included in the 1995 compilation. Out of the 382 new experimental masses, 337 are located in the proton-rich region of the nuclear chart and only 45 in the neutron rich region. As far as nuclei directly involved in the -process are concerned, almost no experimental mass data exist, and theory must fill the gap.
Attempts to estimate nuclear masses go back to the liquid-drop Weizsäcker mass formula. Improvements to this original model have been brought little by little, leading to the development of macroscopic-microscopic mass formulas, such as the droplet model (DM) (e.g Hilf et al., 1976) and the ‘finite-range droplet model’ (FRDM) of Möller et al. (1995). In this framework, the macroscopic contribution to the masses and the microscopic corrections of phenomenological nature are treated independently, both parts being connected solely through a parameter fit to experimental masses. Despite the great empirical success of these formulas (e.g. FRDM fits the 2135 experimental masses (Audi & Wapstra, 2001) with an rms error of 0.676 MeV), it suffers from major shortcomings, such as the incoherency of the link between the macroscopic part and the microscopic correction, the instability of the mass prediction to different parameter sets, or the instability of the shell corrections. As a consequence, its reliability when extrapolating far from experimentally known masses is severely limited. Although these models have been extensively used for astrophysics applications (Woosley et al., 1994; Takahashi et al., 1994; Sumiyoshi et al., 2001; Wanajo et al., 2001, 2002, 2003), there is an obvious need to develop a mass model that is more closely connected to the basic nuclear interaction properties.
A new major progress has been achieved recently within the Hartree-Fock method (Goriely, Tondeur, & Pearson, 2001; Samyn et al., 2002, 2003; Goriely et al., 2002, 2003). It is now demonstrated that this microscopic approach, making use of a Skyrme force fitted to essentially all the mass data, is not only feasible, but can successfully compete with the most accurate droplet-like formulas available nowadays in the reproduction of measured masses. This holds true not only when the pairing force is described in the BCS approximation, but also when the Bogoliubov method is adopted (HFB model), which has the advantage of ensuring the self-consistency of the treatment of the nuclear single-particle and pairing properties. These large-scale HFB calculations are based on the conventional 10-parameter Skyrme force along with a 4-parameter -function pairing force. The Skyrme and pairing parameters are derived from a fit to the full data set of 2135 measured masses of nuclei with , leading to an rms error of the order of 0.674 MeV for the HFB-2 mass table.
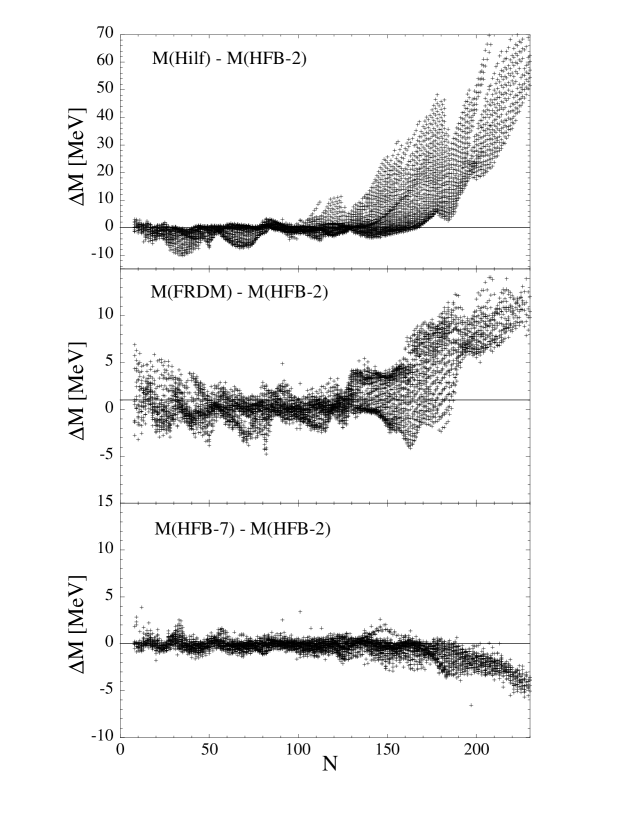
Despite the success of the HFB-2 mass formula, a series of studies of possible modifications to the basic force model and to the method of calculation was initiated all within the HFB framework in order to test the reliability of the mass extrapolations (Samyn et al., 2003; Goriely et al., 2003). For this reason, a set of additional 5 new mass tables, referred to as HFB-3 to HFB-7 were designed to analyse the sensitivity of the mass fit and extrapolations to the prescription used for the center-of-mass correction, the density-dependence of the pairing interaction and the amplitude of the effective nucleon mass. The new mass fits are of the same quality as the HFB-2 mass predictions. In addition, it is found that globally the extrapolations out to the neutron-drip line of all these different HFB mass formulas are essentially equivalent. Figure 1 (lower panel) compares the HFB-2 and HFB-7 masses for all nuclei with lying between the proton and neutron driplines. Although HFB-2 and HFB-7 are obtained with significantly different Skyrme forces (in particular, HFB-2 is characterized by an density-independent pairing force and an effective isoscalar mass , while HFB-7 has an density-dependent pairing force and ), deviations smaller than about 2 MeV are obtained for nuclei with .
In contrast, more discrepancies are seen between HFB and droplet-type masses (Figure 1), especially for superheavy nuclei. For lighter species, the mass differences remain below some 5-10 MeV, although significantly different shell and deformation effects are predicted. Most particularly, the HFB mass formulas show a weaker neutron-shell closure close to the neutron drip line with respect to droplet-like models as FRDM (for a more detailed discussion, see Goriely et al., 2002). Future improved microscopic predictions, in particular in mean field, but also shell model approaches, as well as future experiments will hopefully shed light on the behavior of the and 126 neutron shell closures at large isospins, in a similar way as for the , 28, and 50 magic numbers (Lunney, Pearson, & Thibault, 2003). These major differences in the nuclear structure properties may affect the nucleosynthesis predictions, as shown in § 4.
3 SUPERNOVA MODEL AND THE -PROCESS
Recent comprehensive spectroscopic studies of extremely metal-poor stars (Hill et al., 2002; Cowan et al., 2002; Sneden et al., 2003), as well as chemical evolution studies (Ishimaru & Wanajo, 1999; Ishimaru et al., 2004; Argast et al., 2003), in the Galactic halo suggest that the -process is a primary nucleosynthesis process and that the astrophysics site could be associated with core-collapse supernovae. In fact, most of the recent studies on the nucleosynthesis -process have been based on the “neutrino-driven wind” scenario, in which the free nucleons accelerated by the intense neutrino flux near the neutrino sphere of a core-collapse supernova assemble to heavier nuclei (Woosley et al., 1994; Qian & Woosley, 1996; Cardall & Fuller, 1997; Otsuki et al., 2000; Wanajo et al., 2001; Thompson, Burrows, & Meyer, 2001).
In the present study, we use the parametrized model of the “prompt supernova explosion” from an progenitor star (with a O-Ne-Mg core) by Wanajo et al. (2003). The reason is that this model leads to -abundance distributions that have been shown to be relatively similar to the solar distribution, at least if an artificial enhancement of the shock-heating energy is assumed. In addition, this scenario does not suffer from the problematic overproduction of nuclei seen in the neutrino-driven wind model (Woosley et al., 1994; Wanajo et al., 2001). Finally, the physical conditions in hydrodynamical (i.e., prompt) explosions may not be significantly affected by highly uncertain neutrino heating (or cooling) processes (Hillebrandt, Nomoto, & Wolff, 1984) as they are in the neutrino wind model. The site modeling is consequently easier and the final abundance predictions less sensitive to the neutrino physics. All these reasons justify the present study and the comparison of the nucleosynthesis results with the solar -abundance distribution. It is obvious, however, that a similar study based on the neutrino-driven wind scenario is needed since the prompt explosion scenario also faces severe problems that need to be resolved (Wanajo et al., 2003). In particular, it should be recalled here that in consistent realistic prompt explosion models, only a weak explosion is obtained and no -processing. An artificial enhancement of the shock energy is needed to drive an energetic explosion and provide the necessary conditions for a successful -process.
Wanajo et al. (2003) performed core-collapse simulations with a one-dimension, Newtonian hydrodynamic code. The highly neutronized ejecta (, initial electron mole fraction, ) in the (artificial) energetic explosion (model Q6) is subject to a strong production of -process nuclei. In this study, we use the mass trajectories of the ejected material from (zone number 60, ) to (zone number 105, ) in mass coordinate (the surface of the O-Ne-Mg core is at mass coordinate zero), as shown in Figure 2. This mass range was shown by Wanajo et al. (2003) to give a solar-like -abundance distribution assuming that part of the ejected material with low- (layers 106 to 132 of Wanajo et al., 2003) was artificially assumed to be reaccreted onto the compact object, and consequently not to contribute to the galactic enrichment. The temperature and density histories of some mass elements are presented in Figure 3.
Adopting model Q6 in Wanajo et al. (2003) for the physical conditions, the -process abundances are obtained by solving an extensive nuclear reaction network code. The network consists of species, all the way from single neutrons and protons up to the fermium () isotopes (Figure 4). We include all relevant reactions, i.e. , , , , , , and their inverse. All reaction rates are calculated within the statistical model of Hauser-Feshbach making use of experimental masses (Audi & Wapstra, 2001) whenever available or the HFB-2 mass predictions (Goriely et al., 2002) otherwise. The photodisintegration rates are deduced from the reverse rates applying the reciprocity theorem with the nuclear masses considered. The -decay and -delayed neutron emission rates are taken from the gross theory (GT2) of Tachibana, Yamada, & Yoshida (1990), obtained with the ETFSI (extended Thomas-Fermi plus Strutinsky integral, Aboussir et al., 1995) predictions. Other nuclear inputs are the same as in Wanajo et al. (2003).
A word of caution is required concerning some inconsistencies in the nuclear input considered here, and most particularly concerning the use of ETFSI masses to estimate -decay rates within the GT2 model. As mentioned in § 2, nuclear masses influence the -abundance distribution mainly through the competition taking place in the neutron-rich region. Thanks to the balance theorem, such a competition remains relatively independent of the model adopted to estimate the neutron capture and photodisintegration rates. In contrast, the sensitivity of the absolute value of the reaction and -decay rates on nuclear masses can depend significantly on the model considered. For example, within the statistical GT2 model, the -decay rate scale as the fifth power of the value, while in the continuum QRPA model (e.g Borzov & Goriely, 2003), the rates depend on the possible spin-isospin excitation within the window but are not directly affected by the nuclear mass as such. Ultimately, for each mass model, a consistent estimate of the reaction and -decay rates based on the corresponding mass model predictions for masses, but also deformation, single-particle properties, …should be performed. In order to simplify here the discussion on the impact of masses, but also to avoid the complicate model dependence in the estimate of the reaction and -decay rates, we will restrict ourselves to consider in all cases only one set of -decay rates, namely the GT2 rates with ETFSI masses.
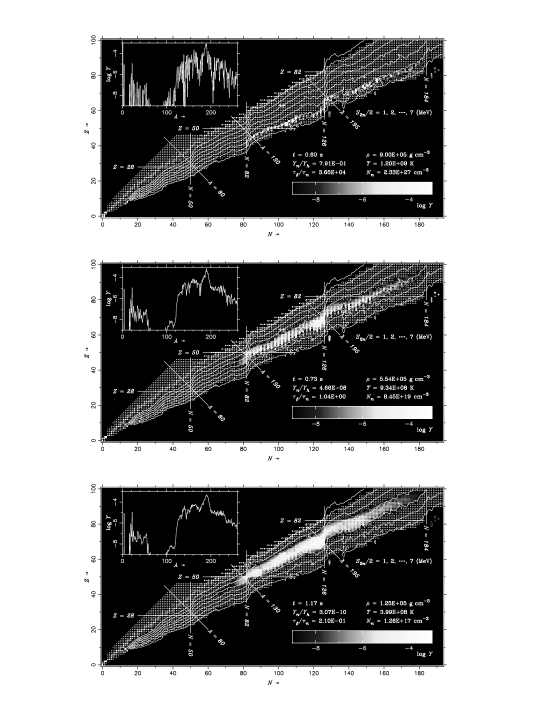
The calculation in each mass trajectory is started at (where K). The initial composition is taken to be that of the nuclear statistical equilibrium with the matter density at , and consists mostly of free nucleons and alpha particles. The calculation is terminated after 10 seconds from the start in each mass trajectory. Snapshots of the -process calculation in the mass-trajectory 99 ( in mass coordinate and ) are shown in Figure 4. The abundances (mole fractions) are color coded, while the isotopes included in the reaction network are shown by dots with the stable and meta-stable isotopes by larger dots. Contours of constant two-neutron-separation energies divided by two () from 1 to 8 MeV are superimposed. The abundance curve as a function of the mass number is also shown in each upper left panel.
The upper panel of Figure 4 shows the time slice when the neutron-to-seed ratio, , decreases to , where is the abundance of free neutrons and
| (1) |
that of nuclei heavier than helium. At this time, the -process flow closely follows an iso- curve given by MeV (red line), where
| (2) |
is the number density of free neutrons in units of cm-3. The condition is referred to as the neutron exhaustion.
For the adopted rates, a quasi-equilibrium between neutron capture and photodisintegration continues until decreases to as can be seen in the middle panel of Figure 4, where
| (3) |
and
| (4) |
are the averaged -decay and neutron-capture lifetimes, and and the -decay and neutron-capture rates of the nucleus , respectively. At this time, the abundance distribution is still near the MeV line. We refer hereafter the condition as freezeout, and the epoch between neutron exhaustion and freezeout as the freezeout phase. This freezeout phase is of particular relevance to determine the final abundance pattern as discussed in § 4. After the freezeout, the global abundance pattern is not significantly affected anymore, although it can still be somewhat smoothed out by photodisintegration and -delayed neutron emission, as can be seen in the lower panel of Figure 4 ().
4 IMPACT OF MASS PREDICTIONS ON THE -PROCESS
The final -process yields are mass-averaged over all mass trajectories between 1.08 and in mass coordinate. In Figure 5a, the mass-averaged abundances (line) are compared with the solar -process abundance pattern (dots, Goriely, 1999) that is scaled to match the height of the third -process peak. For comparison, identical calculations were performed by replacing our standard HFB-2 masses by the HFB-7 (Goriely et al., 2003, Figure 5b), FRDM (Möller et al., 1995, Figure 5c), and DM (Hilf et al., 1976, Figure 5d) predictions.
Roughly speaking, an overall agreement between calculated and solar abundance curves can be seen in Figures 5a-d for nuclei with . Discrepancies common to all cases are, however, observed, in particular the deficiencies for nuclei in the vicinity of the first -process peak (), the shifts with respect to the solar curve of the second and third -process peaks ( and 195) to lower mass numbers ( units in mass number) and the second to third peak height which is significantly smaller than observed in the solar distribution. We do not discuss further on the deficiencies near , since theoretically the results are highly dependent on the adopted mass cut of the ejecta (see § 3 and Wanajo et al., 2003, for more details) and observationally there has been an increasing number of evidences that the light () -process nuclei have a different origin from the heavy () ones (e.g., Hill et al., 2002; Sneden et al., 2003). For the shifts of the peak locations, as well as the second to third peak ratio, it is conceivable that this deficiency does not originate from the mass model, but rather from inadequate astrophysical or nuclear description, since it is observed for all mass formulas. This point will be further discussed in § 5.
A few significant differences in the abundance patterns can, however, be observed near the second and third peaks when use is made of the Hartree-Fock models (HFB-2 and HFB-7) on one side and the droplet models on the other side. First, the underproduction of nuclei at and 140 is more pronounced with the FRDM (Figure 5c) and DM (Figure 5d) masses than with the HFB-2 (Figure 5a) or HFB-7 (Figure 5b) masses. Second, the abundances near in the HFB cases are spread out in contrast to what is observed in the solar -abundances. Third, the abundance curves near the third peak with the HFB masses are widened and the valley at as observed in the solar -distribution is significantly shifted to lower mass numbers.
These differences reflect the model properties of iso- curves shown in Figure 6, along which the -process proceeds (see also Figure 4). Major local differences between the HFB (Figures 6a, b) and the droplet masses (Figures 6c, d) are found near the neutron magic numbers and 126. The Hartree-Fock masses show weaker shell-closures, i.e. smoother iso- curves, at and 126. This reduced shell effect (which actually is not totally quenched at the neutron dripline in contrast to other predictions, e.g Pearson, Nayak, & Goriely, 1996) is responsible for spreading the second and third abundance peaks. In contrast, the large droplet shell effect is clearly seen at and 126 by the steep character even close to the neutron dripline and gives rise to sharp abundance peaks.
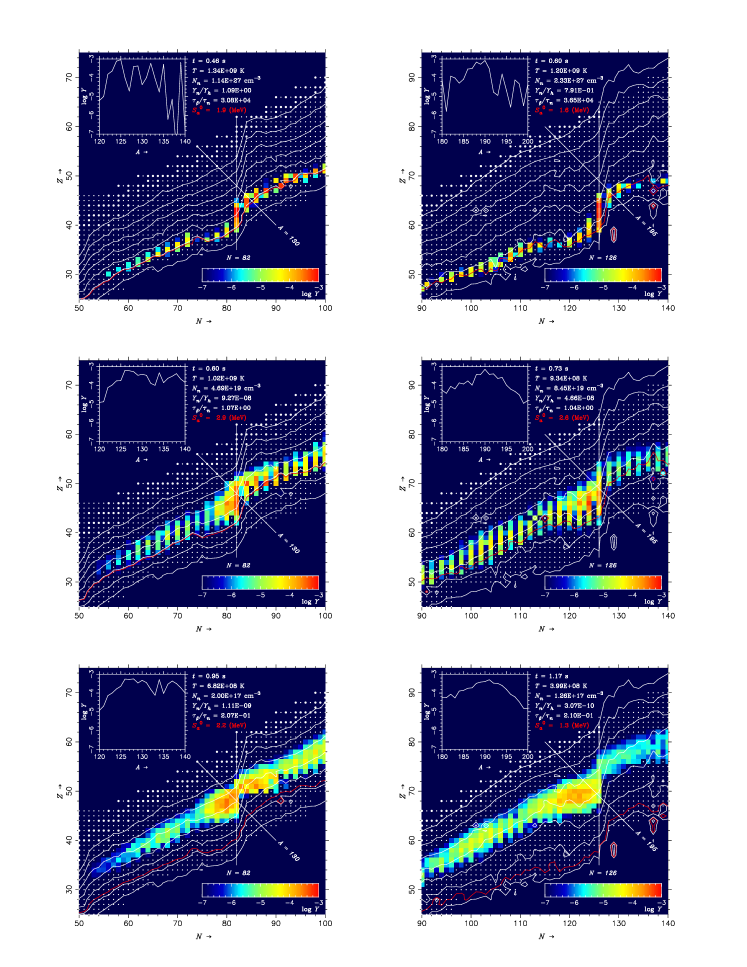
Figure 7 illustrates the formation process of the second and third peaks with the HFB-2 masses in more details. The left panels show the snapshots of the abundance distributions for the trajectory 90 ( in mass coordinate and ), and the right panels for the trajectory 99 ( in mass coordinate and ) at the neutron exhaustion (top panels), freezeout (middle panels), and later time (bottom panels). The trajectory 90 (left panels in Figure 7) gives a major contribution to the second-peak formation. The abundances are widely distributed already at neutron exhaustion (left-top panel), owing to the weaker shell gaps at , in particular for low . This results in a split of the second abundance peak as seen in Figure 5a. The shift of the abundance distribution to the heavier mass number during the freezeout phase is small, although the abundance curve is significantly smoothed by photodisintegration (and slightly by -delayed emission). The reason is that the freezeout takes place at a low -value ( MeV, left-middle panel in Figure 7).
The formation process of the third peak in the trajectory 99 can be seen in the right panels of Figure 7. The shell effect in the neutron-rich region is not reduced as the one, though it still remains weaker than in the droplet approach. The splitting of the peak abundances is not observed, but the abundance curve is significantly broaden by photodisintegrations during the freezeout phase. The freezeout takes place when is still low (2.6 MeV), and for this reason the peak position at is not shifted during the freezeout phase.
Some of the deficiencies observed in the -abundance distribution obtained with HFB masses are seen to be cured when considering droplet masses (Figure 5). In particular, the DM masses characterized by isospin-independent and shell effects give rise to an abundance curve which is seen to be globally in better agreement with the solar pattern than do the HFB curves. It would be tempting to judge the quality of the nuclear mass predictions on the basis of such a comparison. However, it must be recalled here that such -process calculations in prompt explosion scenarios (like in any other site studied so far) remain strongly affected by other input uncertainties in the astrophysical modeling as well as extra nuclear ingredients. More specifically, the total mass finally ejected (i.e not reaccreted onto the proto-neutron star) remains unknown and strongly dependent on the astrophysical modeling of the explosion. The same holds for the dynamical timescale of the outgoing material. Finally, major difficulties still exist in predicting reliably the -decay half-lives of exotic neutron-rich nuclei. These uncertainties are studied in § 5, where it is shown that a modification of either the physical conditions of the explosion or the -decay rates can influence drastically the agreement with the solar -distribution.
Finally, it could also be argued that the outcome of the prompt explosion nucleosynthesis in one specific star might not need to match the solar -process pattern. Recent spectroscopic studies show that the elemental abundance patterns between the second and third peaks of -process-enhanced ultra-metal-poor stars in the Galactic halo are in excellent agreement with the solar -process abundances. In particular, the agreement extends to the third peak elements Os, Ir, and Pt for HD 115444, HD 126238 (Sneden et al., 1998), BD +17∘3248 (Cowan et al., 2002), and CS 22892-052 (Sneden et al., 2003, Figure 8), and CS 31082-001 (Hill et al., 2002). These observations led these authors to the conclusion that there is only one single -process site that contributes to the production of heavy () -process nuclei and that the corresponding distribution is similar to the solar -process pattern (Sneden et al., 1996). Instead of comparing the predicted abundances with the solar content, we can therefore use such observations and estimate to what extent the disagreements seen in Figure 5 and discussed above are also reflected in the comparison with the observed elemental distribution. The comparison is shown in Figure 8 for the most-studied, extremely metal-poor star CS 22892-052 (Sneden et al., 2003). Even in this case, it is difficult to discriminate between the predictions obtained with the four different mass formulas considered here. This is quite normal since the observed distribution is reduced to some 30 elements (in comparison with some 130 nuclei in the solar material). And above all, the observed pattern could well be explained by the nuclear properties invariance in the region rather than from specific astrophysics conditions as discussed in Goriely & Arnould (1997). It is therefore more informative to compare the -abundance prediction with the solar pattern, keeping in mind that there is no stringent observational constraint that the final distribution should be strictly solar. Nevertheless, future abundance determinations of as many extremely metal-poor stars as possible will be of particular importance to shed light on nucleosynthesis yields from only one or a few supernova events.
5 UNCERTAINTIES IN THE -PROCESS CALCULATIONS
In this section, we examine possible astrophysical and nuclear modifications leading to a better agreement of the HFB-2 abundance curve with the solar -process pattern. Regarding the prompt supernova explosions considered here, we do not expect the entropy per baryon of the shocked material to be very different from the one deduced from the simulation ( in units of the Boltzmann constant), since many previous simulations resulted in similar values (Hillebrandt, Nomoto, & Wolff, 1984; Sumiyoshi et al., 2001). However, the dynamical timescale of the outgoing matter (without changing the entropy) can significantly differ from model to model. For example, the dynamical timescales of the mass trajectories responsible for -process in Sumiyoshi et al. (2001) are typically a few times shorter than those applied in this study (Wanajo et al., 2003), because of their different treatments of electron capture. It is also conceivable that other effects, such as convection, asymmetric explosion, or reverse shock from the outer envelope, cause an acceleration or a deceleration of the outgoing material.
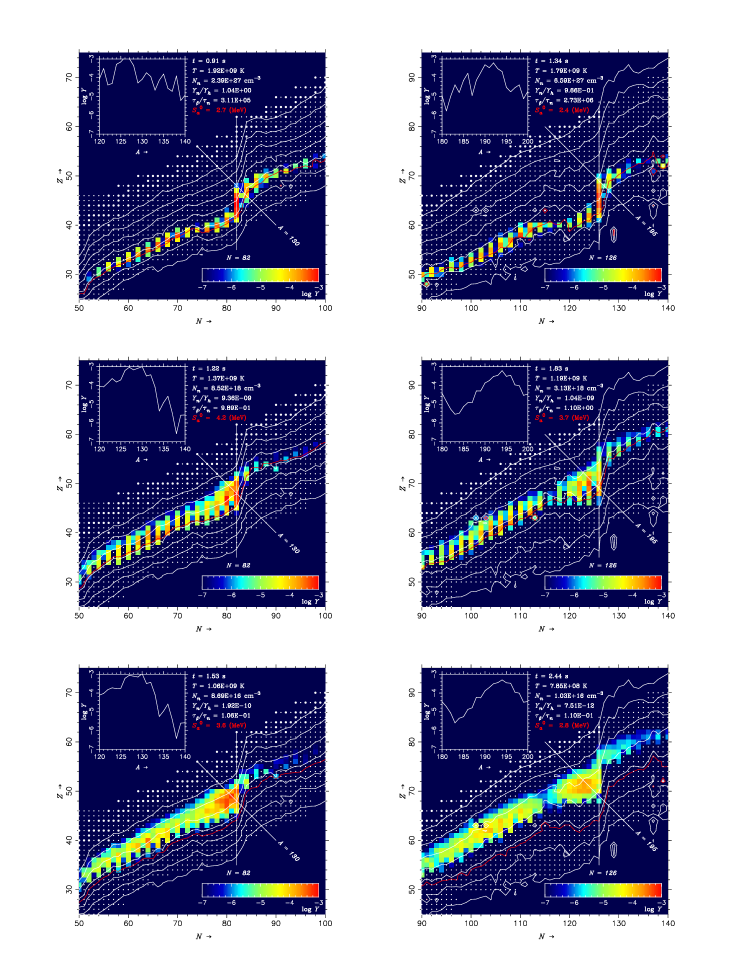
In order to test the impact of a change in the dynamical timescales, we simply modify the density and temperature profiles of each trajectory, so that and , i.e the dynamical timescale is multiplied by a factor of . Figures 9 and 10 show the abundance curves for (fast), 1 (standard), 2, 3, and 5 (slow) obtained with the mass-trajectories 90 and 99, which are responsible for the formation of the second and third peaks, respectively. The abundance curves near the second (Figure 9) and third (Figure 10) peaks are seen to agree fairly well with to the solar -process pattern when the timescale is multiplied by a factor of (Figures 9d-e and Figures 10d-e), and to disagree for the fast trajectories (Figures 9a-b and Figures 10a-b).
This temporal effect is due to the significant abundance evolution during the feezeout phase for the slowly outgoing material, as shown in Figure 11 (same as Figure 7, but for ). At the neutron exhaustion, the abundances are dispersed near the second (left-top panel) and third (right-top panel) peaks, respectively, owing to the weak shell gaps at and 126 for low ( MeV), as in the standard case (Figure 7). The freezeout takes place (middle panels), however, at much higher values (4.2 and 3.7 MeV for the trajectories 90 and 99, respectively) than those in the standard case (2.9 and 2.6 MeV, Figure 7). The reason is that the temperatures at the freezeout are higher ( and 1.2 for trajectories 90 and 99, respectively) owing to the slow expansion with than those in the standard case ( and 0.93). As a result, the abundance peaks shift to (trajectory 90) and 194 (trajectory 99), i.e mostly at the same position as those in the solar -distribution. Concomitantly, the width of the abundance curve near the second and third peaks is reduced significantly due to the larger shell gaps at MeV than that at MeV, and becomes similar to the one observed in the solar pattern (Figures 9e and 10e).
Assuming all the nuclear inputs are correct and the -process indeed originates from the collapse of O-Ne-Mg core, this would imply that the expansion of the outgoing material must be significantly slower than obtained by Wanajo et al. (2003). A possible explanation could be found in the deceleration of the ejecta by the reverse shock from the outer envelope if the hydrogen and helium layers survive the mass loss till the onset of the core collapse. This effect is absent from the simulation of Wanajo et al. (2003) with a bare O-Ne-Mg white dwarf. This reverse shock effect would also reduce the total overproduction of -processed material per event in the prompt explosion scenario (see Wanajo et al., 2003). It is interesting to note that such a significant deceleration of the outgoing material takes place in the neutrino-powered explosion due to the stalled shock wall once launched by a core bounce (Woosley et al., 1994). More detailed numerical simulations of the collapsing O-Ne-Mg core including the outer envelope are needed to quantify this effect.
The final mass-averaged abundance curve corresponding to mass trajectories slowed by a factor of three () is shown with the scaled solar -process abundances in Figure 12a. We find a good agreement between the calculated and solar -process patterns, in particular near the second and third peaks. The steep valley at observed in the solar -process abundances is also well reproduced. However, an underproduction at and 140 appear.
As far as nuclear uncertainties are concerned, -decays rates, neutron-captures rates and fission probabilities also play a key role (neutrino reactions are not important in the prompt explosion, see Wanajo et al., 2003). A change in their uncertain prediction can affect the nucleosynthesis predictions. In the present scenario, fission does not play an important role however, since it affects only a small fraction of the total -processed matter (Wanajo et al., 2003). The prediction of neutron capture rates, especially for exotic neutron-rich nuclei, remains difficult, in particular in the prediction of the direct capture contribution and of the -ray strength and neutron-nucleus optical model potential for exotic neutron-rich nuclei as required in the statistical reaction model of Hauser-Feshbach (for more details, see Goriely, 1997, 2003). Much work remains to be done to estimate the neutron capture rates reliably. For this reason, their impact on the -process nucleosynthesis is postponed to a future study.
Recent microscopic calculations of the -decay rate within the energy density functional plus continuum QRPA formalism shows that the first forbidden transitions might have been underestimated in the past and can increase the -decay rate by a factor of about 2 along the neutron-rich isotone and of about 3-10 along the neutron-rich isotone compared with the calculation based exclusively on the allowed transitions (Borzov, 2003). Detailed microscopic estimates of the -decay rates (including forbidden transitions) for all nuclei of relevance in -process calculations, as well as future experiments with radioactive ion beams are deeply awaited to improve this fundamental input in the description of the -process nucleosynthesis.
To estimate the influence of -decays, we show in Figure 12b the mass-averaged -process yields obtained by multiplying all the -decay rates by a factor of three (i.e., reducing by a factor of three). Interestingly, no significant differences are seen between Figures 12a and 12b. For -decay rates faster by a factor of three, the freezeout (corresponding to ) takes place at higher temperatures and thus at higher value, which has globally the same effect as slowing down the outgoing material by the same factor. This test calculation shows the crucial role played by -decay rates when considering non-parametrized density and temperature profiles, i.e thermodynamic conditions fixed by (semi-)realistic models.
6 SUMMARY
We have examined the -process nucleosynthesis with the state-of-the-art microscopic mass formula, HFB-2 (Goriely et al., 2002), to see its effects on the theoretical -process abundance prediction. The yields of -process species were calculated with a nuclear reaction network code ( isotopes), adopting favorable physical conditions in the prompt explosion model of a collapsing O-Ne-Mg core by Wanajo et al. (2003). This model led to production of the solar-like -abundance pattern in the previous study (Wanajo et al., 2003). However, an artificial enhancement of the shock-heating energy was needed to obtain requisite physical conditions for successful -processing.
Due to its weak shell effect at the neutron magic numbers in the neutron-rich region, the microscopic mass formulas (HFB-2 and HFB-7) give rise to a spread of the abundance distribution in the vicinity of the -process peaks ( and 195). While this effect resolves the large underproduction at and 140 obtained with droplet-type mass formulas, large deviations compared to the solar pattern are found near the third -process peak. When use is made of droplet mass predictions, sharp -process peaks are systematically found, owing to their strong shell effect for neutron magic numbers even in the neutron-rich region. However, due to the numerous uncertainties still affecting the astrophysics models as well as the prediction of extra nuclear ingredients, it would be highly premature to judge the quality of the mass formula on the basis of such a comparison.
We found that abundance peaks similar to the one observed in the solar system could be recovered if the dynamical timescales of the mass trajectories are increased by a factor of (without any change in the entropy) or by decreasing systematically the -decay half-lives by the same factor. These changes might be conceivable when considering the current uncertainties in the astrophysics as well as in the nuclear -decay model. Much effort in the astrophysics and nuclear modeling remain to be devoted to improve the difficult description of the -process nucleosynthesis.
References
- Aboussir et al. (1995) Aboussir, Y., Pearson, J. M., Dutta, A. K., & Tondeur, F. 1995, At. Data Nucl. Data Tables, 61, 127
- Argast et al. (2003) Argast, D., Samland, M., Thielemann, F. -K., & Qian, Y. -Z. 2003, A&A, submitted (astro-ph/0309237)
- Audi & Wapstra (1995) Audi, G., & Wapstra, A.H. 1995, Nucl. Phys. A, 595, 409
- Audi & Wapstra (2001) Audi, G., & Wapstra, A.H. 2001, private communication
- Borzov (2003) Borzov, I.N. 2003, Phys. Rev. C, 67, 025802
- Borzov & Goriely (2003) Borzov, I.N., & Goriely S. 2003, Phys. Part. Nucl., 34, 1
- Cardall & Fuller (1997) Cardall, C. Y. & Fuller, G. M. 1997, ApJ, 486, L111
- Cowan et al. (1999) Cowan, J. J., Pfeiffer, B., Kratz, K. -L., Thielemann, F. -K., Sneden, C., Burles, S., Tytler, D., & Beers, T. C. 1999, ApJ, 521, 194
- Cowan et al. (2002) Cowan, J. J., Sneden, C., Burles, S., Ivans, I. I., Beers, T. C., Truran, J. W., Lawler, J. E., Primas, F., Fuller, G. M., Pfeiffer, B., & Kratz, K. -L. 2002, ApJ, 572, 861
- Freiburghaus et al. (1999) Freiburghaus, C., Rembges, J. -F., Rauscher, T., Kolbe, E., Thielemann, F. -K., Kratz, K. -L., Pfeiffer, B., & Cowan, J. J. 1999, ApJ, 516, 381
- Freiburghaus, Rosswog, & Thielemann (1999) Freiburghaus, C., Rosswog, S., & Thielemann, F. -K. 1999, ApJ, 525, L121
- Goriely & Arnould (1996) Goriely, S. & Arnould, M. 1996, A&A, 312, 327
- Goriely (1997) Goriely, S. 1997, A&A, 325, 414
- Goriely & Arnould (1997) Goriely, S. & Arnould, M. 1997, A&A, 322, L29
- Goriely (1999) Goriely, S. 1999, A&A, 342, 881
- Goriely & Clerbaux (1999) Goriely, S. & Clerbaux, B. 1999, A&A, 346, 798
- Goriely, Tondeur, & Pearson (2001) Goriely, S., Tondeur, F., & Pearson, J. M. 2001, At. Data Nucl. Data Tables, 77, 311
- Goriely & Arnould (2001) Goriely, S. & Arnould, M. 2001, A&A, 379, 1113
- Goriely et al. (2002) Goriely, S., Samyn, M., Heenen, P. -H., Pearson, J. M., & Tondeur, F. 2002, Phys. Rev. C, 66, 24326
- Goriely (2003) Goriely, S. 2003, Nucl. Phys. A, 718, 287c
- Goriely et al. (2003) Goriely, S., Samyn, M., Bender, M., & Pearson, J. M. 2003, Phys. Rev. C, in press
- Hilf et al. (1976) Hilf, E. R., von Groote, H., & Takahashi, K. 1976, in Proc. Third International Conference on Nuclei Far from Stability (Geneva: CERN), 142
- Hill et al. (2002) Hill, V., Plez, B., Cayrel, R., Beers, T.C., Nordström, B., Andersen, J., Spite, M., Spite, F., Barbuy, B., Bonifacio, P., Depagne, E., François, P., Molaro, P., & Primas, F. 2002, A&A, 387, 560
- Hillebrandt, Nomoto, & Wolff (1984) Hillebrandt, W., Nomoto, K., & Wolff, G. 1984, A&A, 133, 175
- Ishimaru & Wanajo (1999) Ishimaru, Y. & Wanajo, S. 1999, ApJ, 511, L33
- Ishimaru et al. (2004) Ishimaru, Y., Wanajo, S., Aoki, W., & Ryan, S. G. 2004, ApJ, 600, L47
- Lunney, Pearson, & Thibault (2003) Lunney, D., Pearson, J. M., & Thibault, C. 2003, Rev. Mod. Phys., 75, 1021
- Möller et al. (1995) Möller, P., Nix, J. R., Myers, W. D., & Swiatecki, W. J. 1995, At. Data Nucl. Data Tables, 59, 185
- Otsuki et al. (2000) Otsuki, K., Tagoshi, H., Kajino, T., & Wanajo, S. 2000, ApJ, 533, 424
- Pearson, Nayak, & Goriely (1996) Pearson, J.M., Nayak, R.C. & Goriely, S. 1996, Phys. Lett. B, 387, 455
- Qian & Woosley (1996) Qian, Y. -Z. & Woosley, S. E. 1996, ApJ, 471, 331
- Samyn et al. (2002) Samyn, M., Goriely, S., Heenen, P. -H., Pearson, J. M., & Tondeur, F. 2002, Nucl. Phys. A, 700, 142
- Samyn et al. (2003) Samyn, M., Goriely, S., & Pearson, J. M., 2003, Nucl. Phys. A, 725, 69
- Schatz et al. (2002) Schatz, H., Toenjes, R., Kratz, K.-L., Pfeiffer, B., Beers, T.C., Cowan, J.J., & Hill, V. 2002, ApJ, 579, 626
- Sneden et al. (1996) Sneden, C., McWilliam, A., Preston, G. W., Cowan, J. J., Burris, D. L., & Armosky, B. J. 1996, ApJ, 467, 819
- Sneden et al. (1998) Sneden, C., Cowan, J. J., Debra, L. B., & Truran, J. W. 1998, ApJ, 496, 235
- Sneden et al. (2003) Sneden, C., Cowan, J. J., Lawler, J. E., Ivans, I. I., Burles, S., Beers, T. C., Primas, F., Hill, V., Truran, J. W., Fuller, G. M., Pfeiffer, B., & Kratz, K. -L. 2003, ApJ, 591, 936
- Sumiyoshi et al. (2001) Sumiyoshi, K., Terasawa, M., Mathews, G. J., Kajino, T., Yamada, S., & Suzuki, H. 2001, ApJ, 562, 880
- Surman et al. (1997) Surman, R., Engel, J., Bennett, J. R., & Meyer, B. S. 1997, Phys. Rev. Lett., 79, 1809
- Surman & Engel (2001) Surman, R. & Engel, J. 2001, Phys. Rev. C, 64, 35801
- Tachibana, Yamada, & Yoshida (1990) Tachibana, T., Yamada, M., & Yoshida, Y. 1990, Progr. Theor. Phys., 84, 641
- Takahashi et al. (1994) Takahashi, K., Witti, J., & Janka, H.-Th. 1994, A&A, 286, 857
- Thompson, Burrows, & Meyer (2001) Thompson, T. A., Burrows, A., & Meyer, B. S. 2001, ApJ, 562, 887
- Wanajo et al. (2001) Wanajo, S., Kajino, T., Mathews, G. J., & Otsuki, K. 2001, ApJ, 554, 578
- Wanajo et al. (2002) Wanajo, S., Itoh, N., Ishimaru, Y., Nozawa, S., & Beers, T. C. 2002, ApJ, 577, 853
- Wanajo et al. (2003) Wanajo, S., Tamamura, M., Itoh, N., Nomoto, K., Ishimaru, Y., Beers, T. C., & Nozawa, S. 2003, ApJ, 593, 968
- Woosley et al. (1994) Woosley, S. E., Wilson, J. R., Mathews, G. J., Hoffman, R. D., & Meyer, B. S. 1994, ApJ, 433, 229