CHANDRA OBSERVATIONS OF THE CLOVERLEAF QUASAR H 1413+117: A UNIQUE LABORATORY FOR MICROLENSING STUDIES OF A LoBAL QUASAR
Abstract
We present new results uncovered by a re-analysis of a Chandra observation of the gravitationally lensed, low-ionization broad absorption line (LoBAL) quasar H 1413+117. Previous analyses of the same Chandra observation led to the detection of a strong, redshifted Fe K line from the combined spectrum of all images. We show that the redshifted Fe K line is only significant in the brighter image A. The X-ray flux fraction of image A is larger by a factor of 1.55 0.17 than the optical R-band flux fraction, indicating that image A is significantly enhanced in the X-ray band. We also find that the Fe K line and the continuum are enhanced by different factors. A microlensing event could explain both the energy-dependent magnification and the significant detection of Fe K line emission in the spectrum of image A only. In the context of this interpretation we provide constraints on the spatial extent of the inferred scattered continuum and reprocessed Fe K line emission regions in a LoBAL quasar.
1 Introduction
Recently, the gravitationally lensed (GL) quasar H 1413+117 (the Cloverleaf quasar) was observed for 40 ks with the Chandra X-ray Observatory (Oshima et al. 2001, Gallagher et al. 2002). The original goal of this observation (PI: M. Hattori) was to detect a cluster of galaxies that is thought to contribute to the lensing of this system (Kneib et al. 1998; Chae & Turnshek 1999). X-ray emission from the cluster lens was not detected. However, a remarkable iron emission feature at =6.210.16 keV (90% confidence) was discovered in the combined spectrum of all lensed images. This redshifted emission feature was interpreted as Fe K fluorescence from the far side of the quasar outflow.
H 1413+117 is a gravitationally lensed system consisting of four images of a distant (=2.55) broad absorption line quasar (Hazard et al. 1984; Magain et al. 1988). NICMOS-2 observations indicate that the lens is located approximately at the geometrical center of the four images. A firm spectroscopic redshift of the lens has yet to be obtained, however, a cluster of galaxies at a redshift of = 1.7 has been reported to contribute to the lensing of this system (Kneib et al. 1998). H 1413+117 was the first quasar to be detected in the submillimeter continuum and in carbon monoxide emission (Barvainis et al. 1995). H 1413+117 is also a low-ionization broad absorption line quasar (LoBAL) showing low-ionization lines of Al III and Fe III (Monier et al. 1998). LoBALs are BAL quasars that show one or more of the low-ionization lines of Mg II, Al III, Fe II and Fe III (e.g., Boroson & Meyers 1992). Its first X-ray detection was made with the ROSAT PSPC (Chartas et al. 2000). X-ray observations of BAL quasars indicate that they are heavily absorbed with measured column densities ranging between 1021 and 1024 cm-2. The extreme X-ray weakness of LoBALs, their low values of , and their high levels of UV continuum polarization are taken to imply that the absorbing gas in the direct line of sight to the quasar central engine is Compton-thick to X-ray radiation from the quasar nucleus and only scattered or reflected radiation can reach the observer along an indirect line of sight (Green et al. 2001; Gallagher et al. 2002).
Here, we present a re-analysis of the Chandra observation of H 1413+117 that places constraints on the spatial structure of the X-ray iron line and continuum scattering regions of this LoBAL quasar. The main difference between our and previous analyses is that we performed a spatial and spectral analysis of the individual X-ray images whereas previous X-ray studies were based on the combined spectrum of all images. Throughout this paper we adopt a cosmology in which = 75 km s-1 Mpc-1 and = 0.5.
2 Observations and Data Analysis
H 1413+117 was observed with Chandra for about 38 ks on 2000 April 19.
Details of this observation were described in Oshima et al. (2000) and
Gallagher et al. (2002).
For preparing the Chandra data for analysis we used the CIAO 2.2 and CALDB 2.12 products
provided by the Chandra X-ray Center (CXC).
To improve the spatial resolution we
removed a 025 randomization applied to the event positions
in the CXC processing and employed a sub-pixel resolution technique
developed by Tsunemi et al. (2001) and later improved by Mori et al. (2001).
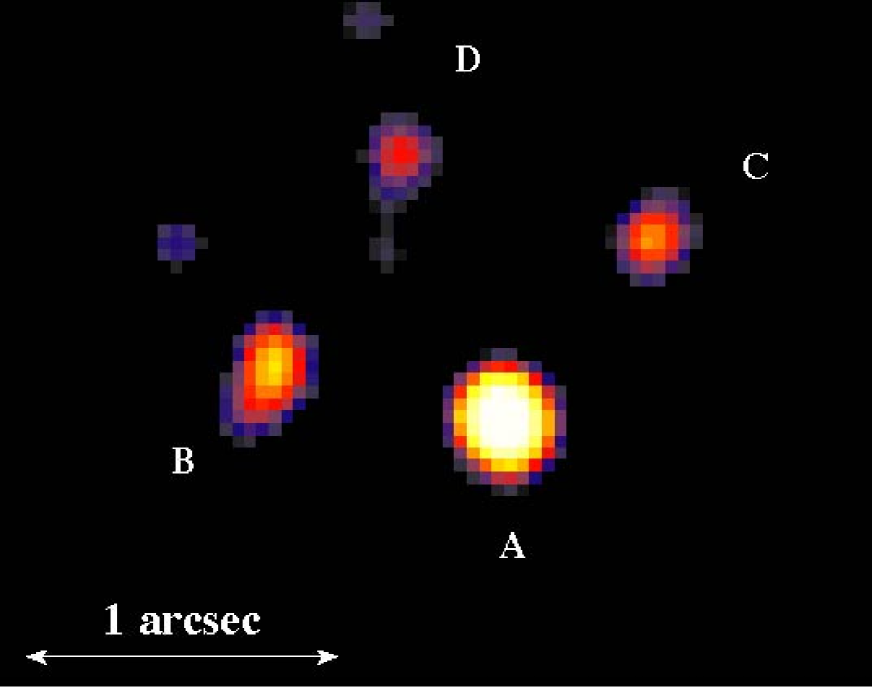
The deconvolved Chandra ACIS image of H 1413+117 is shown in Figure 1.
A comparison between the deconvolved X-ray image and the optical HST images
of H 1413+117 taken from the
CfA-Arizona Space Telescope Lens Survey (CASTLES)111HST images of H 1413+117 in the F160W, F702W and F814W HST bands are available from the
Castles web site: http://cfa-www.harvard.edu/glensdata/Individual/H1413.html.
clearly shows the enhancement of X-ray image A compared to that of
the optical image A.
The X-ray image positions are in agreement within errors with
those of the HST images indicating that the
X-ray emission used in our spatial-spectral analysis originates from the lensed quasar and not
from extended emission of the lensing galaxy or host galaxy.
To account for the recently discovered decay in the quantum efficiency of ACIS
(possibly caused by molecular contamination of the ACIS filters),
we have applied a time-dependent correction
implemented in the XSPEC model ACISABS1.1.222ACISABS is an XSPEC model contributed to the Chandra users software exchange world wide web-site
http://asc.harvard.edu/cgi-gen/cont-soft/soft-list.cgi. The ACIS quantum efficiency decay is insignificant at energies above 1 keV
and does not affect the main results of our analysis.
To estimate the X-ray flux ratios we modeled the Chandra images of A, B, C and D with
point spread functions (PSF’s) generated by the simulation tool MARX (Wise et al 1997).
The X-ray event locations were binned with a bin-size of 00246.
The simulated PSFs were fitted to the Chandra data by minimizing the
Cash -statistic formed between the observed and simulated images
of H 1413+117. The relative positions of the images were fixed to
the observed NICMOS values taken from CASTLES.
We find that the X-ray flux ratios in the full (0.2-8keV) band are
[B/A]full = 0.49 0.08, [C/A]full = 0.35 0.07,
[D/A]full = 0.37 0.07 and the number of detected X-ray events in
images A, B, C, and D were 147 13, 72 10, 52 8, and 54 9, respectively.
These flux ratios are consistent with the
values obtained from the deconvolved X-ray image shown in Figure 1.
For comparison the HST R-band flux ratios
are [B/A]R = 0.94 0.01, [C/A]R = 0.78 0.01,
[D/A]R = 0.74 0.01. The R-band magnitudes
were taken from the CASTLES Web site.
The flux fraction of image A, [A/(A+B+C+D)], is
a factor of 1.55 0.17 larger in the full X-ray band than in the HST R-band.
The earlier spectral analyses of H 1413+117 used the combined spectrum of all images.
In our re-analysis of the data we search for possible spectral variations between images
by extracting a spectrum for image A and a combined spectrum of images
B, C, and D. The low S/N of these data did not
allow us to extract individual spectra for images B, C, and D.
The spectrum of image A was extracted
from a circular region of radius 1′′centered 05 SW from the center of image A
to minimize contamination from the other images.
The combined spectrum of images B, C, and D was extracted from a circular region centered
on H 1413+117 with a radius of 25, excluding the source region of image A.
We determined corrections to the ancillary response files by simulating
the spectra of point sources at the locations of the images within the
apertures used in our analysis.
For our simulations we used XSPEC to generate the source spectra and the ray-tracing tool MARX to model the
dependence of photon scattering with energy.
The background was extracted from a source-free
annulus centered on H 1413+117 with inner and outer radii of 10′′ and
30′′, respectively. All errors reported below are at the 90%
confidence level unless noted otherwise.
A variety of models were fitted to the spectrum of image
A and the combined spectrum of images B, C, and D,
employing the software tool XSPEC v11.2 (Arnaud 1996).
Spectral fits were performed in the 1–8 keV bandpass.
Given the relatively low-S/N of the spectra we performed fits
using the -statistic (Cash 1979) and compared the results with those obtained
using the statistic. Spectral fits performed with the -statistic
do not require binning of the data and produce reliable estimates of the
best-fit parameters and their errors for low-S/N spectra. One of the limitations
of the -statistic is that it cannot provide a goodness-of-fit measure.
However, simple analytic expressions do exist
for estimating the goodness-of-fit when using the statistic.
We therefore used fits performed with the statistic
to evaluate the probabilities of exceeding the derived values.
For the spectral fits performed with the statistic we binned the data to
have a minimum of twelve counts per bin.
We did not find any significant differences
between the estimated best fit parameters and their associated errors
provided by the -statistic and the statistic.
In Table 1 we list the best fit parameters and their errors based on fits using the -statistic.
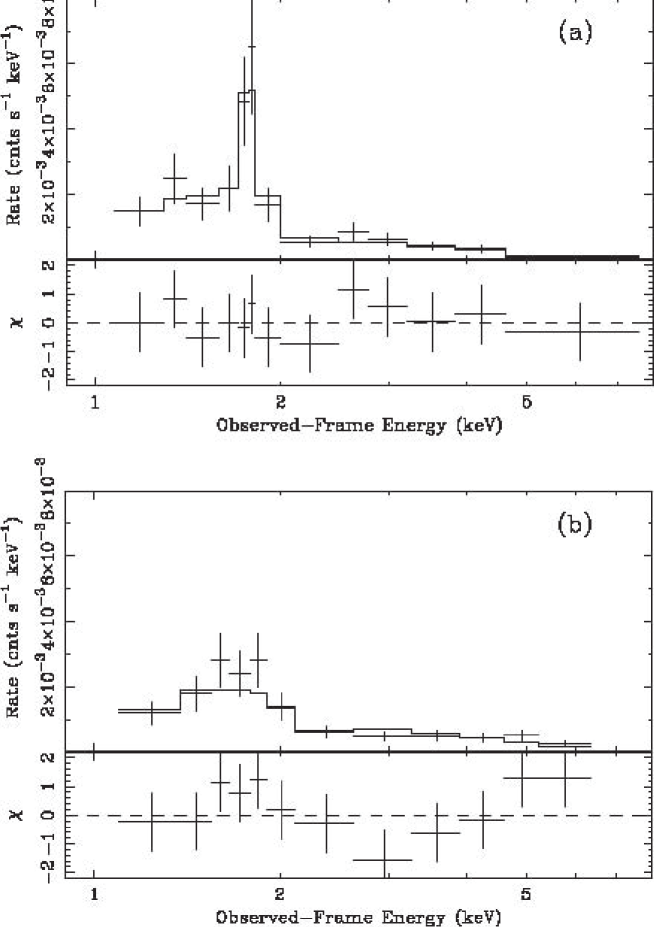
The spectra were initially fitted individually with a model consisting of a simple power law with Galactic absorption due to neutral gas with a column density of = 1.8 1020 cm-2 (Stark et al. 1992). The model also included neutral intrinsic absorption at . The fit residuals in image A showed an emission feature between 1.65–1.85 keV that led to an unacceptable fit, with a = 13.56 for 10 degrees of freedom (dof). Only the spectrum of image A shows clear evidence of this strong emission line. We modeled the residual feature in image A by considering a Gaussian component near 1.7 keV in the observed frame. This led to a significant improvement in fit quality at the 98% confidence level (according to the -test, ) with a = 4.0 for 7 dof. In Figure 2a we show the spectrum of image A. Protassov et al. (2002), have recently argued that the -test cannot be applied when the null values of the additional parameters fall on the boundary of the allowable parameter space. They proposed a Monte Carlo approach to determine the distribution of the statistic. We followed this approach and constructed the probability density distribution of the -statistic between spectral fits 1 and 2 of Table 1. Our Monte Carlo simulations indicate that the probability of obtaining an value of 5.6 or greater is 1.5 10-2 close to the result found by using the analytic expression for the distribution of the -statistic. The best-fit rest-frame energy of the emission feature is = 6.3 keV. Adding an unresolved Gaussian line to the combined spectrum of images B, C, and D leads to a slight improvement in fit quality at the 86% confidence level (according to the -test). The combined observed-frame spectrum of images B, C, and D fit with Galactic absorption, neutral absorption at the source, and a power-law model is shown in Figure 2b. The best-fit values for the photon indices in the spectrum of image A and the combined spectrum of images B, C, and D, are = 1.80.8 and , respectively (see fits 1 and 4 of Table 1). Our fits support the presence of an intrinsic absorber towards image A with a column density of = (2.32.2) 1023 cm-2 (see fit 1 of Table 1). We also find a significant intrinsic absorber from the fit to the combined spectrum of images B, C, and D of = (3) 1023 cm-2. The observed column in images B, C, and D (see fit 4 of Table 1) may represent the column density perpendicular to the outflow rather that along the outflow as shown in Figure 3 of Oshima et al. (2001). They estimated the column along the flow to be cm-2. More complex models including ionized absorption or partial covering were not considered in our analysis due to the low S/N of the available spectrum and the high of H 1413+117 which results in several absorption edges due to Ne, O, N, and C being redshifted outside the Chandra bandpass.
We performed simultaneous fits to the spectrum of image A and the combined spectrum of images B, C, and D to estimate the significance of the difference in the Fe K lines. The common spectral model for the fit consisted of (a) Galactic absorption due to neutral gas with a column density of = 1.8 1020 cm-2, (b) neutral absorption at the redshift of the quasar, (c) a simple power law, and (d) a Gaussian component near 1.7 keV in the observed frame. The photon index and the energies and widths of the Fe K lines were linked as common parameters in this spectral fit. The best-fit parameters and 90% confidence errors are presented in Table 1. The rest-frame equivalent widths and 90% confidence levels of the lines in the spectrum of image A and the combined spectrum of images B, C, and D are = 1.27 keV and = 0.20 keV, respectively. In Figure 3 we show the 68.3% and 85% confidence contours of the normalizations of the Fe K lines versus the rest-frame Fe K line energy. We chose to show the 85% contours instead of the commonly used 90% contours because the 85% contours touch exactly in this case. Based on these contours, the probability that the iron lines in the spectrum of image A and the combined spectrum of images B, C, and D have strengths that are consistent with each other is less than 0.02. For this confidence contour plot we fixed the parameters of the power-law component of the model to their best-fit values listed in fit 5 of Table 1. We conclude that the Fe K line in the spectrum of image A is significantly enhanced by a factor of about six from that of the combined spectrum of images B, C, and D.
3 Discussion
Our re-analysis of the X-ray spectra of the individual lensed images of H 1413+117 indicates the presence of a microlensing event in image A because (a) the flux fraction of image A, [A/(A+B+C+D)], is a factor of 1.55 0.17 larger in the X-ray band than what was detected in the HST R-band, (b) a redshifted narrow iron line is present with a relatively high significance only in the spectrum of image A. To obtain additional insight on the possible energy dependence of the magnification of image A, we estimated relative enhancements of image fluxes in the continuum and iron-line emission components based on fit 5 of Table 1. Specifically, we find that the ratio of the X-ray fluxes of image A and the combined images B, C and D in the iron line component is [A/(B+C+D)] 1.7 at the 85% confidence level (see Figure 2). The ratio of the X-ray flux densities at 1 keV (observed frame) in the continuum component is [A/(B+C+D)]Cont = 0.8 0.2 (90% confidence intervals). These values differ significantly from the HST R-band flux ratio of [A/(B+C+D)]R=0.410.01 which is expected to be less affected by a microlensing event produced by a star or group of stars in the foreground lensing galaxy since the characteristic sizes of the X-ray continuum emission regions of quasars are expected to be considerably less than the sizes of the optical R-band emission regions. Specifically, variability studies indicate that the sizes of the X-ray and optical continuum emission regions are 4 cm and 4 cm, respectively (e.g., Chartas et al. 2001; Dai et al 2002; Wyithe et al. 2000). We note that since the flux fraction of image A in the X-ray continuum is greater than the flux fraction in the R band, the large equivalent width of the Fe line in image A is not caused by a decrease in the X-ray continuum but is more likely produced by an amplification of the flux of the line.
A scenario in which intrinsic variability is the cause of the detection of a strong iron line in only image A and a significantly weaker line in the combined spectrum of images B, C and D requires fine tuning such that the flare of the iron line needs to occur within a certain window in time for it to be detected with a large in only one image and the flare must last for only a few days. Our simple two singular isothermal sphere lens model for H 1413+117 predicts that image B leads images C, A, and D by 5 days, 9 days and 16 days respectively. A similar lens model by Chae & Turnshek (1999) was found to reproduce the observed relative amplifications fairly accurately. Another strong argument against the intrinsic variability interpretation is that changes of factors of 6 in the equivalent width of a fluorescent Fe K line in a Seyfert 1 galaxy over periods of a few days have not been detected to date (e.g., Markowitz, Edelson & Vaughan 2003; Gliozzi, Sambruna & Eracleous 2003; Lee et al. 2000; Leighly 1999). We anticipate that the amplitude of Fe K line variability to be less in quasars than in Seyfert 1 galaxies due to the larger sizes and luminosities of quasars. X-ray variability, at least of the continuum emission in Seyfert 1 galaxies and quasars, is found to be anticorrelated with X-ray luminosity (e.g., Nandra et al. 1997; Turner et al. 1999; George et al. 2000; Dai et al. 2003). A more likely explanation of the observed energy dependent magnification in the X-ray band and the enhancement of image A in the X-ray band compared to that in the optical is a microlensing event in image A. Such an event will not lead to time-delayed magnifications in the remaining images and therefore can explain the non-detection of the Fe K line in the remaining images. A characteristic size scale commonly used in microlensing analysis is the projected Einstein ring radius of the star, . Emission regions with a size significantly larger than will not be affected by microlensing, whereas, emission regions less than will be significantly magnified. For H 1413+117 with lens and source redshifts of 1.7 and 2.55 respectively, and assuming an isolated star, the Einstein-ring radius on the source plane is 2 1016 cm.
The observed enhancement of the Fe K line implies that the size of this iron line region is . The enhanced Fe K emission observed in image A may be produced by microlensing of Fe K fluorescence from the far side of the outflow. Assuming the Murray et al. (1995) disk-wind geometry for BALQSOs we expect that Fe K fluorescence from the near-neutral accretion disk, thought to be emitted (based on modeling of the Fe K line profiles in several Seyferts) from annuli of inner radii of 6 and outer radii of 30 (e.g., Nandra et al. 1997), where and is the mass of the black hole of H 1413+117, will be heavily absorbed by the quasar outflow. The far side of the wind is a more plausible source of the Fe K line because our line of sight to it does not traverse a significant absorbing column. We estimate the size of the microlensed fluorescent region of the quasar outflow to be . We have assumed a minimum launching radius for the UV BAL absorber of cm based on hydrodynamical simulations performed by Proga et al. (2000). To estimate we assumed the lensed bolometric luminosity of = 3.9 1047 erg s-1 (Granato et al. 1996), is the magnification factor ranging between 10 and 23 based on lens models of this system (e.g., Venturini & Solomon 2003, Chae et al. 1999), = , is the Eddington luminosity and is thought to range between 0.1 and 1 in quasars. We find, = 3.9 1047 erg s-1, = 4.5 1014 cm, = 3 109 and = 5.5 1016 cm. We note that with the values we have adopted the product is approximately equal to 1. The relatively smaller magnification of the observed X-ray continuum emission compared to the line emission suggests that the size of the region producing the observed X-ray continuum emission is larger than .
The processes thought to contribute to the continuum X-ray emission in radio-quiet quasars include inverse Compton scattering of photons in disk coronae by UV photons originating in the accretion disk, resulting in an increase in the energy of the upscattered photons from the UV range to the 2-10 keV range. At rest energies above 10 keV, Compton scattering of photons from the disk corona by the disk becomes significant. Variability studies of radio-quiet quasars with similar black hole masses to H 1413+117 indicate that the size of the emission region responsible for these continuum processes described above is of order 1015-16 cm (e.g., Chartas et al. 2001; Dai et al 2002.) This, combined with our conclusion that the observed X-ray continuum emission must have a size suggests that the X-ray continuum emission in H 1413+117 is not viewed directly but most likely is reflected in a scattering region with a characteristic size of .
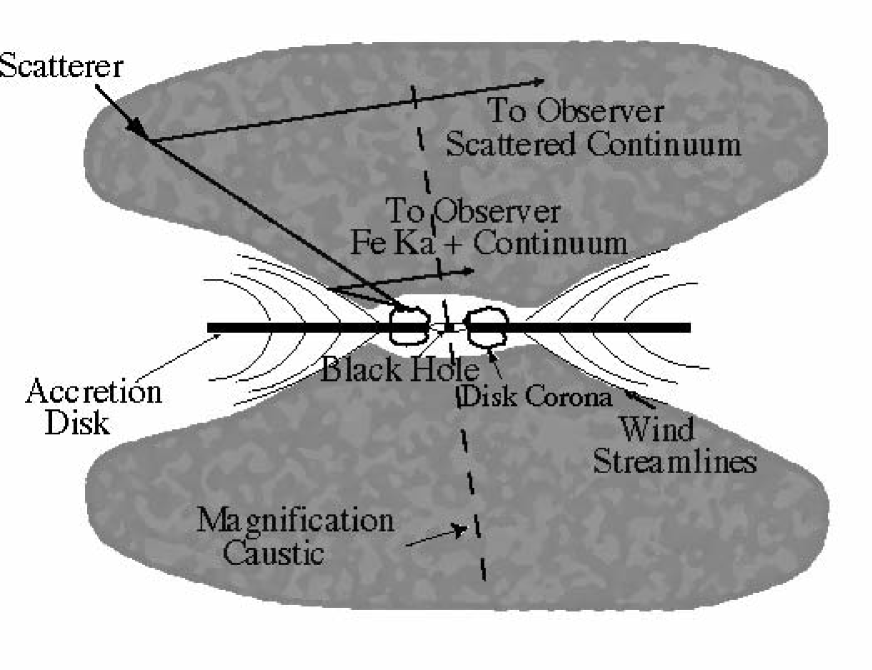
Our constraint on the size of the scattering region is supported by recent HST observations of H 1413+117; using imaging polarimetry with the HST, Chae et al. (2001) detected a 0.07 mag dimming and a change of the linear polarization component of image D relative to the other images during the June 1999 observation which they interpreted as microlensing of a portion of a large-scale, asymmetric continuum scattering region seen in polarized light. They also conclude that the microlensing caustic during their observations was located away from the continuum emitting region. They independently conclude that the scattering region is 10 cm 2 1016 cm. We also note that based on the simulations of Witt, Mao, and Schechter (1995) images A and D of H 1413+117 have the largest probability of being microlensed due to the relatively large optical depths for microlensing events along these lines of sight. In Figure 4 we present a sketch of a scenario that can explain the observed X-ray spectra of H 1413+117. For simplicity the caustic plane is oriented perpendicular to the observer’s line of sight. In this proposed scenario the microlensing caustic is centered near the black hole and the observed continuum emission in all images originates predominatly from a large scale scattering region. We expect the continuum X-ray emission region and the Fe K fluorescence from the near-neutral accretion disk to be significantly absorbed along our line of sight. This is supported by the fact that H 1413+117 is a LoBAL quasar and recent studies indicate that their X-ray spectra may be reflection/scattered dominated (e.g., Green et al., 2001; Gallagher 2002). Based on the anticorrelation between and 2500 luminosity (Vignali et al. 2003) for radio-quiet quasars (RQQs) we estimate an average value of -1.6 0.2 for a RQQ with = 6.1 1030 erg s-1 Hz-1 of H 1413+117. In a recent survey of high redshift lensed quasars Dai et al. (2003) calculated ( corrected) = for H 1413+117 based on the X-ray flux of the images B, C, and D (image A was not included since it is likely microlensed) confirming the X-ray weakness of this LoBAL. The estimated values of are highly dependent on the assumed model for the intrinsic absorption. The observed X-ray emission in image A also contains significantly magnified Fe K emission originating from the far side of the flow and less magnified emission from a portion of the large scale scattering region.
Another possiblity is that the microlensing caustic during the Chandra observations was not centered on the black hole but located further away than the X-ray continuum emission region of the inner accretion disk. In this scenario the observed continuum emission in all images originates from both the continuum-emitting region near the inner accretion disk and the large-scale scattering region. The X-ray flux observed in image A also contains magnified emission from the far side of the outflow and magnified emission from a portion of the large scale scattering region. Since the microlensing caustic in this case does not overlap with the central region of the black hole complete obscuration of the emission from the inner region of the accretion disk is not required to explain the observed energy-dependent magnification. To summarize, the various emission regions referred to in this analysis in order of smallest to largest regions are: (a) A very small-scale (), possibly obscured Fe K fluorescence region. (b) A small-scale () portion of the reflection region from the far side of the outflow, which is relatively cold and neutral, slightly redshifted, and is highly amplified by microlensing. This region causes the large equivalent width for the iron line in image A. (c) A small-scale () X-ray continuum emission region originating near the inner-accretion disk. (d) A mid-scale () optical continuum R band emission region, and, (e) A large-scale () X-ray and optical scattering region which is highly ionized and reflects the X-ray source without creating a fluorescent iron line.
Optical spectra of H 1413+117 taken with the SILFID spectrograph at the Canada-France-Hawaii (CFH) telescope in 1989 (Angonin et al. 1990) and the HST Space Telescope Imaging Spectrograph in 2000 (spectra taken by E. M. Monier cited in Chae et al. 2001) indicate that a microlensing event along the sight-line of image D was in progress for at least a duration of 11 years. This timescale is consistent with the estimate by Witt, Mao, & Schechter (1995) of the time for the source to cross an Einstein radius for H 1413+117. We may, therefore, expect that the possible microlensing event in image A persists for a similar timescale.
The detection of the iron line is possible perhaps because of an ongoing microlensing event in image A. Future observations of H 1413+117 with Chandra may provide a confirmation of the microlensing interpretation if a significant variation in the continuum and/or iron line flux ratios in the images is detected. This confirmation would validate our microlensing models and our conclusions regarding the relative size of the continuum and iron line scatterers.
References
Angonin, M.-C., Vanderriest, C., Remy, M., & Surdej, J. 1990, A&A, 233, L5
Arnaud, K. A. 1996, ASP Conf. Ser. 101: Astronomical Data Analysis Software and Systems V, 5, 17
Barvainis, R., Antonucci, R., Hurt, T., Coleman, P., & Reuter, H.-P. 1995, ApJ, 451, L9
Boroson, T. A. & Meyers, K. A. 1992, ApJ, 397, 442
Cash, W. 1979, ApJ, 228, 939
Chartas G., 2000, ApJ, 531, 81.
Chartas, G., Dai, X., Gallagher, S. C., Garmire, G. P., Bautz, M. W., Schechter, P. L., & Morgan, N. D. 2001, ApJ, 558, 119
Chartas, G., Brandt, W. N., Gallagher, S. C., & Garmire, G. P. 2002, ApJ, 579, 169
Chartas, G., Brandt, W. N., Gallagher, S. C., & Garmire, G. P. 2003, Astron. Nachr., 324, 173
Chae & Turnshek 1999, ApJ, 514 587
Chae, K., Turnshek, D. A., Schulte-Ladbeck, R. E., Rao, S. M., & Lupie, O. L. 2001, ApJ, 561, 653
Dai, X., Chartas, G., Agol, E., Bautz, M. W., & Garmire, G. P. 2003, ApJ, 589, 100
Dai, X., Chartas, G., Eracleous, M., & Garmire, G. P. 2003, submitted to ApJ
Gallagher, S. C., Brandt, W. N., Chartas, G., & Garmire, G. P. 2002, ApJ, 567, 37
George, I. M., Turner, T. J., Yaqoob, T., Netzer, H., Laor, A., Mushotzky, R. F., Nandra, K., & Takahashi, T. 2000, ApJ, 531, 52
Gliozzi, M., Sambruna, R. M., & Eracleous, M. 2003, ApJ, 584, 176
Granato, G. L., Danese, L., & Franceschini, A. 1996, ApJ, 460, L11
Green, P. J., Aldcroft, T. L., Mathur, S., Wilkes, B. J., & Elvis, M. 2001, ApJ, 558, 109
Hasinger, G., Schartel, N., & Komossa, S. 2002, ApJ, 573, L77
Hazard, C., Morton, D. C., Terlevich, R., & McMahon, R. 1984, ApJ, 282, 33
Kneib, J.-P., Alloin, D., & Pello, R. 1998, A&A, 339, L65
Lee, J. C., Fabian, A. C., Reynolds, C. S., Brandt, W. N., & Iwasawa, K. 2000, MNRAS, 318, 857
Leighly, K. M. 1999, ApJ, 125, S317
Magain, P., Surdej, J., Swings, J.-P., Borgeest, U., & Kayser, R. 1988, Nature, 334, 325
Markowitz, A., Edelson, R., & Vaughan, S. 2003, ApJ, in press
Monier, E. M., Turnshek, D. A., & Lupie, O. L. 1998, ApJ, 496, 177
Mori, K., Tsunemi, H., Miyata, E., Baluta, C., Burrows, D. N., Garmire, G. P., & Chartas, G. 2001, in ASP Conf. Ser. 251, New Century of X-Ray Astronomy, ed. H. Inoue & H. Kunieda (San Francisco: ASP), 576
Nandra, K., George, I. M., Mushotzky, R. F., Turner, T. J., & Yaqoob, T. 1997, ApJ, 476, 70
Nandra, K., George, I. M., Mushotzky, R. F., Turner, T. J., & Yaqoob, T. 1997, ApJ, 477, 602
Oshima, T., Mitsuda, K., Fujimoto, R., Iyomoto, N., Futamoto, K., Hattori, M., Ota, N., Mori, K., Ikebe, Y., Miralles, J. M., & Kneib, J.-P. 2001, ApJ, 563, L103
Protassov, R., van Dyk, D. A., Connors, A., Kashyap, V. L., & Siemiginowska, A. 2002, ApJ, 571, 545
Shalyapin, V. N. 2001, Astronomy Letters, 27, 150
Stark, A. A., Gammie, C. F., Wilson, R. W., Bally, J., Linke, R. A., Heiles, C., & Hurwitz, M. 1992, ApJS, 79, 77
Tsunemi, H., Mori, K., Miyata, E., Baluta, C., Burrows, D. N., Garmire, G. P., & Chartas, G. 2001, ApJ, 554, 496
Turner, T. J., George, I. M., Nandra, K., & Turcan, D. 1999, ApJ, 524, 667
Vignali, C., Brandt, W. N., Schneider, D. P., Anderson, S. F., Fan, X., Gunn, J. E., Kaspi, S., Richards, G. T., & Strauss, M. A., 2003, AJ, 125, 2876
Wise, M. W., Davis, J. E., Huenemoerder, Houck, J. C., Dewey, D. Flanagan, K. A., and Baluta, C. 1997, The MARX 3.0 User Guide, CXC Internal Document available at http://space.mit.edu/ASC/MARX/
Witt, H. J., Mao, S., & Schechter, P. L. 1995, ApJ, 443, 18
Wyithe, J. S. B., Webster, R. L., Turner, E. L., & Mortlock, D. J. 2000, MNRAS, 315, 62
Yonehara, A. 2001, ApJ, 548, L127
| TABLE 1 | ||||
|---|---|---|---|---|
| RESULTS FROM FITS TO THE SPECTRA OF H 1413+117 | ||||
| Fit | Source1 | Model | Parameter2 | Value3 |
| 1 | H 1413+1174 | PL, neutral absorption | 1.8 | |
| (Image A) | at source, and a Gaussian | (2.3) 1023 cm-2 | ||
| emission line at source. | Eline | 6.3 keV | ||
| The fit is performed to the | 0.14 keV | |||
| spectrum of image A of H1413. | EWline | 1.1 keV | ||
| C-statistic/nbins5 | 4.5/13 | |||
| 4.0/7 | ||||
| 0.78 | ||||
| 2 | H 1413+117 | PL, neutral absorption | 2.7 | |
| (Image A) | at source. | (5) 1023 cm-2 | ||
| The fit is performed to | C-statistic/nbins | 19.2/13 | ||
| the spectrum of image A of H1413. | 13.6/10 | |||
| 0.19 | ||||
| 3 | H 1413+117 | PL, neutral absorption | 1.7 f7 | |
| (Images B + C + D ) | at source, and a narrow Gaussian | (3) 1023 cm-2 | ||
| emission line at source. | Eline | 6.4 keV | ||
| The fit is performed to the | 0.01 keV f | |||
| the combined spectrum | EWline | 0.35 keV | ||
| of images B, C, and D. | C-statistic/nbins | 10.64/12 | ||
| 7.42/8 | ||||
| 0.49 | ||||
| 4 | H 1413+117 | PL, neutral absorption | 1.7 | |
| (Images B + C + D) | at source. | (4) 1023 cm-2 | ||
| The fit is performed to | C-statistic/nbins | 10.64/12 | ||
| the combined spectrum | 9.87/9 | |||
| of images B, C, and D. | 0.36 | |||
| 5 | H 1413+117 | PL, neutral absorption | 1.6 | |
| Simultaneous fit | at source and a narrow Gaussian | (2.4) 1023 cm-2 | ||
| to images A and | emission line at source. | Eline | 6.3 keV | |
| B+C+D | The fit is performed | 0.06 keV | ||
| simultaneously to the | EWA | 1.27 keV | ||
| the combined spectrum | EWBCD | 0.20 keV | ||
| of image A and | C-statistic/nbins | 22.5/27 | ||
| the combined spectrum | 18.0/27 | |||
| of images B, C, and D. | 0.52 | |||
1All model fits include Galactic absorption towards the source (Stark et al. 1992).
2All absorption-line parameters are calculated in the quasar rest frame.
3All errors are for 90% confidence with all
parameters taken to be of interest except absolute normalization.
All best fit parameters and associated errors are taken from fits using the C-statistic.
4For results on the combined
spectrum of all images of H 1413+117 see also Oshima et al. (2000) and Gallagher et al. (2002).
5 nbins is the number of pulse height analysis (PHA) bins in the spectrum.
6 is the probability of exceeding for degrees of freedom.
7 The symbol f indicates that the parameter is frozen in the spectral fit.