Missing Massive Stars in Starbursts: Stellar Temperature Diagnostics and the IMF
Abstract
Determining the properties of starbursts requires spectral diagnostics of their ultraviolet radiation fields, to test whether very massive stars are present. We test several such diagnostics, using new models of line ratio behavior combining Cloudy, Starburst99 and up-to-date spectral atlases (Pauldrach et al., 2001; Hillier & Miller, 1998). For six galaxies we obtain new measurements of Hei µm/Br, a difficult to measure but physically simple (and therefore reliable) diagnostic. We obtain new measurements of Hei µm/Br in five galaxies. We find that Hei µm/Br and [Oiii]/H are generally unreliable diagnostics in starbursts. The heteronuclear and homonuclear mid–infrared line ratios (notably [Neiii] µm / [Neii] µm) consistently agree with each other and with Hei µm/Br; this argues that the mid–infrared line ratios are reliable diagnostics of spectral hardness. In a sample of starbursts, [Neiii]/[Neii] is significantly lower than model predictions for a Salpeter IMF extending to M☉. Plausible model alterations strengthen this conclusion. By contrast, the low–mass and low–metallicity galaxies II Zw 40 and NGC 5253 show relatively high neon line ratios, compatible with a Salpeter slope extending to at least – M☉. One solution for the low neon line ratios in the high–metallicity starbursts would be that they are deficient in M☉ stars compared to a Salpeter IMF. An alternative explanation, which we prefer, is that massive stars in high–metallicity starbursts spend much of their lives embedded within ultra–compact Hii regions that prevent the near– and mid–infrared nebular lines from forming and escaping. This hypothesis has important consequences for starburst modelling and interpretation.
1 INTRODUCTION
In the very local () Universe, the circumnuclear regions of just four galaxies (M82, NGC 253, NGC 4945, and M83) are responsible for of the current massive star formation (Heckman, 1997). In these “circumnuclear starburst galaxies”, the star formation is confined to the inner to kpc, in a dense, gas–rich disk where star formation rates can reach M☉ yr-1 (Kennicutt, 1998). If the starburst initial mass function (IMF) includes significant numbers of low–mass stars, then each starburst is currently building up the stellar component of its host galaxy as well. A starburst enriches and heats its interstellar medium, as well as the local intergalactic medium. Starbursts can also drive large–scale winds that eject interstellar gas, presumably casting metals into the voids and heating the gas between galaxies. Starburst galaxies thus play a number of important roles in galaxy evolution.
If starbursts could be dated, then a sequence could be pieced together, charting starburst evolution from triggering to post–starburst quiescence. Starburst ages are most directly determined by understanding the population of rapidly evolving massive stars. The feedback effect of a starburst on its gas supply is transmitted through massive stellar winds and supernovae–driven superwinds. Thus, understanding the evolution of starbursts and their effects on the interstellar and intergalactic media both critically depend on understanding the populations of massive stars.
Unfortunately, since starburst galaxies are too far away to count individual stars, the high-mass IMF must be determined indirectly, in ways that are model–dependent and crude. Leitherer (1998) reviews these techniques and divides them into three categories: techniques to determine a lower mass cutoff by measuring the mass–to–light ratio; to find the slope of the IMF above M☉; and to determine an upper mass cutoff from the hardness of the ionizing radiation field.
The ionizing spectrum is set by the starburst’s age, IMF, and star formation history. Consequently, the shape of the ionizing field spectrum is an important boundary condition on starburst models (Rieke, 2000). Ionizing continua are often parameterized by an effective temperature (Teff), as if one stellar spectral type were responsible for the flux. The UV spectrum cannot be measured directly because little ionizing continuum radiation escapes from a starburst (Leitherer et al., 1995). Instead, the presence or absence of massive stars must be inferred using spectral diagnostics. Extinction in circumnuclear starbursts means that infrared diagnostics are preferred.
Many line ratios have been used to estimate starburst Teff: forbidden line ratios, mixed forbidden–recombination line ratios like , optical lines of Hei, the near–infrared line Hei µm, and mid–infrared fine structure lines for example. Unfortunately, these diagnostics disagree by to K (Vanzi & Rieke, 1997; Thornley et al., 2000; Rieke, 2000), and suffer variously from intrinsic faintness, susceptibility to shocks and reddening, dependence on nebular conditions, and uncertain atomic constants.
In this paper, we use the ratio of Hei µm to Brackett 10 (Br) to diagnose the hardness of starburst ionizing fields. The faintness of the Hei µm line restricts its measurement to nearby galaxies with strong emission lines. In these galaxies, the Hei/Br ratio should allow estimates of Teff that are largely independent of reddening or nebular conditions. We then use Hei/Br to assess the accuracy of diagnostics that can reach distant galaxies. Using diagnostics we find reliable, we confirm that few massive starburst galaxies have high–excitation spectra. While this may occur because the IMF is biased against high–mass stars, we propose that high–excitation spectra are scarce because the massive stars spend most of their main sequence lifetimes embedded in ultracompact Hii regions.
2 OBSERVATIONS, DATA REDUCTION, AND CALIBRATION
To assist in evaluating Teff diagnostics, we have obtained new measurements of Hei µm/Br. This diagnostic is unaffected by metallicity, shocks, or level pumping. Regrettably, the Hei µm line is very weak, less than the intensity of Br. Thus, the Hei µm/Br ratio can only be measured in nearby starbursts with bright lines.
For our sample, we chose six nearby starburst galaxies with large measured Br fluxes and, when possible, supporting observations in the literature such as mid–infrared spectra. Near–infrared spectra were obtained on the nights of 2001 April 6 and 7, using the FSPEC near–infrared spectrometer (Williams et al., 1993) on the Steward Observatory Bok m telescope.
Table 2 lists target objects and integration times. All observations were taken with the lines mm-1 grating, which produces effective resolutions of at µm and at µm. The slit was ″ by ″. All exposures were guided by hand using an H–band camera that images the mirrored slit. Spectra of the six targets were obtained in H–band ( µm). K–band (µm) spectra were also obtained unless high–quality spectra already existed in the literature.
The angular sizes of the nuclear starburst regions are small compared to the length of the FSPEC slit. For each integration, nuclear spectra were obtained at four successive positions along the slit. For the calibration stars, six spectra were taken along the slit. (For brevity, we will call each resulting two-dimensional spectrum a “frame”, and each group of frames in an integration a “set”.)
2.1 Data Reduction
The infrared Hi and Hei lines are faint, making the data reduction approach critical. We therefore describe it in detail. The data were reduced using iraf.111IRAF is distributed by the National Optical Astronomy Observatories, which are operated by the Association of Universities for Research in Astronomy, Inc., under cooperative agreement with the National Science Foundation. First, dark frames were subtracted from the object frames. Each frame was then flat–fielded using a median–averaged lamp flat. The airglow and bias were removed by differencing neighboring frames. For the first and last frames of a set, the neighbor was subtracted. For each middle frame, the mean of the immediately–bracketing frames was subtracted. For the calibration stars the subtraction was simple. Over the longer integration times required for the galaxies ( minutes per frame), the sky background is variable. Accordingly, prior to subtraction, we scaled each galaxy frame by a constant, generally within a percent of unity, to optimize the sky cancellation. This technique of differencing neighboring two–dimensional spectra usually removes the sky emission lines accurately. For a few galaxies, the resultant sky subtraction was not adequate. In these exposures, the sky lines in a set of frames were offset along the dispersion axis by to pixels, suggesting a slight, monotonic shift in the grating tilt. To improve the cancellation, we used onedspec.identify and onedspec.reidentify to fit, for each frame, a linear shift in the position of the airglow lines with respect to a reference frame. We then used images.imgeom.imshift to shift the frames, using linear interpolation, to zero the offsets. This was done for H–band frames of NGC 4861, He 2–10, NGC 4102, and NGC 3504 as needed.
The next step in the reduction was to combine the frames within a set. Offsets were determined by summing each frame down the dispersion axis and measuring the location of the continuum peak in the resulting one-dimensional image. Frames were magnified by a factor of six to permit fractional pixel shifts, which minimizes smearing of the data and maximizes preservation of flux during the next step of straightening. Magnified images were then remapped to make the spatial axis perpendicular to the dispersion axis. This remapping is accomplished by fitting the tilt of the dispersion axis as a cubic polynomial; this function is well–defined and does not vary with time. Straightening the spectra in this manner simplifies subsequent extraction, stacking, and wavelength calibration (Engelgracht, 1996).
Frames were then median combined with imcombine using no rejection, and using scale and weight factors determined from each frame’s median continuum strength (generally within of unity). Frames were then de-magnified. Bad pixels were replaced with the average of their immediate two neighbors along the dispersion axis.
A similar procedure created two–dimensional sky frames suitable for wavelength calibrations. The frames were straightened and median combined as before, but without weights, scales, or offsets. The resulting images have no continua, only sky lines. A high signal–to–noise 1–D sky spectrum was then created by taking, at each wavelength, the median value over all spatial positions.
We then extracted the spectra of the galaxies and calibration stars. Using apall in iraf, we traced each continuum interactively using low–order Legendre polynomials. The aperture width was chosen to be where the signal at the brightest part of the continuum dropped to of peak. No extra background was subtracted at this point; trials with additional subtraction (to remove residual sky lines) added more noise than they eliminated. Spectra were extracted from the sky frames by using the apertures fitted for the corresponding objects.
Next, the spectra were corrected for telluric absorption. To do this, each galaxy spectrum was first divided, in pixel space, by the spectrum of a calibration star. When a target observation was bracketed by calibration star observations, the average of the two stellar spectra was divided into the target spectrum. Otherwise, the calibration spectrum taken closest in time to the target was used. Calibration stars were dwarfs of spectral types F6 to G0, most within of the target object. Such stars have relatively featureless intrinsic spectra at µm, so their observed spectra reflect the variable absorption of the Earth’s atmosphere.
We wavelength–calibrated the sky spectra of the galaxies, using onedspec.identify and tabulated vacuum wavelengths of the OH lines calculated by C. Kulesa (1996, private communication). Scatter in the wavelength calibration of the galaxies was less than Å, and usually below Å.
Wavelength solutions of the sky spectra were transferred to the [target/calibrator] spectra. Due to the longer integration times, the sky spectra derived from galaxy frames give wavelength solutions more precise than those derived from sky spectra of the star frames. The wavelength solution is quite stable with time.
The calibration stars are not completely featureless; their metal absorption lines produce spurious emission lines in the [target/calibrator] spectra. To correct for this effect, we multiplied the [target/calibrator] spectra by the solar spectrum, which has been corrected for atmospheric absorption (Livingston and Wallace, 1991). The solar spectrum was first normalized and broadened to Å in H and Å in K to match our observations. Since the calibration stars are similar in spectral type to the Sun, the solar multiplication cures the final spectrum of the metal lines and the global Rayleigh–Jeans slope that the calibration star introduced. The resulting spectrum is [target/calibrator][]. This procedure is explained more fully by Maiolino, Rieke, & Rieke (1996).
At this point, NGC 4861 and NGC 4214 still showed residual sky lines. The spectra were improved by subtracting a scaled, extracted sky spectrum. For both galaxies, Br and Hei µm are uncontaminated by OH lines, whereas Br is somewhat contaminated in NGC 4861 and seriously contaminated in NGC 4214 (the lowest redshift galaxy in our sample). Accordingly, we will consider only Br in lieu of both Br and Br for these two galaxies.
2.2 Combining Spectra
For the H–band spectra, we observed targets for hr between calibrators. Because our total integration times on each galaxy were substantially longer than this, the spectra must be combined. To do this, we used onedspec.scombine, median combining groups of images, and average combining otherwise.
The Hei µm and Br lines were covered by different grating settings. We spliced together the two grating settings for each target by scaling the µm spectrum by a constant until it matched the flux level of the µm spectrum in the region of overlap. Scaling constants were between and . We then joined the spectra using scombine.
2.3 Subtracting the Stellar Continuum
The nebular lines we seek sit atop a stellar continuum, whose absorption lines can mask or alter the emission line ratios. Before faint emission line fluxes can be measured, the stellar continuum must be removed.
The lines of interest at K (Br and Hei µm) are strong enough that subtraction of the stellar continuum is not necessary. For H–band, we used a stellar continuum template made by combining the stars from a stellar atlas (observed with the same spectrometer: V. D. Ivanov, in preparation) which minimized the residuals when subtracted from NGC (Engelbracht et al., 1998). Thus, the template was chosen to be a good fit to a solar metallicity starburst galaxy, and was not made by modelling the stellar populations of each galaxy in our sample. The stars in the template are of stellar types K0 to M3, with metallicities between solar and half–solar. Two of the stars are supergiants, five are bright giants, five are giants, and three are dwarfs.
The resolution of the template is km s-1 in H. To match the intrinsic velocity dispersion of the galaxy spectra, we convolved this template with a Gaussian kernel as necessary to lower the resolution. He 2–10 and NGC 3077 were best fit with no convolution; NGC 3504 required a template with km s-1 resolution, and NGC 4102 required a km s-1 template. For NGC 4214 and NGC 4861, continuum subtraction was unimportant because the continua are much weaker than the nebular emission lines.
The stellar continuum template has an absorption feature at µm. By comparison with spectra of the Sun (Livingston and Wallace, 1991) and Arcturus (Montgomery et al., 1969), we identify this feature as a blend of three nickel lines and four (weaker) iron lines. At a resolution of km s-1, the blend has an equivalent width of Å, and dips to of the continuum level. Because the absorption feature is a metal line blend, its strength will depend on metallicity.
Besides a simple subtraction of the stellar continuum, we also added a featureless continuum to the template, renormalized, and subtracted the new continuum from the galaxy spectra. This procedure crudely approximates the effect of lower metallicity. These two realizations of the continuum subtraction provide some estimate of the associated uncertainty.
2.4 Measuring Line Ratios
To set the continuum level, we fit a low–order Chebyshev function across each spectrum, excluding emission lines from the fit. Each line was fit by a Gaussian to measure the line fluxes listed in table 3. For the noisy, non–Gaussian line profiles of NGC , we directly summed flux rather than fit Gaussians.
To measure the relative strength of Hei µm, we considered two ratios: Hei µm/Br, and 1.7. We assumed the value , which is appropriate for cm-3 and K (Engelbracht et al., 1998; Hummer & Storey, 1987). For each galaxy, we computed both these ratios for both realizations of the continuum subtraction (with or without the featureless continuum), and used the mean of these four values as the Hei µm/Br ratio, and the standard deviation as an estimate of the uncertainty associated with the continuum subtraction. We also computed the ratio Hei µm/Br. Our measured line ratios are listed in table 4, along with values of Hei µm/Br from the literature, and a weighted mean for Hei µm/Br that combines new and literature values. (The quoted uncertainty for the weighted mean is the error in the mean.)
Because of the µm stellar absorption feature, studies that do not subtract the continuum in galaxies with weak Hei µm will somewhat underestimate the Hei µm line strength and therefore underestimate Teff. To test the magnitude of this effect, in table 4 we list both continuum–subtracted and raw (un–subtracted) Hei µm/Br ratios. For galaxies NGC 3504 and NGC 4102, the lines are so weak relative to the stellar continuum that the Hei µm/Br cannot be measured without continuum subtraction. For the other galaxies in table 4, the raw and continuum–subtracted line ratios are very similar; for these galaxies (He 2–10, NGC 3077, NGC 4214, and NGC 4861), the continuum subtraction is not an important source of uncertainty.
3 MODELLING LINE RATIO BEHAVIOR
Because the emission lines used to diagnose effective temperature have different excitation energies, one cannot verify that a particular diagnostic works by simply testing whether it exhibits a one-to-one correlation with another diagnostic. Instead, one must test diagnostics in light of photoionization models that, given realistic hot stellar ionizing spectra, predict line ratios appropriate to idealized nebulae. One can then ask a) whether the observed ratios populate the line ratio space permitted by models; and b) whether many observed line ratios for a particular galaxy are consistent, that is, can all be produced by one set of physical parameters. Thus, translating a nebular line ratio to a statement about stellar content is necessarily model–dependent.
Past studies have run series of models in which a single main sequence star photoionizes a nebula, producing tabulated line ratios as a function of stellar Teff. A measured galactic line ratio is then translated into an effective temperature using this tabulation (Doyon et al., 1992; Achtermann & Lacy, 1995; Vanzi & Rieke, 1997; Beck et al., 1997; Förster Schreiber et al., 2001). This method has its uses: namely, to compare model inputs and assumptions, and understand what line ratios different stellar classes can produce. However, in § 3.2 we will argue that, especially for mid–infrared line ratios and Hei µm/Br, starbursts are poorly approximated by single main sequence stars; to translate a line ratio into a meaningful statement about a stellar population, one must consider the flux from all the stars as a function of time. First, though, we will consider the insights and limitations of simple one–star models.
All our models (single–star and population synthesis) are radiation–bounded thin shells created by the photoionization code Cloudy 94.00 (Ferland, 1997). Using parameters determined by Förster Schreiber et al. (2001) for M82, we set the total hydrogen number density to cm-3 and inner radius to pc. This choice of radius produces line ratios within of the plane–parallel () case. This is because the shell is thin. Thus, the choice of radius only slightly affects the models, which are effectively plane–parallel. For single–star models, we use a constant ionization parameter of . We ran two sets of models, one with gas–phase abundances of solar, and the other with solar abundances (“the low–Z models”); neither abundance set includes depletion onto dust grains. (We address the effects of dust in § 5.4.) Because Cloudy does not predict the intensity of Hei µm, we scaled the intensity from Hei Å, which shares the same upper level. For Case B and T K, the Hei µm line is a factor of fainter than Hei Å.
3.1 Models Using Individual Stars
We first consider the ratio of [Neiii] µm to [Neii] µm. For reference, it requires eV to make singly–ionized neon, and eV to make doubly–ionized neon. We took ionizing spectra from the O star models of Pauldrach, Hoffmann, & Lennon (2001), as prepared by Smith et al. (2002), and also the CoStar model spectra of Schaerer & de Koter (1997) as hardwired in Cloudy. These two stellar libraries predict dramatically different line ratios. Dwarf, giant, and supergiant Pauldrach stars all produce a maximum [Neiii]/[Neii] ratio of at Teff K. By contrast, the CoStar dwarf and giant atmospheres yield [Neiii]/[Neii] at Teff K. At Teff K, the predicted line ratios disagree by an order of magnitude. Förster Schreiber et al. (2001) used Pauldrach atmospheres and an earlier version of Cloudy to make their figure 8, which our Pauldrach models reproduce.
The other mid–infrared line ratios also show this discrepancy. CoStar models predict ten times higher [Siv]/[Siii] and [Siv]/[Neii] ratios than Pauldrach models for most of the K range; for [Ariii]/[Arii] and [Ariii]/[Neii], CoStar gives and times higher ratios, respectively. The near–infrared line ratios Hei µm/Br and Hei µm/Br are not sensitive to the choice of stellar atlas.
It is sobering that current O star models predict such different mid–infrared line ratio strengths. On the bright side, this sensitivity suggests that mid–IR line ratios may provide astrophysical tests of O star spectral models in simple Hii regions. Giveon et al. (2002) performed such a test in Galactic Hii regions; they find that Pauldrach et al. (2001) atmospheres fit the observed [Ariii]/[Arii] versus [Neiii]/[Neii] relation, whereas stellar models that assume LTE do not. In another test, Pauldrach et al. (2001) argued that their models successfully reproduce the observed far–UV spectra of hot stars, as opposed to other models. Finally, Smith et al. (2002) argue that Pauldrach et al. (2001) atmospheres should be more realistic than those of Schaerer & de Koter (1997) because the latter neglect line broadening, and thus underestimate line blanketing. As a result, CoStar atmospheres have significantly higher ionizing fluxes, especially at energies exceeding the He+ edge.
Given these problems, and that the CoStar atmospheres predict much higher [Neiii]/[Neii] line ratios than are observed, we will use the Pauldrach et al. (2001) atmospheres in this paper. Still, that the Pauldrach spectra are better does not mean they are correct; the CoStar–Pauldrach discrepancy should serve as some warning of the current uncertainties regarding hot star spectra—a critical input to the models.
We also consider Wolf–Rayet (WR) stars in simple nebulae. We use WN and WC model spectra compiled by Smith et al. (2002), which were generated using the code of Hillier & Miller (1998). For a given Teff, these model WR stars yield much lower [Neiii]/[Neii] ratios compared to Pauldrach O stars: at K, the difference is a factor of for WN, and a factor of for WC stars. This is because of the very strong line blanketing found in WR stars. Since Wolf–Rayet stars can reach much hotter temperatures than main sequence stars, a K WC star can reach (comparable to the ratio produced by a K Pauldrach O star). Similarly, a K WN star can reach [Neiii]/[Neii]. Thus, given these stellar atmospheres, only a WN star can give rise to a neon ratio between and .
As a result, there are mid–infrared line ratio regimes that only Wolf–Rayet stars can populate (again assuming solar metallicity.) For maximum effective temperatures of Teff K, Teff K, and Teff K, for Pauldrach et al. (2001) model O stars and Hillier & Miller (1998) WR stars, we find the following:
-
•
Main sequence O stars can only produce , whereas WN and WC stars can reach ratios of .
-
•
MS O stars can only produce [Siv]/[Siii], while WC stars can reach , and WN can reach .
-
•
MS O stars can only produce [Siv]/[Neii], whereas WC can reach and WN can reach .
-
•
MS O stars and WC stars can only produce [Ariii]/[Neii], whereas WN stars can reach .
We have just seen that the conversion from mid–infrared line ratio to Teff is very different for main sequence stars than for Wolf–Rayet stars. Thus, even a modest portion of WR stars within a hot stellar population can significantly affect the line ratios. We also conclude that in a solar–metallicity starburst, if the line flux ratios exceed the maximum that main sequence stars can produce, then WR stars dominate the ionizing flux.
3.2 Spectral Synthesis Models
Given the influence of WR stars, we must consider the more realistic scenario of an evolving stellar population as the ionizing source. We used the spectral synthesis code Starburst99 version 4.0 (Leitherer et al., 1999) to create instantaneous starbursts with an initial mass function of Salpeter–slope (Salpeter, 1955) and initial stellar masses between M☉ and a variable upper mass cutoff, “Mup” (Mup, , , , , and M☉.) (Mup in this paper always refers to the IMF, not the present-day mass function.) As in our single–star models, this version of Starburst99 uses O star model spectra from Pauldrach et al. (2001) and Wolf–Rayet model spectra from the code of Hillier & Miller (1998), as prepared by Smith et al. (2002).
We created two suites of models: the first set assumed solar metallicity in Starburst99 and Cloudy, and the “solar metallicity, high–mass loss” option, which is recommended as the default for Starburst99. (The alternative “standard mass loss” option gives qualitatively similar results.) The second set of models used a gas–phase metallicity of solar in Cloudy, and the “high–mass loss, Z= solar” and “uvlines = Magellanic” settings in Starburst99. Dust was ignored (and will be addressed in § 5.4.) Other parameters were set as for the single–star models. Starburst99 calculated the spectral energy distribution (SED) of the burst every Myr for Myr after the starburst. The ionization parameter was normalized to a maximum value of , and scaled by the number of hydrogen–ionizing photons present in the SED. Given the SEDs as input, Cloudy calculated line ratios as a function of starburst age.
Figure 3 plots line ratios as a function of time for these simulations. Table 5 summarizes the spectral synthesis models with Mup M☉ and compares to line ratios from the single–star models. Line ratios versus time for the low–metallicity models are shown in figure 4.
Figure 3 shows that in the first Myr, the mid–infrared line ratios fall from an initial plateau. By Myr, the O3 through O5 dwarfs ( K) stars in the models have left the main sequence; by Myr, no O3 or O4 star of any luminosity class remains. Wolf–Rayet stars, together with the remaining main sequence stars, create a second period of relatively high line ratios from to Myr.222The Starburst99 model for Myr and MM☉ predicts line ratios that are sharply discontinuous from ratios at , , , and Myr. (The [Neiii]/[Neii] spike is 25 times higher than the surrounding points.) The M M☉ models and sub-solar metallicity models have no spike. Though we have been unable to pinpoint the cause from the Starburst99 output, we feel the Myr spike is spurious, not a physical effect, and we have removed it from the figures. While the line ratios predicted for the Wolf–Rayet phase are lower than predicted for WR–only nebulae, clearly the Wolf–Rayet stars are important: they produce a renaissance of high line ratios after the O stars have left the main sequence. It does not make sense to parameterize a mid–infrared line ratio as though the flux came from a single main sequence star; the ensemble of stars, including the Wolf–Rayets, must be considered.
The models of Thornley et al. (2000), which otherwise used similar input spectra and nebular parameters to this work, did not include Wolf–Rayet stars. As a result, [Neiii]/[Neii] drops monotonically with time in their figures 6 and 10, while our solar–metallicity curves (figure 3) are double–peaked.
4 DIAGNOSTICS OF STELLAR Teff IN STARBURST GALAXIES
4.1 Approaches to Estimating Teff
In general, line ratios capable of indicating Teff also depend on metallicity, electron temperature, density, ionization parameter, and the morphology of the ionized regions. Without constraints on these other parameters, Teff can be difficult to determine (e.g., Morisset (2003)). However, in the extreme conditions in starbursts, we expect less range in ionization parameter and morphology than in broad samples of Hii regions, and starburst metallicities can be constrained by other line ratios. Therefore, it is plausible that useful constraints on Teff can be derived for these regions. We return to this topic in § 5.1.
At optical wavelengths, the ratio of [Oiii] to H is frequently used as a diagnostic since both lines are easily observed (see for example Stasińska & Leitherer (1996).) They are relatively close in wavelength, and Balmer ratios can be used to correct for residual extinction. However, large optical depths of interstellar extinction can make [Oiii]/H reflect the conditions of the outer skin of starbursts only. Thus, [Oiii]/H may not indicate the average conditions throughout a highly–extincted starburst. Also, a ratio composed of a forbidden metal line and a hydrogen recombination line is particularly sensitive to the metallicity, electron temperature, and density of the nebular region. Additionally, [Oiii] can be shock excited (Raymond et al., 1988).
Vílchez & Pagel (1988) have proposed an all–forbidden line diagnostic , which uses lines of [Oii], [Oiii], [Sii], and [Siii] with wavelengths from Å to Å. This diagnostic was initially reported to work well for Hii regions (Kennicutt et al., 2000), but it is sensitive to morphology and shocks (Oey et al., 2000). Moreover, the diagnostic is poorly suited to starburst galaxies because it involves red lines that are seldom observed, and is extremely subject to reddening.
More robust optical line diagnostics can be made by comparing strengths of helium recombination lines with recombination lines of hydrogen (Kennicutt et al. 2000; Ho, Filippenko, & Sargent 1997; Doherty et al. 1995). Hei Å and Hei Å are attractive for this purpose because their proximity to H and H, respectively, reduces reddening effects. However, these diagnostics still sample only the outer skin of the starburst, and the helium lines are weak, as discussed further in § 4.3.
Because they suffer less extinction, infrared spectral diagnostics probe more deeply into a starburst than optical ones. For example, magnitudes of extinction at Å corresponds to only magnitudes at µm, and magnitudes at µm (Rieke & Lebofsky, 1985). The mid–infrared fine structure lines are the most successful tools in this spectral region to estimate Teff (Roche et al., 1991; Kunze et al., 1996; Achtermann & Lacy, 1995; Thornley et al., 2000; Förster Schreiber et al., 2001). These lines are less dependent on electron temperature than optical forbidden lines. However, their atomic constants are not well known (Feuchtgruber et al., 1997, 2001; van Hoof et al., 2000; Galavis et al., 1997), and they are still sensitive to metallicity and ionization parameter (see figure 10 of Thornley et al. 2000).
Because of the lack of strong atomic lines, attempts to use near–infrared lines to measure Teff have focused on recombination lines of helium and hydrogen. For stellar ionizing sources, the hardness of the ionizing continuum determines the volume of He+ relative to H+ (Osterbrock, 1989). For K, the He+ and H+ regions coincide; the Strömgren radii are approximately equal. For lower Teff, the zone of ionized H extends beyond the central zone of singly–ionized He (see figures 2.4 and 2.5 of Osterbrock (1989), and figure 1 of Shields (1993)). Thus, by measuring the relative volumes of He+ and H+ within a nebula, one can constrain the effective temperature of the ionizing stellar source(s).
The line ratio of Hei 2.06 has been used to estimate Teff in starbursts (Doyon, Puxley, & Joseph 1992; Doherty et al. 1995) and planetary nebulae (Lumsden, Puxley, & Hoare 2001a). However, the strength of the Hei 2.06 line is not determined simply by recombination cascade, but also by the population in the P state (Shields, 1993). This level is pumped from the ground state by Å photons in the resonance transition (Shields, 1993; Bashkin & Stoner, 1975). Photoionization of hydrogen, dust absorption, or Doppler shifting can change the resonance efficiency and thus the occupation of the state. The state can be further populated by collisions from the triplet states, primarily from (Shields, 1993). A small Hei 2.06 ratio should indicate a soft continuum where there are few Å photons and few helium recombinations. Otherwise, the ratio is likely to be a poor measure of starburst Teff due to the dependence on nebular dust content, electron temperature, and density, as well as on the ionizing continuum. Some of this complex behavior is seen in photoionization models (figure 1d of Shields 1993).
The Hei 1.7 ratio was proposed as a Teff diagnostic by Vanzi et al. (1996), and has been measured in several starburst galaxies (Vanzi et al. 1996; Vanzi & Rieke 1997; Engelbracht, Rieke, & Rieke 1998; Förster Schreiber et al. 2001) and planetary nebulae (Lumsden, Puxley, & Hoare 2001b). The Hei µm line and Br are close in wavelength, and A is only one-sixth of AV, making their ratio nearly reddening-independent and also allowing the photons to escape from relatively obscured regions. Unlike Hei µm, the Hei µm transition arises almost entirely from recombination cascade. The relevant levels are triplet states, so they cannot be pumped from the ground state, because an electron spin flip would be required (Bashkin & Stoner, 1975). As a result, the line ratio is insensitive to nebular conditions, and is determined almost entirely by the relative sizes of the H and He ionization zones.
Figure 8 of Förster Schreiber et al. (2001) plots the behavior of the Hei µm/Br ratio as a function of Teff, as predicted by photoionization models for a starburst environment ionized by hot main sequence stars. The Hei µm/Br ratio is small for Teff K because there are many more photons capable of ionizing hydrogen (ionization potential of eV) than neutral helium (ionization potential of eV). For Teff K, the ratio rapidly increases as the zone of singly–ionized helium overlaps more of the hydrogen Strömgren sphere. The ratio then saturates for Teff K, as the He+ and H+ regions coincide. For cm-3, the saturated ratio is
| (1) |
where is the gas–phase abundance of helium (by number) relative to hydrogen, and the term C1.7 expresses the weak dependence on electron temperature (Vanzi et al., 1996). For T K, C; other values are listed in table 1. The helium abundance increases from the primordial value of approximately (Izotov & Trihn, 1998; Bono et al., 2002) to for the Milky Way. Thus, Hei µm/Br should saturate at a value of to .
The Teff diagnostics discussed above do not necessarily agree. For example, in the starburst galaxy He 2–10, [Oiii]/H and [Oi]/H indicate Teff K (Sugai & Taniguchi, 1992), whereas mid–infrared line ratios indicate Teff K (Roche et al., 1991). The Hei µm/Br observed by Vanzi & Rieke (1997) would indicate Teff K using the conversion of Doyon et al. (1992). At poor signal–to–noise, Vanzi & Rieke (1997) measure Hei µm/Br and find Teff K. This few thousand Kelvin disagreement translates into a serious disagreement in stellar mass: a Teff of K corresponds to approximately an O8V spectral type, which from eclipsing binaries should have a mass of to M☉ (Andersen, 1991; Ostrov et al., 2000; Niemela & Bassino, 1994; Gies et al., 2002); whereas a Teff of K corresponds to an O6.5V to O7V spectral type, which should have a mass of M☉ (Gies et al., 2002; Niemela & Bassino, 1994).
We now test Teff diagnostics against each other in light of the stellar synthesis models detailed above. Because the line physics of Hei µm/Br is simple and well–understood (see § 4), we assume this diagnostic is unbiased, and thus accurately reflects the ionizing continuum, within the limitations of measurement error.
4.2 Testing Hei µm/Br
In this section we consider the galaxies for which we obtained Hei µm/Br measurements, as well as three galaxies with Hei µm/Br measurements available in the literature: NGC 253 (Engelbracht et al., 1998), for which the stellar continuum was subtracted as in this work; M82 (Förster Schreiber et al., 2001), for which representative stellar spectra were subtracted; and NGC 5253 (Vanzi & Rieke, 1997), for which the stellar continuum is weak enough to ignore. These three galaxies, together with the six galaxies for which we observed Hei µm/Br, we term our expanded sample. We also take measurements of Hei µm/Br from the literature for the galaxies in the expanded sample.
Figure 5 plots Hei µm/Br versus Hei µm/Br. NGC 3077, NGC 4861, NGC 4214, and He 2–10 all have Hei µm/Br ratios consistent with the saturated value of , within the measurement errors and the expected variation of helium abundance. Thus, these starburst regions appear to contain massive stars (Teff K if main sequence stars.) By contrast, NGC 253, NGC 4102, and the nucleus of M82 have Hei µm/Br, and thus are inferred to have softer ionizing continua (Teff K if main sequence stars.) NGC 3504 and the two off–nuclear regions of M82 have line ratios intermediate to these extremes.
Figure 5 illustrates that Hei µm/Br does not trace Hei µm/Br as the models predict. The nucleus of M82 demonstrates that Hei µm may be strong while Hei µm is weak, contrary to the expected behavior (but expected if Hei µm is pumped.) However, for most galaxies, Hei µm is too weak for the measured Hei µm. This is the first direct demonstration that Hei µm/Br is a poor diagnostic of Teff in starburst galaxies. Radiative transfer considerations have predicted that the behavior of Hei µm should not be a simple function of Teff (Shields, 1993). Lumsden et al. (2001a) confirm this complex behavior for planetary nebulae, though they attempt to constrain the dependence on Te and density by also considering optical Hei lines (Doherty et al., 1995). However, the data do not contradict the expectation that a very low Hei µm/Br ratio (below ) indicates that the continuum is fairly soft, because there would be few ionizing photons and also few resonantly scattered photons.
We further consider the reliability of the Hei µm/Br ratio in figure 6, by comparing it to the mid–infrared line ratio [Neiii] 15.6µm/[Neii] 12.8µm. Here, too, Hei µm/Br is too low for a given [Neiii]/[Neii] (compared to model predictions) and there is no obvious correlation between the two ratios. An alternative interpretation of figure 6 would be that Hei µm/Br is correct and [Neiii]/[Neii] is systematically overproduced; we feel this is unlikely because, as we will demonstrate in § 4.4, [Neiii]/[Neii] is underproduced in starburst galaxies with respect to the predictions of a Salpeter IMF extending to M☉.
4.3 Testing Optical Teff Indicators
How well do optical forbidden and recombination line ratios estimate Teff in starbursts? Figures 9 and 10 of Kennicutt et al. (2000) show that the recombination ratios Hei /H and Hei /H, as well as [Oiii]/H, all track Teff well in Milky Way, LMC, and SMC Hii regions, where Teff could be determined by classifying all the ionizing stars. How well do these diagnostics perform in starburst galaxies?
In figure 7, using dereddened data from Ho et al. (1997), we compare the behaviors of Hei /H and [Oiii]/H in nuclear starbursts to the predictions of Starburst99/Cloudy photoionization models. Galaxies with [Oiii]/H generally have low Hei /H, indicating general agreement that Teff is low in these galaxies. At higher line ratios, there is considerable scatter. For most of the plotted galaxies, [Oiii]/H is systematically high for a given Hei /H, compared to a solar–metallicity, Mup M☉ track. Lowering the metallicity of the model reduces but does not eliminate the disagreement between diagnostics. Only an extreme model (low metallicity, Mup M☉) can fit the data reasonably well.
A possible explanation would be that [Oiii] in starbursts is often shock–excited by supernovae (Raymond et al., 1988), which would be a rare effect in Hii regions and thus not affect the Kennicutt et al. (2000) plots. In particular, [Oiii]/H values above require sub–solar metallicity or excitation by shocks. Thus, figure 7 suggests that [Oiii]/H is systematically high or Hei /H is systematically low in starburst galaxies.
As a further test, figure 8 plots [Oiii]/H versus Hei µm/Br for our expanded sample. Overplotted are Starburst99/Cloudy models as in figure 7. For low values of [Oiii]/H, the error bars are too large to judge whether the two diagnostics correlate. As in figure 7, the highest [Oiii]/H values observed require sub–solar metallicity or shock excitation of [Oiii].
Next, we examine the behavior of [Oiii]/H versus [Neiii]/[Neii] in figure 9 (omitting for now NGC 5253, II Zw 40, and NGC 55 because of their low metallicity.) Optical line ratios are from the literature, and ISO observations of [Neiii]/[Neii] are from Thornley et al. (2000). Galaxies with [Oiii]/H generally have line ratios consistent with the overplotted Starburst99/Cloudy models. With higher [Oiii]/H, the scatter increases. Without accurately knowing the metallicity of each galaxy in figure 9, it is difficult to judge how much of the scatter in [Oiii]/H versus [Neiii]/[Neii] is due to the sensitivity of [Oiii]/H to metallicity rather than effective temperature.
According to the Cloudy models, metallicity alone cannot explain the line ratios of NGC 6240, IC 1623A, Arp 220, NGC 3690A, and NGC 7469 (and possibly NGC 972) in figure 9. Low metallicity and a upper mass cutoff of M☉ could together explain all but IC 1623A and NGC 6240. Alternatively, aperture mismatch, severe extinction, or shock excitation of [Oiii] could be at work. NGC 972 is not strongly centrally concentrated in optical emission line images, so the explanation may lie in aperture mismatch: the optical line ratios were measured with slitwidths of a few arcseconds, while the ISO neon lines were measured with a ″ by ″ aperture. The remaining discrepant galaxies all have very heavily obscured star formation regions, and it is likely that the discrepancy arises because the optical and mid–infrared spectra sample distinctly different regions along the line of sight. We also note that NGC 278 has extremely low [Oiii]/H for its measured [Neiii]/[Neii]. Higher–spatial resolution mid–infrared spectroscopy (e.g., with SIRTF) may resolve this discrepancy. We will delay discussion of whether [Neiii]/[Neii] is a reliable Teff diagnostic until § 4.4.
Next, we consider the optical helium and hydrogen recombination lines, which should form more accurate starburst Teff diagnostics than a forbidden/recombination pair like [Oiii]/H. To reduce reddening effects, we select Hei lines close in wavelength to H lines. Unfortunately, the helium lines are weak: Hei saturates at of the strength of H, and Hei saturates at of H. As such, in the spectral atlas of Ho et al. (1997), Hei was detected in only of galactic nuclei, and Hei in only nuclei. The small sample indicates that Hei is only marginally detected, and we do not consider it further.
Figures 7 and 9 have already implicated [Oiii]/H as an unreliable Teff indicator for [Oiii]/H. This makes it hard to gauge the reliability of Hei /H in figure 7. Also, the sample sizes are too small to compare the optical recombination line ratios to [Neiii]/[Neii], Hei µm/Br, or Hei µm/Br individually. Instead, we use the latter three Teff indicators together to test how well the optical recombination line ratios correlate with Teff. In table 6, we list galaxies with measurements of at least two different Teff indicators, in order of increasing Teff, as determined from [Neiii]/[Neii], Hei µm/Br, and Hei µm/Br (when ), as available. Due to measurement error and uncertainty in the relative calibrations of the diagnostics, the ordering is somewhat uncertain. The published plots of the Ho et al. (1997) spectra lack the dynamic range to assign upper limits to the undetected optical recombination lines. These are marked as “non det” in table 6.
In general, table 6 shows some correlation between Hei /H and Teff, though with considerable scatter. Using Kendall’s rank correlation test on the eight galaxies with measured Hei /H, there is only a chance that Teff and Hei /H are uncorrelated.
4.4 Testing the Mid–Infrared Fine Structure Line Ratios
In the mid–infrared, ratios of the fine structure lines [Neiii] µm, [Neii] µm, [Ariii] µm, [Arii] µm, [Siv] µm, and [Siii] µm have been used to test for the presence of hot stars in starbursts. From space, ISO measured these lines at low spatial resolution (″ by ″ aperture for [Neiii]/[Neii]) (Thornley et al., 2000; Förster Schreiber et al., 2001; Kunze et al., 1996). Ground–based observations (Roche et al., 1991; Achtermann & Lacy, 1995) provide higher spatial resolution, but only the [Siv], [Ariii], and [Neii] transitions can be observed through the atmosphere. As a result, ground–based studies must use heteronuclear line ratios, which are less ideal than homonuclear ratios available from space because they are much more sensitive to elemental abundances and dust depletion.
In table 7, we collect measurements of the mid–infrared line ratios and Hei µm/Br in starburst galaxies, including five regions within M82. M82 provides a testing ground for the accuracy of the mid–infrared line ratios as Teff diagnostics; ISO measured homonuclear line ratios in the center (Förster Schreiber et al., 2001), and this region has been mapped at 1″ resolution in [Neii], [Ariii], and [Siv] (Achtermann & Lacy, 1995), identifying the nucleus and three infrared–bright regions nearby (all regions defined in the footnotes to table 7.)
Based on the heteronuclear mid–infrared line ratios and Hei µm/Br, we find that region W2 and the nucleus of M82 both require Mup M☉, region E1 requires Mup M☉, and region W1 requires Mup M☉. The heteronuclear and homonuclear mid–infrared line ratios and Hei µm/Br within the SWS/ISO aperture require Mup M☉. Models with Mup, , , or M☉ do not produce the observed ratios in any of these regions. Thus, we find that the heteronuclear line ratios give consistent ages and upper mass cutoffs for individual regions near the center of M82, in agreement with Hei µm/Br, and when averaged over the SWS/ISO aperture, give answers consistent with the homonuclear line ratios.
We further test the mid–infrared line ratios using the five other solar–metallicity galaxies listed in table 7. For NGC 4102 and NGC 6240, the constraints are poor, and the line ratios can be fit by Mup to M☉. In NGC 6946, Hei µm/Br and [Neiii]/[Neii] disagree unless Mup M☉, but as we cautioned in § 4.2, Hei µm is not a reliable diagnostic. For NGC 253, Hei µm/Br and the neon ratio cannot be simultaneously matched by the Mup M☉ model, but models with Mup M☉ can fit the ratios. For He 2–10, the line ratios require Mup M☉, mostly because of low observed [Ariii]/[Neii].
Our conclusion is that in individual regions and entire starbursts, the different heteronuclear and homonuclear mid–infrared line ratios and Hei µm/Br give consistent answers as to age and Mup. This agreement supports use of the mid–infrared line ratios as diagnostics of the ionizing radiation field. The mid–infrared lines have large equivalent widths and a range of excitation energies, making them potentially powerful diagnostics.
5 DIAGNOSING IONIZING CONDITIONS IN STARBURSTS
5.1 Mid–Infrared Line Ratio Dependencies
The mid–infrared line ratios depend on several physical parameters: metallicity, ionization parameter, morphology, and the strength and shape of the ionizing continuum. To be confident in applying these ratios, we need to disentangle these various effects. We consider each parameter in turn.
Metallicity. As metallicity decreases, the relative high–excitation line emission increases, because lower–metallicity stars have harder spectra and because lower–metallicity nebulae cool less efficiently. Another effect is that Wolf-Rayet stars require larger progenitor masses with decreasing metallicity. These effects can be seen by comparing the low–metallicity models (figure 4) with the solar–metallicity models (figure 3). Using Starburst99 and Cloudy, we find that Z times solar models have initial mid–infrared line ratios that are times greater than solar–metallicity models; these line ratios fall more slowly with time than in solar–metallicity models.
While metallicity affects the mid–infrared line ratios, metallicity can be measured and corrected for. Within galaxy samples that have similar measured metallicity, uncertainties in the metallicity should affect the mid–infrared line ratios by factors that are much smaller than the orders–of–magnitude changes in line ratio values expected due to Teff (as discussed in § 3.2).
Ionization parameter and morphology. The ionization parameter, as the ratio of the spectral intensity to the gas density, combines two of the fundamental parameters that determine the degree of ionization in a nebula. In a Galactic Hii region, the ionization parameter changes rapidly with radius because of the 1/R2 falloff and absorption of UV photons by the nebula (which also alters the spectral shape.) Morphology then determines which parts of the nebula influence others. A starburst galaxy, however, is much messier than an assembly of pseudo-spherical Hii regions: the ISM is generally fragmented, and gas parcels are ionized by many stars. For example, in M82, it appears that the interstellar medium is highly fractionated (e.g., Seaquist, Frayer, & Bell 1998) and that the whole pc nuclear starburst and individual pc star–forming clusters can be described by a single ionization parameter (Thornley et al. (2000), citing the dissertation of N. Förster Schreiber.) Thus, it seems more appropriate to model a starburst as though the gas and stars are thoroughly mixed (by employing a mean UV spectrum and mean ionization parameter), rather than as a collection of spherical clouds, each with a single ionization source. This “mixed gas and stars” model is achieved in practice by assuming plane–parallel geometry and a composite ionizing spectrum.
Ionization parameters (U) have been estimated in several nearby starburst galaxies by measuring the number of Lyman continuum photons and the size of the starburst region. Thornley et al. (2000) summarize measurements in NGC 253, NGC 3256, and M82, which are all consistent with . Measurements have also been obtained for Arp 299 (Alonso-Herrero et al., 2000); NGC 1614 (Alonso-Herrero et al., 2001); NGC 1808 (Krabbe et al., 1994); IC 342 (Bosker et al., 1997); NGC 6946 (Engelbracht et al., 1996); and NGC 3049 (Engelbracht et al., 1996). In addition, Ho et al. (1990) measure the Lyman continuum flux in fourteen nearby galaxies. Six of these galaxies have multiple measurements of , which gives some estimate of the (often considerable) uncertainty.
In figure 10 we plot the ionization parameters derived from these studies. It should be noted that each of these values is actually a lower limit, since we use the maximum radius of the starburst region to compute the ionization parameter. When the gas density was not measured, we assume cm-3; the true ionization parameter scales as . Figure 10 shows that the ionization parameter used in our simulations, , is a reasonable average value given the measurements available for nearby starbursts.
How sensitive are the mid–infrared line ratios to the ionization parameter? Reducing in our models by a factor of lowers the [Neiii] µm / [Neii] µm line ratio by a factor of . Therefore, if the ionization parameters of starburst galaxies vary by a factor of or more, this parameter could account for considerable spread in observed mid–infrared line ratios. However, there is no tendency for galaxies with small [Neiii]/[Neii] to have low ionization parameters in figure 10, indicating that is not the dominant parameter determining this flux ratio. Comparing with the restricted range of U observed in starbursts, we conclude from the modeling in § 3.2 that Teff dominates variations in this line ratio in such regions.
Starburst ISM morphologies are far too complex to reproduce in simulations; fortunately, parameterization of a starburst by a single, global ionization parameter and a mean ionizing spectrum is physically motivated, agrees with observations, and simplifies the problem sufficiently to allow modeling.
Another test of the diagnostic usefulness of the mid–infrared line ratios is provided by studies of Galactic Hii regions. Martín–Hernández et al. (2002) found that, in compact Hii regions, the line ratios [Neiii] µm/ [Neii] µm, [Ariii] µm/ [Arii] µm, and [Siv] µm/ [Siii] µm correlate very well with each other, suggesting their reliability. Morisset (2003) has also demonstrated the use of these lines to estimate Teff and in Galactic Hii regions, though as demonstrated by Morisset et al. (2003), outside constraints on ionization parameter and metallicity are usually necessary.
5.2 The Spectrum of the Ionizing Radiation
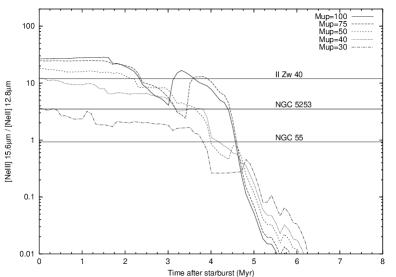
We now focus on using the fine structure line ratios to estimate the spectrum of the ionizing radiation in starbursts. As figure 3 illustrates, once an instantaneous burst is older than Myr, [Neiii]/[Neii], [Siv]/[Siii], and [Siv]/[Neii] are so low () that the higher–ionization line should not be detected. [Ariii]/[Arii] and [Ariii]/[Neii] fall off more slowly, but still require a dynamic range exceeding to detect both lines in each ratio. Such very low line ratios are not seen in Thornley et al. (2000), which with [Neiii] µm/[Neii] µm measurements is the largest sample to date of mid–infrared fine structure lines in starburst galaxies. The lowest ratio detected by Thornley et al. (2000) is , and galaxies have upper limits. The simplest explanation of this behavior is that massive stars continue to form at low rates after the peak of a starburst.
In the Thornley et al. (2000) sample, all but galaxies have [Neiii][Neii]. The three outliers, with neon ratios from to , are all low–mass, low–metallicity galaxies (NGC 55, NGC 5253, and II Zw 40). We will consider the higher–metallicity galaxies now, in the context of the solar–metallicity models, and defer discussion of the low–mass, low–metallicity galaxies to § 5.3.
In figure 3, as Mup decreases, the line ratios decrease during the main sequence phase (because the ionizing spectrum softens), and the gap widens between the two phases of high line ratios (because fewer stars become Wolf–Rayets.) We now consider these models in light of the measured neon ratios of Thornley et al. (2000), which are overplotted in figure 11.
In the Mup M☉ model, for of the first Myr, the predicted [Neiii]/[Neii] exceeds the highest line ratio measured by Thornley et al. (2000) for a high–mass, solar–metallicity galaxy; thus, this model poorly fits the data. A much better fit is the , Mup M☉ model. For only of the first Myr does this model predict [Neiii]/[Neii]; for of that time, it predicts neon line ratios within the range of the Thornley detections. The Mup M☉ model fits markedly better than the Mup and M☉ models. Because one–quarter of the Thornley datapoints are upper limits (excluding the three low–mass, low–metallicity galaxies), the M model is a better fit to the Thornley data than the above percentages indicate.
One draws the same conclusion from continuous star formation models, as shown in figure 12. Such models with Mup and M☉ predict a constant neon ratio above , while the neon ratio for the Mup M☉ model falls below the Thornley range. The Mup and M☉ models predict neon line ratios within the Thornley range; the Mup model comes closer to the median.
These results are consistent with those of § 4.4, which found that the heteronuclear and homonuclear mid–infrared line ratios within four regions of M82 required Mup to Mup M☉ (depending on the region), that He 2–10 required Mup M☉, and that NGC 253 required Mup M☉. Thus, [Neiii]/[Neii] in the high–mass, solar–metallicity Thornley et al. (2000) galaxies, and a concordance of line ratios in M82 and He 2–10, are all significantly lower than the predictions of a Salpeter IMF extending to M☉. An IMF that is deficient in massive ( M☉) stars could produce the observed line ratios.
5.3 Ionizing Conditions in Low Metallicity Starbursts
We now discuss mid–infrared line ratios in low metallicity starbursts. Lowering the metallicity from solar elevates the mid–infrared line ratios, and fills in the valley between the MS and WR phases. Hei µm/Br is completely saturated until the WR stars die, by contrast to its double–peaked behavior for solar metallicity. Overplotted in figure 4 are the line ratios for II Zw 40, NGC 5253, and NGC 55, in order of decreasing [Neiii]/[Neii] ratio from Thornley et al. (2000). All three of these galaxies have low metallicity: II Zw 40 has measured [O/H] (Diaz et al., 1990) and [O/H] (Garnett, 1989), [S/H] (Garnett, 1989), and [Ne/H] (Martín–Hernández et al., 2002), all linear and relative to solar abundance. NGC 5253 has measurements of [O/H] (Storchi–Bergmann, Kinney, & Challis 1995) and [Ne/H] (Martín–Hernández et al., 2002). NGC 55 has measured [O/H] to (Webster & Smith, 1983).
We consider the line ratios of these galaxies in light of the low–metallicity models. For NGC 55, the only mid–infrared line ratio available in the literature is [Neiii]/[Neii]; the observed value can easily be produced by any Mup from to M☉. For II Zw 40, the observed [Neiii]/[Neii] cannot be achieved by Starburst99/Cloudy models with solar metallicity. With the low metallicity models, we find that the observed [Neiii]/[Neii], [Siv]/[Neii], and [Ariii]/[Neii] line ratios cannot be produced at any age unless Mup is greater than M☉. The Hei µm/Br ratio agrees that the ionizing field is rather hard, but is insensitive to Mup. For NGC 5253, unless the burst is Myr old, the measured [Siv]/[Neii] requires Mup M☉. This constraint is strengthened if we consider the [Neiii]/[Neii], [Ariii]/[Neii], and Hei µm/Br ratios, which all predict ages within to Myr, for a broad range of Mup ( to .) The Hei µm/Br constraint is particularly insensitive to Mup. If one assumes this age range, the [Siv]/[Neii] ratio requires Mup M☉.
Thus, while high–mass, solar–metallicity starburst galaxies are seen to have lower [Neiii]/[Neii] ratios than a Salpeter IMF with Mup M☉ predicts, the low–metallicity galaxies II Zw 40 and NGC 5253 have the high neon ratios expected if they contain very massive stars.
5.4 Caveats and Assumptions
How robust is the conclusion that the nebular line ratios indicate that most high–mass, solar–metallicity starbursts have soft ionizing continua? First, we have assumed that the Thornley galaxies are generally of solar metallicity. If they were more metal–poor, this would raise the predicted line ratio curves, and thus increase the discrepancy between the predicted and observed ratios. The opposite effect (weakening our constraint) occurs if the Thornley galaxies have super–solar metallicity. Thornley et al. (2000) use the strong–line method to derive metallicities of Z⊙ for of their galaxies (excluding NGC 5253 and II Zw 40.) This result is consistent with the metallicities from optical line ratios, but we prefer the Thornley mid–infrared estimate because it should be reddening-independent. Starburst99 is not optimized for such metallicities, but we use twice–solar models nonetheless to crudely estimate whether super–solar metallicities could void our result. For Mup, , and M☉, doubling the metallicity from solar lowers the [Neiii]/[Neii] line ratios and increases the duration of the WR phase by Myr, which brings the models closer to agreement with observations, but deepens the trough between the main sequence and WR phases to below the lowest Thornley detection. These models predict neon line ratios within the observed Thornley range for of the first 6 Myr—little better than the solar–metallicity Mup model. To summarize, while uncertainties remain because metal–rich stellar evolution is not well understood, current models indicate that the low line ratios observed in starburst galaxies are unlikely to be explained away by metallicity effects.
Another way to negate the conclusion would be for the high–mass, solar–metallicity starburst galaxies to have much lower ionization parameters than we assumed. For the observed neon line ratios to arise in starbursts with Mup M☉, the starbursts must have about times weaker than our assumed . None of the 18 galaxies in figure 10 has a measured ionization parameter this low.
In fact, because in our models the ionization parameter starts at and falls with the ionizing flux, the ionization parameter in our models is already fairly low. (For example, 5 Myr after a solar–metallicity, Mup M☉ burst, the ionization parameter has fallen to .) Thus, our ionization parameter assumptions are conservative in that they tend to predict low line ratios for a given Mup; as a result, when comparing to observed line ratios, the models will be slightly biased toward finding high Mup. Thus, the choice of ionization parameter is not the reason we find generally low Mup in starburst galaxies; the models are actually biased against finding this result.
For simplicity, we have modelled star formation as an instantaneous burst. Starburst galaxies are of course more complicated. An instantaneous burst is the most conservative assumption of star formation history for the purpose of constraining Mup. As illustrated in figure 12, extended star formation or a series of bursts would elevate predicted line ratios above the instantaneous–burst case for most of the burst duration. As such, extended star formation would increase the discrepancy between the low ratios observed in starbursts and the high ratios predicted by high–Mup models.
Dust grains harden the ultraviolet ionizing continuum, as pointed out by Aannestad (1989). Thus, if dust competes for the ionizing photons, this elevates the line ratios, and our conclusions are strengthened. Figure 11 shows this effect in Starburst99/Mappings models with and without dust. These models were created using the Starburst99/Mappings III web interface, beta test version 3q (Kewley et al., 2003). That figure also shows that the two different photoionization codes Mappings and Cloudy, given the same input spectra and nebular conditions, predict very similar neon line ratios. This helps address the concern that our results depend on the reliability of photoionization codes and their input atomic constants.
The other major assumptions in our work are the choice of stellar evolution tracks and hot stellar spectra. Had we used the (hard–spectrum) CoStar models, they would have increased the predicted line ratios and made the Thornley et al. (2000) galaxies seem even more deficient in high–mass stars. Thus, our use of the softer Pauldrach et al. (2001) atlas is conservative in terms of existing hot star models. However, our conclusions could be invalidated if real stars have much softer ionizing continua than Pauldrach et al. (2001).
We note that NGC 3077, 4214, and 4861 now have well–measured, saturated Hei µm/Br, but no published mid–infrared spectra. Mid–infrared spectra of these galaxies should further test the trends in nebular line behavior discussed in this paper (all of these galaxies would appear to fall into the low–mass, low–metallicity category).
5.5 UV and Nebular Diagnostics in Conflict?
The very massive stellar populations of a number of starburst galaxies have been constrained by ultraviolet spectroscopy. In cases where the burst age is more than Myr, the UV spectra cannot test for stars above M☉ because the most massive stars have already exploded as supernovae or evolved off the main sequence (e.g., González Delgado et al. (1999)). A small number of starbursts have strong P Cygni profiles indicative of a very young burst and the presence of very massive stars. Thus, there appears to be a tendency for ultraviolet spectra of stellar populations to indicate larger Mup than do the nebular lines (although the galaxy samples observed in the UV and mid–infrared hardly overlap). We now consider the cases of He 2–10 and NGC 3049; the UV spectra of both these starburst galaxies show P Cygni profiles, and nebular spectra are available (mid–infrared for the former galaxy, and optical for the latter.)
He 2–10 is an extremely rare case of a starburst which has available ultraviolet spectra of adequate quality to search for P Cygni line profiles as well as high–quality mid–infrared line measurements. Although He 2–10 is of low mass and metallicity globally, the abundances in its nuclear Hii regions are approximately solar (Kobulnicky, Kennicutt, & Pizagno 1999). Best fits to the UV spectrum require Mup M☉ (Chandar et al., 2003). From our modelling of the mid–infrared line ratios, we find Mup M☉. Thus, these observations permit a discrepancy between the diagnostics, but do not require one.
For NGC 3049, mid–infrared spectra are not available, but optical and UV spectra are. This galaxy is of solar (or slightly higher) metallicity in the starburst regions (Guseva, Izotov, & Thuan 2000) although it is of low mass and luminosity, and hence probably of low global metallicity. González Delgado et al. (2002) find that the P Cygni line profiles of Civ and Siiv in NGC 3049 require Mup M☉, and rule out ages younger than Myr and older than Myr. Further, they find that the UV diagnostics disagree with optical nebular lines as to whether massive stars are present; they fit the optical nebular lines by a Mup M☉, t Myr model—parameters which would not create the observed P Cygni profiles in the UV. Given these results, the authors question whether nebular line ratios can reliably indicate the presence of massive stars.
We therefore re–examine the nebular line results for NGC 3049. In modelling these lines, González Delgado et al. (2002) used an older version of Starburst99 that employed pure helium WR models (Schmutz, Leitherer, & Gruenwald 1992) and Kurucz O star atmospheres prepared by Lejeune, Cuisinier, & Buser (1997). An update of Starburst99 incorporating new stellar models (Pauldrach et al. (2001) and Hillier & Miller (1998), as packaged by Smith et al. (2002)) became available after submission of their paper. The authors note that these new stellar models would soften the ionizing spectrum and reduce the discrepancy with the UV results, but they did not make a detailed reconciliation.
Using our models, which make use of these new stellar atmospheres, we re–examine the nebular lines of NGC 3049. In González Delgado et al. (2002), is fixed with time, and varies with radius ( at R pc) in a spherical model. This results in a generally stronger than in our models, in which falls with time. To compare with the results of González Delgado et al. (2002), we ran new models with fixed at . This value for is within the measurement uncertainties of nH and Q(H) of the value used by González Delgado et al. (2002). This choice of slightly higher ionization parameter biases our test toward low values of Mup (and agreement with the results of González Delgado et al. (2002)).
We consider the age range Myr, as required by the UV lines (González Delgado et al., 2002). Over this time period, Hei 5876/H can be fit by M☉, and [Oiii] 5007/H by M☉. [Nii] 6584/H only requires Mup, [Sii] 6716/H and [Oii] 3727/H can be fit by any Mup from to , and [Sii] 6731/H and [Oi] 6300/H cannot be fit by any model. Thus, even using a high model, we do not find that low Mup is required. The updated stellar models remove the inconsistency between the UV and nebular lines noted by González Delgado et al. (2002) in NGC 3049.
6 DISCUSSION
We have used a number of tests to show that the nebular line ratio [Neiii] µm/[Neii] µm is a robust measure of the hot stellar population in starbursts. The line ratio is virtually unaffected by extinction, and as a homonuclear ratio involving a rare gas it is not subject to abundance variation or depletion onto dust. Where it can be compared to other reliable Teff indicators, the agreement is good. Since the mid–infrared neon lines vary over several orders of magnitude during a few million years of starburst evolution, measurements of moderate precision can give good Teff constraints.
The neon ratio indicates low Teff in all members of a reasonably large sample of massive, high–metallicity starburst galaxies (Thornley et al., 2000). We have shown that plausible modifications to the interpretive models (adding dust, lowering the metallicity, changing the ionization parameter) leave the basic constraint of low Teff unchanged or strengthened.
The conclusion from [Neiii] µm/[Neii] µm contrasts with the evidence for massive, hot stars from P Cygni line profiles in the ultraviolet spectra of two galaxies, He 2–10 and NGC 3049. In the first case, we find that the infrared nebular lines are consistent with the hot stellar spectrum indicated in the UV. In the second case, no mid–infrared spectrum exists, and the optical spectrum of González Delgado et al. (2002) does not conflict with the UV result. Thus, there is no overt conflict between the P Cygni lines in UV starburst spectra and the limits on Teff set by nebular lines. However, to account for the observed low–excitation nebular spectra of starbursts, galaxies like NGC 3049 must represent a very rare stage in starburst evolution. Can the UV wind observations, infrared nebular line results, and starburst models be reconciled, given this new constraint?
Our calculations of the emission–line properties of starbursts are based on traditional synthesis modelling, as introduced by Rieke et al. (1980). Such modelling makes the assumption that newly–formed stars appear on the main sequence according to an assumed formation rate with masses given by an initial mass function. It has recently become popular to assume a Salpeter IMF, although Rieke et al. (1993) derived a very similar IMF ab initio to fit the starburst properties of M82. (Both of these IMFs differ significantly from estimates of the local IMF, in that both have a substantially larger portion of massive stars).
Assuming a Salpeter IMF extending to M☉, we have shown that these models predict an early phase in starburst evolution, of duration to million years, when hot, massive stars should produce high–excitation emission lines. “Starbursts” are identified as–such up to ages of to Myr; thus, about of active starbursts should be in the early Myr phase. However, the data of Thornley et al. (2000) show no starbursts in massive, high–metallicity galaxies with the line ratios predicted for this early phase. One explanation for this discrepancy would be that the Salpeter IMF substantially overestimates the numbers of very massive stars. We have shown that the mid–infrared line ratios can be explained if the IMF cuts off at to M☉. Parameterizing the IMF by a cutoff is an oversimplification; a substantial steepening of the IMF slope is probably a more appropriate description. One advantage of such an IMF is that it suppresses the production of oxygen, which can otherwise reach very high abundances in starbursts (Rieke et al., 1993).
However, in addition to the indications from UV spectra that stars more massive than M☉ can form in substantial numbers in starbursts, the Arches Cluster near the center of the Milky Way has a large population of M☉ stars (Figer et al., 2002). (The mid–infrared line ratios in the Arches (Giveon et al., 2002) are consistent with a burst of age – or Myr in our models, assuming twice–solar metallicity.) None of these observations can confirm the standard assumption of a Salpeter IMF extending to M☉, and the possibility of rolloff in the IMF toward very high masses needs to be considered in detail. However, the Arches and the UV starburst results suggest it is unlikely that the lack of high–excitation emission lines can be explained entirely in terms of a substantial steepening in the IMF above – M☉.
We have therefore searched for other causes for this behavior. We believe an explanation can be found in an incorrect assumption in the standard synthesis models: that the full luminous output of newly–formed stars escapes into surrounding diffuse gas. This assumption justifies modelling starbursts as traditional low–density Hii regions. Instead, we suggest that the majority of massive stars in starbursts spend a substantial part of their main sequence lifetimes embedded within dense, highly–extincted regions—similar to the ultracompact Hii regions of the Milky Way—and are thus invisible to optical, near–infrared, and mid–infrared nebular line studies.
In the solar neighborhood, it appears that about of the main sequence life of a massive star is spent within an ultracompact Hii region (Kurtz, Churchwell, & Wood 1994). Hanson, Luhman, & Rieke (1996) have detected in the near–infrared about half of a sample of radio–selected ultracompact Hii regions. They conclude that the detected regions typically are obscured by AV – . Since the undetected regions in their sample should be even more heavily obscured, we take a typical case to be AV . Thus, these objects would not contribute to the optical or near–infrared emission–line spectra of the Milky Way. The heavy extinction would even diminish the fluxes of the mid–infrared fine structure lines such as [Neii] µm and [Neiii] µm by a magnitude or more. More importantly, the densities in many ultracompact Hii regions exceed the critical densities for these lines (e.g., cm-3 for [Neiii] µm). Thus, even in the solar neighborhood, the accuracy of traditional synthesis models would be improved by assuming that massive stars contribute their bolometric luminosity to the region for their entire main sequence lifetimes, but influence the usual Teff indicators in emission line spectra for only of their lives.
The correction suggested above would be small for synthesis modelling of the solar neighborhood. However, if the ultracompact Hii region lifetimes were significantly greater, a substantial deviation from traditional synthesis models would be expected. For nuclear starbursts in massive galaxies, the external pressure is large, due to both the high density and high temperature of the interstellar medium. As a result, the ultracompact Hii regions of starbursts should be small and their expansion retarded compared with Galactic ones (De Pree, Rodríguez, & Goss 1995; Garciá-Segura & Franco 1996). The gravitational field of the central star(s) should also play an important role, slowing the expansion further (Keto, 2002). Thus, it is likely that the massive stars in nuclear starbursts spend a substantial fraction of their lifetimes embedded in high–extinction regions. It is even plausible that this phase is only terminated when these stars begin to lose mass in strong winds—the evolutionary phase seen in UV spectra of starbursts. This possibility is suggested by the failure, to date, to detect any nuclear starburst that appears younger than about 3 million years, based on either nebular line ratios or UV spectroscopy.
Another indication supporting the UCHii hypothesis is that starburst models under–predict the observed bolometric luminosities of starbursts. Further evidence is that radio recombination lines and free–free continua in starbursts indicate substantially more extinction than indicated by the Brackett lines. For example, Engelbracht et al. (1998) deduced AV to the ionized gas in NGC 253 and suggested that much of this gas lies in very compact Hii regions.
In addition, Beck, Turner, & Kovo (2000) found a substantial population of sources in young starburst galaxies whose spectra rise from cm to cm, indicating self–absorbed (optically thick to electron scattering) emission. Parsec–scale estimated sizes and large ionizing fluxes (estimated at roughly to OB stars) suggest that these sources are highly obscured young superstar clusters—similar to ultracompact Hii regions, but containing many more stars. Ironically, these results apply to low–metallicity, low–luminosity galaxies similar to those that emit high–excitation nebular lines. The other galaxies known to have non-AGN rising spectrum sources are NGC 5253 (Turner, Ho, & Beck 1998) and He 2–10 (Kobulnicky & Johnson 1999; Vacca, Johnson, & Conti 2002). Massive spiral starburst galaxies do not show this self–absorbed emission, though it is plausible that such sources exist but are are hidden by non-thermal emission from supernovae.
There are a number of consequences for starburst modelling. Because the duration of the obscured phase may depend on the mass of the central star, it may be difficult to deduce an accurate IMF in starbursts using nebular diagnostics. The derivation of the IMF from fitting UV spectra would also be suspect, since there could be a mass/age dependence on the stars contributing to these spectra rather than their providing a snapshot of the integrated hot stellar population. In addition, by suppressing the signatures of the youngest stars, the UCHii stage will tend to make the duration of starbursts appear artificially short.
7 CONCLUSION
We have obtained µm and µm spectra for six nearby circumnuclear starburst galaxies to measure the Hei µm/Br and Hei µm/Br line ratios. Simple recombination physics and independence from nebular conditions and extinction make Hei µm/Br an accurate diagnostic of the hardness of the ionizing continuum (“Teff”). The lines are too weak to be used in distant galaxies, but in nearby galaxies can test more detectable but potentially problematic diagnostics.
We present models for the behavior of the Teff diagnostics discussed in this paper. SEDs were generated by the spectral synthesis code Starburst99, which uses the most current O star and Wolf–Rayet model spectra (Pauldrach et al., 2001; Hillier & Miller, 1998). Although Teff remains a useful shorthand term, accurate models of the ionizing continuum must consider the entire population of hot main sequence and Wolf–Rayet stars. Wolf–Rayet stars maintain high line ratio values after the O stars have left the main sequence. Our updated models may aid interpretation of IRS spectra from SIRTF.
We then test whether the observed line ratios are consistent with these new models. By comparison with Hei µm/Br, we confirm that Hei µm/Br is a problem–ridden diagnostic, as predicted (Shields, 1993). Hei µm/Br also fails to correlate with the mid–infrared diagnostic [Neiii]/[Neii]. However, we point out that a low Hei µm/Br ratio may indicate a soft UV continuum. NGC 4102, in which Hei µm/Br and Hei µm/Br are both low, is an example.
We test [Oiii] 5007 Å/H as a Teff diagnostic in starburst galaxies. In comparison to Hei /H, [Neiii]/[Neii], and Hei µm/Br, we find that [Oiii]/H is systematically elevated. While aperture mismatch may contribute to the poor correlation with [Neiii]/[Neii], the other two diagnostics were observed with apertures comparable to that for [Oiii]/H. We suggest that shock–excitation of [Oiii] by supernovae is the likely cause of very high [Oiii]/H, and that this effect plus differing sensitivities to extinction may explain the considerable scatter and lack of correlation with the other Teff diagnostics.
We attempt to test optical He and H recombination line ratios. Sample sizes in the literature are too small to compare Hei /H or Hei /H to each other or to [Neiii]/[Neii], Hei µm/Br, or Hei µm/Br. Instead, we estimate Teff in galaxies by the latter three diagnostics, and test for a correlation with Hei /H. We find a correlation at significance. We re-evaluate the optical nebular lines of NGC 3049, and find them consistent with the age and IMF inferred from the UV spectrum; this removes the discrepancy between the UV and nebular diagnostics noted previously using less sophisticated stellar atmospheres.
We show that the mid–infrared lines and Hei µm/Br give consistent answers for well-studied starbursts, lending credibility to the mid–infrared lines’ use as diagnostics of starburst ionizing fields. We also demonstrate theoretically that the behavior of these lines in starbursts should be dominated by Teff for galaxies with similar metallicity.
Having found the mid–infrared line ratios to be credible Teff diagnostics, we use them to address the conditions in starbursts. Thornley et al. (2000) found low values of the [Neiii] µm / [Neii] µm ratio in their sample of starburst galaxies. In the context of our models, this result would suggest that high–mass, solar–metallicity starbursts form fewer M M☉ stars than a Salpeter IMF. Adding dust, lowering the metallicity, choosing a different stellar atlas, or choosing a more extended star formation history would strengthen this conclusion.
However, another more likely possibility can account for this result. The relatively high density and temperature of the interstellar medium in nuclear starbursts should increase the duration of the ultracompact Hii region phase. As a result, most of the very massive stars may spend virtually their entire main sequence lifetimes embedded within dense, highly extincted regions, and thus will be nearly undetectable to conventional optical or near-to-mid– infrared spectroscopy. This situation will make it difficult to determine the high–mass IMF in starbursts.
In contrast to the high–mass, solar–metallicity starbursts, in the low–mass, low–metallicity galaxies II Zw 40 and NGC 5253, high neon line ratios seem to require stars more massive than – M☉. This contrast can be understood if these galaxies form stars in regions where the interstellar medium is less effective at confining ultracompact Hii regions, or if the lifetimes of these regions are reduced at low metallicity.
References
- Aannestad (1989) Aannestad, P. A. 1989, ApJ, 338, 162
- Andersen (1991) Andersen, J. 1991, A&A Rev., 3, 91
- Armus et al. (1989) Armus, L., Heckman, T. M., & Miley, G. K. 1989, ApJ, 347, 727
- Achtermann & Lacy (1995) Achtermann, J. M., & Lacy, J. H. 1995, ApJ, 439, 163
- Alonso-Herrero et al. (2000) Alonso-Herrero, A., Rieke, G. H., Rieke, M. J., & Scoville, N. Z. 2000, ApJ, 532, 845
- Alonso-Herrero et al. (2001) Alonso-Herrero, A., Engelbracht, C. W., Rieke, M. J., Rieke, G. H., & Quillen, A. C. 2001, ApJ, 546, 952
- Bashkin & Stoner (1975) Bashkin, S., & Stoner, J. O. 1975, Atomic Energy Levels and Grotrian Diagrams, Vol. 1 (Amsterdam: North–Holland Pub.)
- Beck et al. (1997) Beck, S. C., Kelly, D. M., & Lacy, J. H. 1997, AJ, 114, 585
- Beck et al. (2000) Beck, S. C., Turner, J. L., & Kovo, O. 2000, AJ, 120, 244
- Bono et al. (2002) Bono, G., Balbi, A., Cassisi, S., Vittorio, N., & Buonanno, R. 2002, ApJ, 568, 463
- Bosker et al. (1997) Boker, T., Forster-Schreiber, Natascha M., Genzel, R. 1997, AJ, 114, 1883
- Cardelli et al. (1989) Cardelli, J. A., Clayton, G. C., & Mathis, J. S. 1989, ApJ, 345, 245
- Chandar et al. (2003) Chandar, R., Leitherer, C., Tremonti, C., Calzetti, D. 2003, ApJ, 586, 939
- Chernoff & Weinberg (1990) Chernoff, D. A. & Weinberg, M. W. 1990, ApJ, 351, 121
- Crowther et al. (1999) Crowther, P. A., Beck, S. C., Willis, A. J., Conti, P. S., Morris, P. W., & Sutherland, R. S. 1999, MNRAS, 304, 654
- De Pree et al. (1995) De Pree, C. G., Rodriǵuez, L. F., & Goss, W. M. 1995, Rev. Mexicana Ast. y Ast., 31, 39.
- Diaz et al. (1990) Diaz, A. I., Terlevich, E., Pagel, B. E., Vilchez, J. M., & Edmunds, B. E. 1990, RMxAA, 21, 223
- Doherty et al. (1995) Doherty, R. M., Puxley, P. J., Lumsden, S. L., & Doyon, R. 1995, MNRAS, 277, 57
- Doyon et al. (1992) Doyon, R., Puxley, P. J., & Joseph, R. D. 1992, ApJ, 397, 117
- Engelgracht (1996) Engelbracht, C. W. 1996, Supplement to Data Reduction for FSpec, Univ. Arizona Internal Report
- Engelbracht et al. (1996) Engelbracht, C. W., Rieke, M. J., Rieke, G. H., & Latter, W. B. 1996, ApJ, 467, 227
- Engelbracht (1997) Engelbracht, C. W. 1997, Ph.D. Dissertation, Univ. Arizona
- Engelbracht et al. (1998) Engelbracht, C. W., Rieke, M. J., & Rieke, G. H. 1998, ApJ, 505, 639
- Ferland (1997) Ferland, G. J. 1997, Hazy, Univ. Kentucky Internal Report
- Feuchtgruber et al. (1997) Feuchtgruber, H. et al.1997, ApJ, 487, 962
- Feuchtgruber et al. (2001) Feuchtgruber, H., Lutz, D., Beintema, D. 2001, ApJS, 136, 221
- Figer et al. (2002) Figer, D. F., et al. 2002, ApJ, 581, 258
- Förster Schreiber et al. (2001) Förster Schreiber, N. M., Genzel, R., Lutz, D., Kunze, D., & Sternberg, A. 2001, ApJ, 552, 544
- Galavis et al. (1997) Galavis, M. E., Mendoza, C., & Zeippen, C. J. 1997, A&A Supplement, 123, 159
- Garciá-Segura & Franco (1996) Garciá-Segura, G., & Franco, J. 1996, ApJ, 469, 171.
- Garnett (1989) Garnett, D. R. 1989, ApJ, 345, 282
- Genzel et al. (1995) Genzel, R., Weitzel, L., Tacconi-Garman, L. E., Bleitz, M., Cameron, M., Krabbe, A., Lutz, D., & Sternberg, A. 1995, ApJ, 444, 129
- Gies et al. (2002) Gies, D. R., Penny, L. R., Mayer, P., Drechsel, H., & Lorenz, R. 2002, ApJ, 574, 957
- Giveon et al. (2002) Giveon, U., Sternberg, A., Lutz, D., Feuchtgruber, H., & Pauldrach, A. W. 2002, ApJ, 566, 880
- González Delgado et al. (2002) González Delgado, R., Leitherer, C. L., Stasińska, G., & Heckman, T. M. 2002, ApJ, 580, 824
- González Delgado et al. (1999) González Delgado, R., García-Vargas, M. L., Goldader, J., Leitherer, C., & Pasquali, A. 1999, ApJ, 513, 707
- Guseva et al. (2000) Guseva, N. G., Izotov, Y. I., & Thuan, T. X. 2000, ApJ, 531, 776
- Hameed & Devereus (1999) Hameed, S. & Devereus, N. 1999, AJ, 118, 730
- Hanson et al. (2002) Hanson, M. M., Luhman, K., L., & Rieke, G. H. 2002, ApJS, 138, 35
- Heckman (1997) Heckman, T. M. 1997, in Star Formation Near and Far, ed. S. S. Holt & L. G. Mundy (Wodbury, NY: AIP Press), 271
- Hillier & Miller (1998) Hillier, D. J., & Miller, D. L., 1999, ApJ, 496, 407
- Ho et al. (1990) Ho, P. T., Beck, S. C., & Turner, J. L. 1990, ApJ, 349, 57
- Ho et al. (1997) Ho, L. C., Filippenko, A. V., & Sargent, W. L. W. 1997, ApJS, 112, 315
- Hummer & Storey (1987) Hummer, D. G., & Storey, P. J. 1987, MNRAS, 224, 801
- Izotov & Trihn (1998) Izotov, Y. I., & Thuan, T. X. 1998, ApJ, 500, 188
- Kennicutt (1998) Kennicutt, R. C., 1998, ARA&A, 36, 189
- Kennicutt (1998) Kennicutt, R. C., 1998, in ASP Conf. Ser. 142, The Stellar Initial Mass Function, ed. G. Gilmore & D. Howell (San Francisco: ASP), 61
- Kennicutt et al. (2000) Kennicutt, R. C., Bresolin, F., French, H., & Martin, P. 2000, ApJ, 537, 589
- Keto (2002) Keto, E. 2002, ApJ, 580, 980.
- Kewley et al. (2003) Kewley, L., Dopita, M., Evans, I., Groves, B., Sutherland, R., Binette, L., Allen, M., & Leitherer, C. 2003, in preparation
- Kobulnicky & Johnson (1999) Kobulnicky, H. A., & Johnson, K. E. 1999, ApJ, 527, 154
- Kobulnicky et al. (1999) Kobulnicky, H. A., Kennicutt, R. C., Jr., & Pizagno, J. L. 1999, ApJ, 514, 544
- Krabbe et al. (1994) Krabbe, A., Sternberg, A., & Genzel, R. 1994, ApJ, 425, 72
- Kunze et al. (1996) Kunze, D. et al. 1996, A&A, 315, L101
- Kurtz et al. (1994) Kurtz, S., Churchwell, E., & Wood, D. O. S. 1994, ApJS, 91, 659.
- Lehnert & Heckman (1996) Lehnert, M. D., & Heckman, T. M. 1996, ApJ, 472, 546
- Leitherer (1998) Leitherer, C. 1998, in ASP Conf. Ser. 142, The Stellar Initial Mass Function, ed. G. Gilmore & D. Howell (San Francisco: ASP), 61
- Leitherer et al. (1995) Leitherer, C., Ferguson, H. C., Heckman, T. M., & Lowenthal, J. D. 1995, ApJ, 454, L19
- Leitherer et al. (1999) Leitherer, C. et al. 1999, ApJS, 123, 3
- Lejeune et al. (1997) Lejeune, T., Cuisinier, F., & Buser, R. 1997, A&AS, 125, 229
- Lester et al. (1990) Lester, D. F., Gaffney, N., Carr, J. S., & Joy, M. 1990, ApJ, 352, 544
- Livingston and Wallace (1991) Livingston, W. & Wallace L. 1991, N.S.O. Technical Report #91-001
- Lumsden et al. (1994) Lumsden, S. L., Puxley, P. J., & Doherty, R. M. 1994, MNRAS, 268, 821
- Lumsden et al. (2001a) Lumsden, S. L., Puxley, P. J., & Hoare, M. G. 2001a, MNRAS, 320, 83
- Lumsden et al. (2001b) Lumsden, S. L., Puxley, P. J., & Hoare, M. G. 2001b, MNRAS, 328, 419
- Maiolino et al. (1996) Maiolino, R., Rieke, G. H., & Rieke, M. J. 1996, AJ, 111, 537
- Mal’Kov (1997) Mal’Kov, Y. F. 1997, Astronomy Reports, 41, 760
- Martín–Hernández et al. (2002) Martín–Hernández, N. L., Vermeij, R., van der Hulst, J. M., & Peeters, E. 2002, A&A, 389, 286
- Martín–Hernández et al. (2002) Martín–Hernández, N. L., et al. 2002, A&A, 381, 606
- Mihalas (1972) Mihalas, D. 1972, Non–LTE Model Atmospheres for B and O Stars, NCAR-TN/STR-76
- Montgomery et al. (1969) Montgomery, E. F., Connes, P., Connes, J., & Edmonds, F. N. 1969, ApJS, 167, 19
- Morisset (2003) Morisset, C., 2003, ApJ, in press (astro-ph/0310275)
- Morisset et al. (2003) Morisset, C., Schaerer, D., Bouret, J.–C., & Martins, F. 2003, A&A, in press (astro-ph/0310151)
- Nagamine (2002) Nagamine, K. 2002, ApJ, 564, 73
- Niemela & Bassino (1994) Niemela, V. S., & Bassino, L. P. 1994, ApJ, 437, 332
- Oey et al. (2000) Oey, M. S., Dopita, M. A., Shields, J. C., & Smith, R. C. 2000, ApJS, 128, 511
- Osterbrock (1989) Osterbrock, D. E. 1989, Astrophysics of Gaseous Nebulae and Active Galactic Nuclei (Sausalito: University Science Books)
- Osterbrock & Pogge (1987) Osterbrock, D. E., & Pogge, R. W. 1987, ApJ, 323, 108
- Ostrov et al. (2000) Ostrov, P. G., Lapasset, E., & Morrell, N. I. 2000, A&A, 356, 935
- Pauldrach et al. (2001) Pauldrach, A. W. A., Hoffmann, T. L., & Lennon, M. 2001, A&A, 375, 161
- Pauldrach et al. (1998) Pauldrach, A. W. A., Lennon, M., Hoffmann, T. L., Sellmaier, F., Kutritzki, R.-P., & Puls, J. 1998, in ASP Conf. Ser. 131, Properties of Hot Luminous Stars, ed. I. Howarth (San Francisco: ASP), 258
- Pogge (1989) Pogge, R. 1989, ApJS, 71, 433
- Raymond et al. (1988) Raymond, J. C., Hester, J. J., Cox, D., Blair, W. P., Fesen, R. A., & Gull, T. R. 1988, ApJ, 324, 869
- Rieke (2000) Rieke, G. H. 2000, in Springer Proc. in Physics 88, Starburst Galaxies: Near and Far, ed. L. Tacconi & D. Lutz (Berlin: Springer), 73
- Rieke et al. (1993) Rieke, G. H., Loken, K., Rieke, M. J., & Tamblyn, P. 1993, ApJ, 412, 99
- Rieke & Lebofsky (1985) Rieke, G. H., & Lebofsky, M. J. 1985, ApJ, 288, 618
- Rieke et al. (1980) Rieke, G. H., Lebofsky, M. J., Thompson, R. I., Low, F. J., & Tokunaga, A. T. 1980, ApJ, 238, 24
- Roche et al. (1991) Roche, P. F., Aitken, D. K., Smith, C. H., & Ward, J. M. 1991, MNRAS, 248, 606
- Salpeter (1955) Salpeter, E. E. 1955, ApJ, 121, 161
- Schaerer et al. (1996a) Schaerer, D., de Koter, A., Schmutz, W., & Maeder, A. 1996a, A&A, 310, 837
- Schaerer et al. (1996b) Schaerer, D., de Koter, A., Schmutz, W., & Maeder, A. 1996b, A&A, 312, 475
- Schaerer & de Koter (1997) Schaerer, D., & de Koter, A. 1997, A&A, 322, 598
- Schmutz et al. (1992) Schmutz, W., Leitherer, C., & Gruenwald, R. 1992, PASP, 104, 1164
- Shields (1993) Shields, J. C. 1993, ApJ, 419, 181
- Schinnerer et al. (1997) Schinnerer, E., Eckart, A., Quirrenbach, A., Boker, T., Tacconi-Garman, L. E., Krabbe, A., & Sternbert, A. 1997, ApJ, 488, 174
- Seaquist et al. (1998) Seaquist, E. R., Frayer, D. T., & Bell, M. B. 1998, ApJ, 507, 745
- Smith et al. (2002) Smith, L. J., Norris, R. P. F., & Crowther, P. A. 2002, MNRAS, 337, 1309
- Stasińska & Leitherer (1996) Stasińska, G. & Leitherer, C. 1996, ApJS, 107, 661
- Storchi–Bergmann et al. (1995) Storchi–Bergmann, T., Kinney, A. L., & Challis, P. 1995, ApJS, 98, 103
- Sugai & Taniguchi (1992) Sugai, H., & Taniguchi, Y., 1992, AJ, 103, 1470
- Thornley et al. (2000) Thornley, M. D., Förster Schreiber, N. M., Lutz, D., Genzel, R., Spoon, H. W. W. & Kunze, D. 2000, ApJ, 539, 641
- Turner et al. (1998) Turner, J. L., Ho, P. T. P., & Beck, S. C. 1998, AJ, 116, 1212
- Vacca et al. (2002) Vacca, W. D., Johnson, K. E., & Conti, P. S. 2002, AJ, 123, 772
- Vacca & Conti (1992) Vacca, W. D., & Conti, P. S. 1992, ApJ, 401, 543
- Vaceli et al. (1997) Vaceli, M. S., Viegas, S. M., Gruenwald, R., & de Souza, R. E. 1997, AJ, 114, 1345
- van Hoof et al. (2000) van Hoof, P. A., Beintema, D. A., Verner, D. A., Ferland, G. J. 2000, A&A, 354, 41
- Vanzi & Rieke (1997) Vanzi, L. & Rieke, G. H. 1997, ApJ, 479, 694
- Vanzi et al. (1996) Vanzi, L., Rieke, G. H., Martin, C. L., & Shields, J. C. 1996, ApJ, 466, 150
- Vílchez & Pagel (1988) Vílchez, J. M., & Pagel, B. E. J. 1988, MNRAS, 231, 257
- Webster & Smith (1983) Webster, B. L., & Smith, M. G. 1983, MNRAS, 204, 743
- Williams et al. (1993) Williams, D. M., Thompson, C. L., Rieke, G. H., & Montgomery, E. F. 1993, Proc. SPIE, 1946, 482
- Wu et al. (1998) Wu, H., Zou, Z. L., Xia, X. Y., & Deng, Z. G. 1998, A&A Supplement, 127, 521
| Te (K) | C1.7 |
|---|---|
| 5000 | 0.95 |
| 10000 | 1.000 |
| 20000 | 1.05 |
| Integration times (seconds) | |||
|---|---|---|---|
| Source | @µm | @µm | @µm |
| He 2-010 (catalog He 2-010) | 3840 | ||
| NGC 3077 (catalog NGC 3077) | 5760 | 960 | 960 |
| NGC 3504 (catalog NGC 3504) | 5760 | 480 | 480 |
| NGC 4102 (catalog NGC 4102) | 6720 | 960 | 960 |
| NGC 4214 (catalog NGC 4214) | 1920 | 480 | 480 |
| NGC 4861 (catalog NGC 4861) | 5760 | ||
| NGC 6217 (catalog NGC 6217) | 960 | 960 | |
| Transition | (µm) |
|---|---|
| Br11 | |
| Hei | |
| Br10 | |
| Hei | |
| H2 | |
| Br |
| Object | Hei 1.7 | Hei 1.7 | Hei 2.06 | Hei 2.06 | Hei 2.06 |
|---|---|---|---|---|---|
| source: | continuum–subtracted | raw, this work | this work | literature | weighted mean |
| He 2–10 | (1); (2) | ||||
| NGC 3077 | (1) | ||||
| NGC 3504 | aaWithout stellar continuum subtraction, the Hei µm line cannot be measured. | (3)bbValue ignored in computation of weighted mean. Our spectrum has much higher signal–to–noise. | |||
| NGC 4102 | ccFor the Hei 1.7 feature, we directly summed flux rather than fit a Gaussian. | aaWithout stellar continuum subtraction, the Hei µm line cannot be measured. | (3); (4) | ||
| NGC 4214 | ddBr was contaminated by an OH sky line in this galaxy, so the Hei µm/Br ratio we quote is scaled from Hei µm/Br, assuming . | ddBr was contaminated by an OH sky line in this galaxy, so the Hei µm/Br ratio we quote is scaled from Hei µm/Br, assuming . | (1) | ||
| NGC 4861 | ddBr was contaminated by an OH sky line in this galaxy, so the Hei µm/Br ratio we quote is scaled from Hei µm/Br, assuming . | d,ed,efootnotemark: | (1) | ||
| NGC 6217 |
| line ratio | value for Myr, | peak value, | MS star at | WN at | WC at |
|---|---|---|---|---|---|
| Mup M☉ | Mup M☉ | K | K | K | |
| Hei µm/Br | |||||
| Hei µm/Br |
| Galaxy | Hei µm/Br | Hei µm/Br | [Neiii]/[Neii] | Hei /H | Hei /H |
|---|---|---|---|---|---|
| NGC 3628 | (1) | not det | not det | ||
| M82 nucleus | (2) | (2) | 0.35 | not det | |
| NGC 6946 | (1) | (3) | not det | not det | |
| NGC 972 | (3) | not det | |||
| NGC 660 | (1) | not det | |||
| NGC 4102 | not det | ||||
| NGC 6240 | (1) | (3) | not obs | not obs | |
| NGC 3690 | to aaTwo pointings. (3) | not det | |||
| NGC 278 | (3) | not det | not det | ||
| NGC 3504 | not det | ||||
| NGC 4214 | |||||
| NGC 3077 |
| Object | Hei 1.7 | Hei 2.06 | ISO Mid–IR | Ground Mid–IR |
|---|---|---|---|---|
| M82–nucleus (catalog M82) | (1) | (1) | [Ariii]/[Neii] (2a) | |
| [Siv]/[Neii] (2a) | ||||
| M82–E1 | [Ariii]/[Neii] (2) | |||
| [Siv]/[Neii] (2) | ||||
| M82–W1/B2 | (1) | (1) | [Ariii]/[Neii] (2) | |
| [Siv]/[Neii] (2) | ||||
| M82–W2/B1 | (1) | (1) | [Ariii]/[Neii] (2) | |
| [Siv]/[Neii] (2) | ||||
| M82–SWS | (1a) | (1a) | [Neiii]/[Neii] (1) | [Ariii]/[Neii] (2b) |
| [Ariii]/[Arii] (1) | [Siv]/[Neii] (2b) | |||
| [Siv]/[Siii] (1) | ||||
| NGC 253 (catalog NGC 253) | (3) | (4) | [Neiii]/[Neii] (5) | [Ariii]/[Neii] (6) |
| [Siv]/[Neii] (6) | ||||
| NGC 4102 (catalog NGC 4102) | [Ariii]/[Neii] (6) | |||
| [Siv]/[Neii] (6) | ||||
| NGC 6946 (catalog NGC 6946) | (4) | [Neiii]/[Neii] (5) | ||
| NGC 6240 (catalog NGC 6240) | (4) | [Neiii]/[Neii] (5) | ||
| He 2–010 (catalog He 2-010) | (11,8) | [Siv]/[Neii] (12) | ||
| [Ariii]/[Neii] (12) | ||||
| II Zw40 (catalog II Zw 40) | (7) | (7) | [Neiii]/[Neii] (5) | [Siv]/[Neii] (6) |
| [Ariii]/[Neii] (6) | ||||
| NGC 5253 (catalog NGC 5253) | (8) | (9) | [Neiii]/[Neii] (5) | [Siv]/[Neii] (10) |
| [Ariii]/[Neii] (10) |