Multifrequency radio continuum observations of NGC 1569: Evidence for a convective wind
Abstract
We present high-sensitivity radio continuum observations with the VLA and Ryle Telescope at 1.5, 4.9, 8.4 and 15.4 GHz of the dwarf irregular galaxy NGC 1569. The radio data show an extended, irregularly-shaped halo with filamentary structure around the galaxy. The spectral index maps reveal an unusually patchy distribution with regions of flat spectral index extending into the halo. The data allow us to perform a spatially-resolved spectral fitting analysis of the continuum emission from which we derive maps of the thermal and synchrotron emission. The thermal radio emission is concentrated towards the brightest H ii region west of the super star clusters A and B whereas the distribution of the synchrotron emission peaks in a bar-like structure in the disk extending between the two clusters. The total flux density of the thermal radio emission allows us to derive the integrated synchrotron spectrum and we confirm the break in the spectrum that was found by Israel & de Bruyn (1988). We discuss various possibilities that could produce such a break and conclude that the only mechanism able to fit the radio data and being consistent with data at other wavelengths is a convective wind allowing cosmic ray electrons to escape from the halo.
keywords:
galaxies: individual: NGC 1569 – galaxies: starburst – radio continuum: galaxies – cosmic rays – convection1 Introduction
NGC 1569 is a nearby dwarf irregular galaxy (we adopt a distance of Mpc, 1988), currently in the aftermath of a starburst. The high star-formation rate (SFR) has produced numerous young star-clusters (, 2000), the most luminous being the super star clusters (SSC) A and B (Ables, 1971). The interstellar medium (ISM) reflects the imprints of the active star formation in different ways. The atomic gas exhibits an unusually high velocity dispersion (Stil & Israel, 2000) and there is a remarkable hole in the HI distribution, situated close to SSC A (, 1990). The H emission is particularly unusual with a very filamentary structure, reminiscent of an explosion (Waller, 1991), and showing a complex velocity field consistent with the presence of many bubbles (Tomita, Ohta & Saito, 1994). From the kinematics of the H filaments (de Vaucouleurs et al.1974, Waller 1991, 1995, Martin, Kobulnicky & Heckman Martin et al. 2002) and from X-ray emission (1995, Martin et al. 2002) the presence of an outflow of gas can be inferred. A possible trigger for the starburst is the interaction with a HI cloud at 5 kpc from NGC 1569 (, 1998).
Numerous studies at different wavelengths have shed light on the star formation history. The analysis of colour-magnitude diagrams shows an increased level of star formation (SF) starting about 100 Myr ago and stopping 4 – 10 Myr ago (Vallenari & Bomans 1996, 1998). A drop of the SFR about 4 – 10 Myr ago has also been inferred by (1995) from the paucity of stars more massive than about 20 – 25 and from the low excitation temperature of the ionized gas derived from spectroscopy. Assuming a Salpeter initial mass function (IMF), with a slope of 2.35, and lower and upper mass cut-offs at 0.1 and 120 , (1998) found a SFR of 0.5 yr-1 with little change during the starburst phase (for an IMF slope of 2.6 the rate increases to 1 yr-1). This SFR is very high compared to other dwarf galaxies (, 1998). (2000), on the other hand, found that most stellar clusters identified from HST observations had ages of less than 30 Myr, and suggested on this basis that most of the star formation took place towards the end of the starburst period. A similar conclusion was reached by Anders et al. (2003), who analysed multi-wavelength HST observations of a large number of star clusters in NGC 1569 and found from their derived age distribution that a major burst started about 25 Myr ago.
Although the SFR has declined during the last 4 – 10 Myr, it is still high, at least at some localized positions, as demonstrated by the large number of compact H ii regions (Waller, 1991) and the young age of only a few Myr derived for SSC A (, 1997). Waller (1991) derives from the H data a present SFR of 0.4 yr-1 (assuming an “extended Miller-Scalo IMF” with a slope of 2.5 above 1 , 1983). The inferred SFR would be reduced by a factor of 2 when taking into account only H emission from H ii regions (i.e. neglecting diffuse H emission) and thus directly linked to massive star formation. This shows that the SFR has not decreased by more than a factor of about 3–5 during the last 10 Myr compared to the last 100 Myr.
In this paper we present high-resolution radio continuum data at 4 wavelengths for NGC 1569. These data allow us to decompose the radio emission into its two components: free-free emission which is characterized by a spectral index111In this paper we define the spectral index via , where is the flux density at frequency . of and that originates principally in H ii regions, heated by stars with masses above about 20 , and synchrotron emission from diffuse relativistic cosmic ray electrons (CREs). The synchrotron spectrum is steeper, with typically between 0.5 and 1.0, than that of the free-free emission and therefore dominates the radio spectrum at low frequencies, typically below 10 GHz. We assume that the main sites for the acceleration of cosmic rays (CRs) are supernova remnants (SNRs) associated with Type II and Ib supernovae (SNe). Such SNe have progenitors with masses above 8 (1984, 1992) with life times of up to a few times yr. After their injection into the ISM, CREs suffer energy losses mainly due to synchrotron and inverse Compton emission, which make their energy and radio spectra steepen in a characteristic fashion on typical time-scales around yr.
Thus, the fitting of the radio continuum maps allows us to trace the sites of present SF (positions with free-free emission) and probe the time since the CREs were last accelerated, and hence previous epochs of SNe and SF. High frequency observations, preferably above 10 GHz, are necessary for a reliable separation of the thermal and non-thermal radio emission. Previous studies with equivalent data sets were done for the starburst galaxy NGC 2146 (, 1996), the giant spiral galaxy NGC 1961 (, 1998) and the interacting galaxies NGC 4490/4485 (Clemens, Alexander & Green, Clemens et al.1999).
2 Observations and data reduction
1.5 GHz 4.9 GHz
8.4 GHz 15.4 GHz

NGC 1569 was mapped with the VLA222 The VLA is operated by the National Radio Astronomy Observatory for Associated Universities Inc., under a cooperative agreement with the National Science Foundation. at 8.4 GHz and with the Cambridge Ryle Telescope (RT) at 4.9 and 15.4 GHz. Additionally, existing VLA data (B-array) at 1.46 GHz (, 1983) were available. When the observations of NGC 1569 were made (between 1990 and 1993), the RT had a band-width of 280 MHz split into 28 10-MHz frequency channels. Together with the minimum baseline of 18 m this provides excellent temperature sensitivity at both 4.9 and 15.4 GHz. The maximum baseline of the RT is 4.6 km.
The 1.5 GHz data were from (, 1983) and no additional reduction was required. This map was made with uniform weighting and a Gaussian taper in the uv-plane of 30000 , resulting in a 6″synthesized beam.
The 8.4-GHz VLA observations were in the B, C and D arrays and were observed during 1990/91. 3C286 and 3C48 were used as flux calibrators. Reduction of the data followed standard VLA procedures in aips. The data were self-calibrated to convergence using a model consisting of the positive CLEAN components from the task CALIB.
The RT observations were carried out between September 1990 and February 1993. A total of five telescope configurations at each observing frequency were employed giving a nearly fully filled aperture out to a baseline of about 1 km. A minimum of two 12-hour runs in each configuration were obtained (any observation badly affected by interference was rejected). This gave a resolution of approximately arcsec2 at 15.4 GHz and arcsec2 at 4.9 GHz. At 4.9 GHz observations of phase-calibrators were made at the beginning and end of each run, while at 15.4 GHz calibration observations were interleaved with those of NGC 1569. 3C 286 and 3C 48 were observed regularly as flux calibrators. Calibration and data-editing (principally to remove narrow-band and time-varying interference) was performed in the MRAO package postmortem, with subsequent reduction in aips and the MRAO package anmap.
The maps at 4.9, 8.4 and 15.4 GHz were matched to the same spatial sensitivity as the 1.5 GHz map by restricting the uv-range to values between and , so that all maps were sensitive to spatial scales between about 6″and 120″. After this, the maps were CLEANed. All maps have been corrected for the primary beam responses of the telescopes. This set of four images is shown in Fig. 1 and a summary of their characteristics is given in Table 1.
| Frequency | Telescope | r.m.s noise(1) |
|---|---|---|
| [GHZ] | [mJy/beam] | |
| 1.5 | VLA (B-array)(2) | 0.12 |
| 4.9 | Ryle | 0.13 |
| 8.4 | VLA (B,C,D-array) | 0.09 |
| 15.4 | Ryle | 0.15 |
(1) at a resolution of ″(as the maps in Fig. 1)
(2) from (1983)
The data at 1.5, 4.9 and 8.4 GHz are affected by the lack of short baselines which is reflected as reduced integrated flux densities when compared to single-dish measurements (see Tab. 2). Only the map at 15.4 GHz, where most of the emission is very concentrated, does not show a considerable flux deficit. In order to make the spectral index comparison as accurate as possible, it is therefore crucial to ensure that the spectral index is determined from images all of which are sensitive as far as possible to the same range of spatial structure. The B-array VLA map at 1.5 GHz had the smallest range of spatial sensitivity and restricted therefore the uv-range used in the other maps. To achieve the match, the uv-range of the data in the aperture plane used in the construction of the images above 1.5 GHz was restricted during the mapping process so that the minimum and maximum baselines (measured in wavelengths) used in the imaging were the same; this involved removing baselines from all the high-frequency data. While it is not possible to ensure that the precise sampling of the aperture plane is the same in all cases, for both the VLA and RT the dense sampling near the shortest baselines leads to similar overall coverage of the uv plane.
| Frequency | Flux density | Telescope | Reference |
| [MHz] | [mJy] | ||
| 38 | 2300 580 | CLFST | 1 |
| 57.5 | 1600 500 | Clark Lake | 2 |
| 151 | 940 180 | CLFST | 1 |
| 610 | 610 20 | WSRT | 3 |
| 1415 | 440 15 | WSRT | 3 |
| 1415 | 410 25 | WSRT | 5 |
| 1465 | 285 30 | VLA | 6,16 |
| 1490 | 411 | VLA | 7 |
| 2695 | 270 50 | Effelsberg | 8 |
| 2700 | 365 23 | Green Bank | 9 |
| 4750 | 263 20 | Effelsberg | 10 |
| 4850 | 202 19 | Green Bank | 11,12 |
| 4919 | 210 20 | Ryle | 6 |
| 4995 | 280 20 | WSRT | 3 |
| 5000 | 276 42 | Green Bank | 9 |
| 6630 | 235 30 | Algonquin | 13 |
| 8415 | 125 12 | VLA | 6 |
| 10700 | 156 16 | Effelsberg | 10 |
| 10700 | 154 4 | Effelsberg | 14 |
| 10700 | 171 10 | OVRO | 15 |
| 15360 | 116 13 | Ryle | 6 |
| 24500 | 96 8 | Effelsberg | 10 |
The tables includes the data listed in Israel & de Bruyn (1988) (except for the points that they rejected as unreliable) as well as more recent data. References: (1) (1990), (2) (1990), (3) Israel & de Bruyn (1988), (4) (1998), (5) Hummel (1980), (6) this work, (7) (1987), (8) Pfleiderer, Durst & Gebler (Pfleiderer et al. 1989), (9) (1976), (10) (1986), (11) Gregory & Condon (1991), (12) Becker, White & Edwards (Becker et al. 1991), (13) (1973), (14) (1995), (15) Israel & van der Hulst (1983) (16) (1983)
3 The Radio Properties of NGC 1569
3.1 Structure of the radio emission
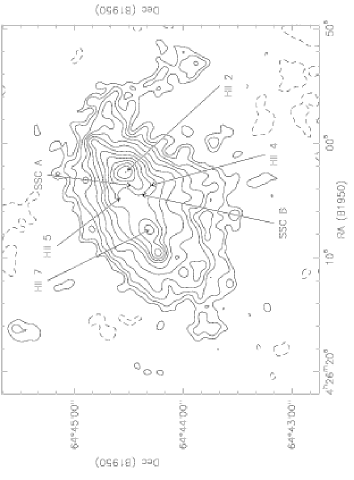
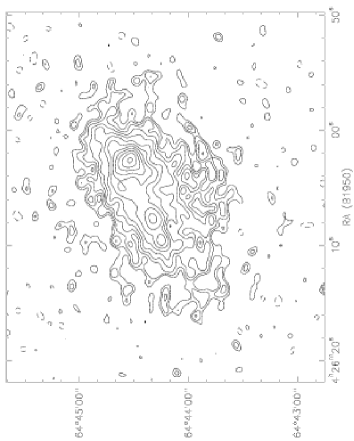
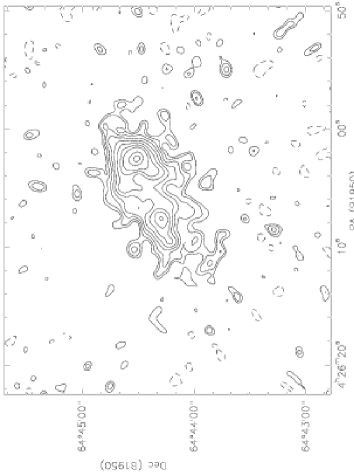
Figure 1 shows the radio emission at the four frequencies at a common resolution of 6 arcsec. At 1.5 GHz most of the emission lies beyond the optical galaxy in an irregularly-shaped halo. Prominent is an arm of emission to the West of the galaxy which coincides with a similar structure in H (Waller, 1991). Along the optical disk the radio emission shows three (at 15 GHz only 2) peaks. The two peaks visible at all four wavelengths coincide with the two brightest H ii regions found by Waller (1991) (number 2 and 7 in his nomenclature). Apart from these features, the overall distribution of the radio emission is in general very similar to the H map of Waller (1991). At higher frequencies the emission becomes more concentrated towards the major axis.
3.2 Spectral index map
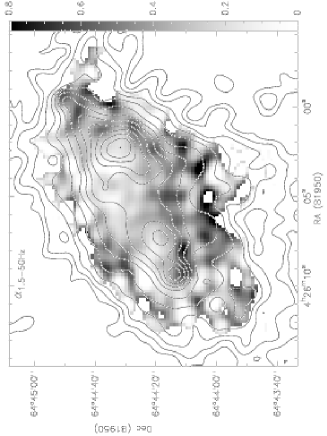
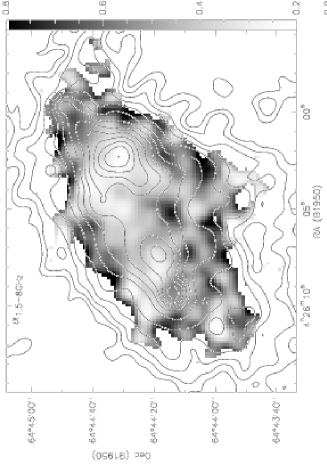
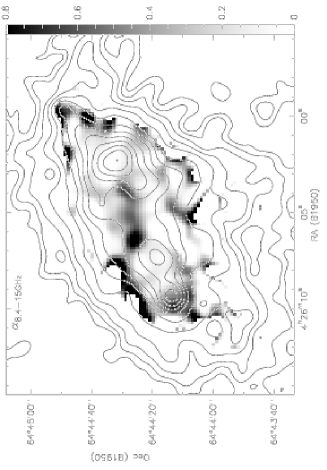
The spectral index maps between 1.5 and 4.9 GHz, between 1.5 and 8.4 GHz and between 8.4 and 15.4 GHz are shown in Fig. 3. Most striking is the extreme patchiness of these maps. The spectrum around the two main maxima of the radio emission and along the disk is flat and there is a trend for the low-frequency spectrum to steepen away from the galactic disk, up to values of at the outermost end of the halo. This steepening does however not occur everywhere and not in a regular way. There are numerous filamentary structures where the spectral index is much lower than in its surroundings and at some places the spectrum even flattens with increasing distance from the centre. The high-frequency spectrum ( shows an elongated region in the centre of the galaxy with a steep spectrum indicating the predominance of synchrotron emission in this region.
4 Spectral Model fitting
The radio-continuum emission consists of both a non-thermal (synchrotron) component and thermal emission. We use a spectral-fitting technique (the same as in (1998), and similar to that in (Clemens et al.1999)), to estimate the two contributions and to determine spatial variations in the form of the synchrotron spectrum. For the set of maps of Fig. 1 we fit a function of the following form at all pixels where the flux densities at the four frequencies exceed three times the noise:
| (1) |
where is the form of the spectrum from an optically thin H ii region, is the synchrotron spectrum from an aged electron population with injection index which have been radiating for a time and , where is the break frequency (see below). During the fitting procedure the minimum in is found by varying , and with the additional constraint that they are positive definite.
The form of the synchrotron spectrum depends on many processes, but to simplify the problem we make the following approximations:
-
1.
The dominant electron energy loss mechanism is by synchrotron radiation and inverse Compton losses. These energy losses are proportional to the energy density of the magnetic field, , and the energy density of the radiation field, , respectively. The magnetic field can be estimated from the standard minimum energy assumption. With a radio size of , a high-frequency cut-off of 8 GHz, a low-frequency cut-off of 100 MHz and a spectral index of 0.45, this yields G (Israel & de Bruyn 1988). can be estimated from the bolometric luminosity, , of the galaxy which we approximate here as the sum of the infrared, optical and UV emission taken from Waller (1991), ( W), by assuming that the radiation emitting matter is distributed spherically:
(2) We derive, with kpc (the average of major and minor axes of 3.6 and 1.8 arcmin), eV cm-3.
-
2.
We neglect propagation effects within the galaxy. A spatially resolved model, as has been done for NGC 2146 (, 1996), is not possible because of the extreme complexity of this galaxy making it impossible to derive the distribution of the sites of CR acceleration as a function of time. Given our small beam size (6 arcsec corresponds to only 66 pc) this assumption most likely does not represent reality, because CREs are able to diffuse this distance (assuming a diffusion coefficient of cm2 s-1 as in our Galaxy) in about yr, a time much shorter than the energy loss time of typically yr. However, this simplifying assumption still allows us to infer a realistic picture of the age distribution of the CREs, because the propagation in NGC 1569 is to a large extent driven by convection, as argued in Sect. 5 and 6, and thus by an energy-independent process, which does not alter the shape of the synchrotron spectrum. Therefore, we expect that the CRE spectrum in each pixel mainly reflects the energy losses.
-
3.
We assume that the electrons which are radiating within a given resolution element were all accelerated (injected) a time ago (the electron age). An alternative hypothesis for the star formation history was tested by (Clemens et al.1999). They adopted in addition to the present star formation history a continuous injection of CRs starting some time ago. The results for both star formation histories were practically identical.
-
4.
The electron loss time is much greater than the pitch angle randomization time — the so-called JP model (, 1974).
-
5.
The electron injection index is 1.8, close to the value of 2.0 predicted from simple theoretical models of shock acceleration, and matching the observed low-frequency spectral index of NGC 1569.
With these assumptions the electron energy distribution with an injection index is given by:
| (3) |
with , where is the Thomson cross-section, and is the break energy. The synchrotron spectrum is then obtained by convolving this electron energy distribution with the spectrum of the synchrotron emission of a single electron (see (1996) for explicit formulae). The break frequency is given by:
| (4) |
where is the gyrofrequency.
4.1 Results
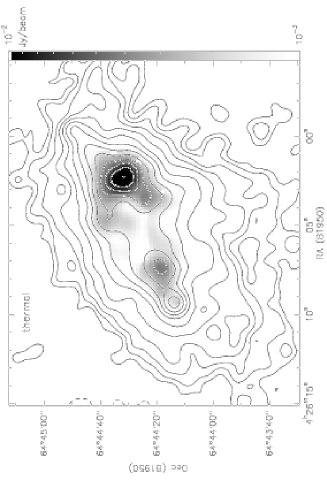
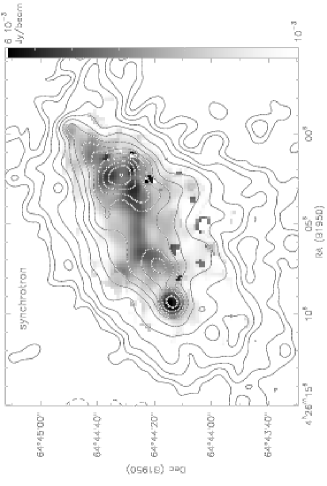
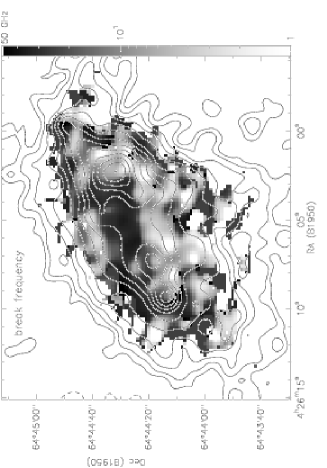
Maps of the synchrotron and thermal emissions and break frequency (which can be translated to CR electron age) are shown in Fig. 4.
The integrated flux density of the thermal emission (Fig. 4 top) that we derive at 1 GHz is mJy. This number should be unaffected by the missing extended flux of our interferometer observations because the thermal emission is very spatially concentrated as can be seen from the 15.4 GHz map in Fig. 1. The total thermal radio emission that we derive by our spectral fitting method corresponds very closely to the value of 97 mJy at 1 GHz estimated by Israel & de Bruyn (1988) from reddening-corrected H measurements. Most of the thermal radio emission is concentrated in the maximum of the radio continuum emission and coincides with the strongest H ii region (number 2) of Waller (1991). Correspondingly, the second strongest H ii region of Waller (number 7) is the second peak of the thermal radio emission. This good agreement between the H and thermal radio emission provides further support to the validity of our fitting method.
The synchrotron emission (Fig. 4 middle) shows only one pronounced peak at the south-eastern end, corresponding to the second strongest peak of the 1.5 GHz emission. Interestingly, this peak is not centered in the galaxy and is far away from the major sites of star formation traced by the thermal radio emission or the SSCs A and B. In the rest of the disk, the synchrotron emission is concentrated towards a bar-like structure along the major axis extending in between the positions of the SSC A and B. The peaks of the thermal and nonthermal radio emission do not coincide. At the maximum of the thermal emission there is only a moderate amount of synchrotron emission but surrounding this position there are several local maxima of synchrotron emission.
The map of break frequency (Fig. 4 bottom) gives ages of several years. The distribution is very patchy and can be divided approximately into two zones, one with relatively young CREs (ages of years) and other regions with older CREs (ages of years). The young CREs coincide with the main synchrotron emission along the major axis of the galaxy, and extend slightly north of it. Towards the halo, the electrons generally become older although there remain patches of relatively young CREs.
The large frequency range used – from 1.5 GHz where synchrotron emission contributes about 75% to the total emission up to 15.4 GHz where the thermal emission is the dominant ( 90%) contribution – allows a reliable separation of both emissions based on their different spectral shapes. We therefore expect the error in the distribution of the synchrotron and thermal emission to be small and in the range of the errors of the individual maps. This is illustrated by a comparison of Fig. 3 and 4 which shows that the thermal emission is strong a places with a flat spectrum whereas strong synchrotron emission coincides with a steep spectrum up to high frequencies. The determination of the break frequency can be much less reliable at places with dominant thermal and little synchrotron emission and at those places where the synchrotron spectrum shows no clear curvature, leading to values of the break frequency below 1.5 or above 15 GHz. Such values outside the range covered by our radio data can only be estimates. The calculation of the electron age from the break frequency depends directly on the adopted values for the magnetic and radiation field. Spatial variations of these two quantities, which are expected to be present but are not included in our model, produce therefore an error in the electron age. The separation of the thermal and synchrotron emission and the determination of the break frequency are however not affected by uncertainties in the magnetic and radiation field.
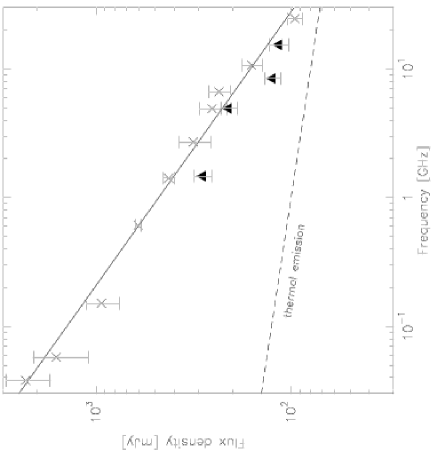
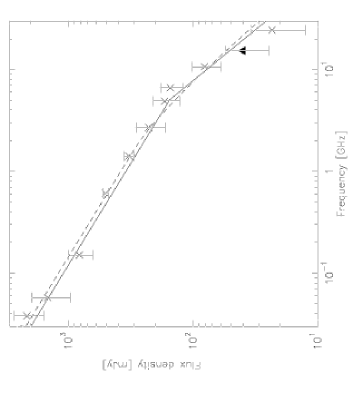
5 Total synchrotron spectrum
The thermal radio emission derived from the spectral fitting procedure of the radio maps allows us to determine the total thermal radio emission and, by subtraction, the total synchrotron spectrum (Fig. 5). Our result confirms the conclusion of Israel & de Bruyn (1988) that the synchrotron spectrum shows an abrupt break, clearly visible in the data points above 10 GHz, because our derivation of the thermal radio emission coincides very well with the estimate of Israel & de Bruyn (1988) from extinction-corrected H emission.
The shape of a synchrotron spectrum is determined by the energy losses, CR propagation processes and the star formation history. We have modeled various possibilities that could produce such a break and found that only two of them are in principle able to explain it. In the next subsections we will describe them as well as the other processes considered.
5.1 Time-dependent star formation
A temporal change in the SFR produces a change in the SN rate and therefore in the CRE production. If the time-scale of this change is shorter than the energy loss time scale of CREs it will be noticeable in the synchrotron spectrum. Deeg et al. (1993) have found evidence for this mechanism to be important in shaping the spectrum of several H ii galaxies. NGC 1569 is a dwarf galaxy with variable SF in the recent past which can be expected to be reflected in its synchrotron spectrum.
The break in the synchrotron spectrum is very sharp, therefore we will assume a change in the SFR as abrupt as possible. We assume that SF started at and ended at . The exact value of is not important, as long as it is sufficiently large (here we chose yr) to have achieved a steady-state situation for massive stars and CREs by that time. We further assume that the stars are produced according to a Salpeter-IMF and that all stars above 8 end their lives in a SN explosion which accelerates CRs. As in the spectral fitting, the main energy losses are assumed to be synchrotron and inverse Compton and we use the values for the magnetic field and the radiation energy density derived in the previous section.
The synchrotron emission is then calculated by solving the time-dependent equation for the electron particle density :
| (5) |
This equation takes into account CR acceleration in SN remnants with a source spectrum as (where is the supernova rate, calculated from the above defined SFR(t), and is the number of relativistic electrons produced per supernova and per unit energy interval), and the subsequent radiative energy losses of the CR electrons ().
The solution of Eq. (5) is given by:
| (6) |
where and is the life-time of the CREs against radiative energy losses. Finally the total synchrotron spectrum is obtained by convolving with the synchrotron emission spectrum of a single electron.
We calculated the spectra as a function of time and selected the best-fit spectra. There are two possible times when a break in the spectrum is produced:
1) A good fit to the data can be achieved soon after the beginning of the starburst, at yr (see Fig.5), with a realistic injection spectral index . The break in the spectrum divides the low frequency range, in which the electrons have not suffered energy losses yet, from the high frequencies where the spectrum is steepened by 0.5 as a result of energy losses. The position of the break is given by the life-time of the electrons against radiative losses, which is yr at 5 GHz (roughly the position of the break) with our values for the magnetic field and .
2) Israel & de Bruyn (1988) suggested that the break in the synchrotron spectrum was due to the abrupt end of the CR injection about yr ago. A cut-off at high energies is then produced above which electrons have already lost their energy since the time of the last CR injection. We have tried to fit the data for times after the end of the starburst. Although a break is indeed produced by this mechanism, we could not find a satisfactory fit to the data. Two reasons are responsible for this failure: 1) A visible break cannot be produced at the high frequencies where it is observed. The main reason is that, even for an abruptly ending SFR, the SN rate does not cease immediately. If stars above 8 , with life-times of yr, become SN, then it takes about this time until the SN rate has ceased after the end of the SF. This time-scale is longer than the CR loss-time scale of years of CR electrons emitting in the range around 5 GHz where the break is observed, so that these high-energy CREs do not experience an abrupt end in the injection. If the SN rate ended abruptly, the break in the spectrum would be more pronounced in better agreement with the data. 2) The low-frequency spectrum is very flat, requiring an unrealistically low injection spectral index () to explain it.
5.2 Escape from the halo
An alternative mechanism causing a break in the spectrum is escape of CREs from the galaxy. If the escape time-scale is comparable to the energy loss time-scale a break of is produced in the spectrum which is sufficient to explain the data if the break is sharp enough. Convection as the mode of propagation is required for this. If diffusion is the dominant propagation mechanism, the frequency variation of the expected radio spectral index is too smooth to account for the sharp break in the data (see next section).
We model this situation as follows: CREs that are produced in the main disk of NGC 1569 convect into the halo with a constant convection velocity, , experiencing synchrotron and inverse Compton losses at the same time. When they reach a distance from the disk, they can escape freely. The one-dimensional convection-energy loss equation describing this situation is:
| (7) |
with being the one-dimensional -function. The solution of this equation is given by:
| (8) |
The synchrotron emission is calculated by first integrating this emission from to , where is the maximum distance that CREs can travel before having lost their energy to below , and then convolving the result with the synchrotron emission spectrum of a single electron.
We use the above values of and , and estimate kpc from the extent of the radio emission at 1.5 GHz. Then, we obtain a good fit to the data with km s-1 (Fig. 5).
5.3 Other possibilities
We have also tested other mechanisms that produce breaks in the spectral index, but none is able to produce the sharp break seen in NGC 1569.
Escape from the halo, as described in the last subsection, in combination with diffusion as the dominant propagation mechanism, produces too weak a frequency variation of the radio spectral index. The reason for this difference is that the scale length for diffusion (i.e. the distance over which CR electrons can propagate before losing their energy), , depends only weakly on energy, even for a constant diffusion coefficient . If the diffusion coefficient depends on energy as with , as derived for the Galaxy (, 1990), the energy dependence of is reduced even more. In the case of convection the scale length has a stronger energy dependence, , and therefore produces a sharper break.
In a closed halo model, a break in the spectrum can be caused by different energy loss processes that are important for different ranges of CRE energies. A break in the synchrotron spectrum of can be caused by adiabatic and bremsstrahlung losses in addition to synchrotron and inverse Compton losses. In some spiral galaxies this can explain the flattening of the synchrotron spectrum towards lower frequencies (, Pohl et al. 1991a). Taking additionally into account ionization losses, that are important at low frequencies, a total break of can be produced. This process is able to explain the low-frequency flattening of the spectrum of NGC 4631 (, Pohl et al.1991b). We have tested these possibilities and even in the latter case, the spectrum has much too weak a curvature and is therefore not able to explain the sharp bend in the synchrotron spectrum of NGC 1569.
A further possibility to explain a flat low-frequency spectrum are absorption processes affecting the synchrotron emission. Whereas synchrotron self-absorption is not important (Deeg et al., 1993), free-free absorption can play a role. We have tested both absorption by a foreground layer and absorption of material mixed with the emitting material (see Deeg et al. 1993, Pohl et al.1991b) and found that in neither case this process is able to explain the sharp break in the spectrum.
6 Discussion
6.1 Star formation history
The maps of thermal radio and synchrotron emission trace the star formation history on different time-scales: Whereas the thermal radio emission traces the star formation of the last years, the synchrotron emission probes a longer timescale. The lifetime of CREs in NGC 1569 range, with the parameters for and adopted here, between a few up to about 10 Myr for electrons radiating in the GHz range. This gives, added to the lifetime of SN progenitor stars of up to 30 Myr, a span of 40 Myr that is probed by the synchrotron emission.
The image of the thermal radio emission in Fig. 4 shows that the recent SF is concentrated to a large extent in one peak, coinciding with the H ii region 2. This position furthermore coincides with the peak of the dust emission (Lisenfeld et al. 2002) and is about 10 arcsec north of the peak of the CO emission (, 1999) showing that this whole area is active in star formation.
The peak of the synchrotron emission in the south-east shows a region that has been the site of star formation in the past. We can derive the SFR from the integrated flux of this region (8 mJy) and derive, using eq. 21 in Condon (1992), /yr for stars more massive than 5 . This is a factor 24 less than the SFR derived from the peak of the thermal radio emission (20 mJy and /yr, using eq. 23 in Condon (1992)) showing that the SFR in the synchrotron peak has been less important than the present-day SF in the west of the galactic disk. Within the disk, the SF traced by the synchrotron emission has a bar-like shape and extends in between the SSC A and B. The ages of these clusters – the stellar populations are estimated to have ages up to 9 Myr (, 1997) – are younger than the SF traced by the synchrotron emission. This might indicate that the formation of the SSC has been triggered by the preceding epoch of close-by SF.
The break in the integrated synchrotron emission can be explained by the effect of variations of the SF in the past. We have shown that it cannot be due the end of the starburst 5 Myr ago, as suggested by Israel & de Bruyn (1988). The break could only be explained by the beginning of the starburst about 10 Myr ago. This explanation is however not in agreement with several other studies that agree that the SFR has declined during the last 5-10 Myr and that the starburst preceding this decline had a duration of about 100 Myr (Vallenari & Bomans 1996, 1998). Therefore we conclude that the abrupt beginning of the SF some 10 Myr ago, necessary to explain the break in the synchrotron spectrum, is unlikely to have taken place.
6.2 Outflow from the halo
Since varying SF has been excluded as a cause of the break in the synchrotron spectrum, the only possible explanation is escape of the CREs from the halo. Such an outflow is not unexpected: massive star formation and the related energy input by SN explosions can lead to an outflow of matter from the galactic disks into the halo. In starbursting dwarf galaxies like NGC 1569 this process is expected to be particularly important due to their relatively small gravitational potential. The unusually large size of the radio halo of NGC 1569 is by itself a sign of a high energy input by SNe (Dahlem, Lisenfeld & Golla, Dahlem et al. 1995). Further strong evidence for the presence of a galactic wind is the weak steepening of the spectral index in the halo indicating a convective outflow of CRs along vertical magnetic field lines which enables a fast (with respect to the energy loss time scale of the CREs) transport of CRs into the halo. Such a magnetic field perpendicular to the disk can be produced by stretching the field along the flow direction of a galactic wind (, 1989). It has been found in the starburst galaxy M 82 (, 1992). Recent polarized radio continuum observations at 8.5 GHz (VLA) and 10.4 GHz (Effelsberg) show indeed an outwardly directly magnetic field in NGC 1569 (Mühle, 2003), supporting the possibility of a convective outflow from NGC 1569.
Further support for the outflow hypothesis is a general similarity between the radio continuum map at 1.5 GHz and the H image, where the irregular halo to the south and a long arm extending from the northwest of the galaxy is clearly visible in both images. At this low frequency the radio emission is predominantly non-thermal. An overall similarity between the H and radio emission in the halos has also been found in NGC 891 (Dahlem, Dettmar & Hummel, 1994), NGC 4631 and NGC 5775 (, 1992). Both emissions are related to regions of active star formation within the galactic disk (Dahlem et al., 1994). A plausible explanation for this coincidence is an outflow of ionized gas due to the high star formation activity which at the same time drags the magnetic field along and enables therefore a convective outflow of the CREs (Dahlem et al. 1995, 2001).
From our fit to the total synchrotron spectrum we derived a convection velocity of 150 km s-1. This value is higher than the escape velocity of this galaxy of 80 – 110 km s-1(Martin, 1998) suggesting that the outflow is able to eject gas from the galaxy. An alternative estimate for the convective velocity can be made from the spectral index maps (Fig. 3). In some filamentary structures the spectral index does not steepen outwardly, indicating that the CREs do not suffer substantial energy losses. Assuming that the CR electrons were produced in the disk and taking an average length of such filaments in the maps of (where the contribution by the thermal radio emission is still small) of 20 – 30′′ (corresponding to 220 – 330 pc) we can derive from the energy loss time-scale of yr at 5 GHz a lower limit for the convective velocity of 50 – 70 km s-1, consistent with the value derived from the total spectrum.
Observations of the hot gas in the halo of NGC 1569 provide independent evidence. (1995) have found indications for a supernova-driven outflow from ROSAT X-ray and H emission. They find that about 25% of the H is in a large ( kpc) complex system with radial velocities of as much as 200 km s-1. This velocity agrees well with our convection velocity derived from the total spectral index. A comparison of the H shell speeds to the escape velocity estimated from the rotation curve and taking into account a dark matter halo, Martin (1998) showed that NGC 1569 is likely to present a substantial loss of shell material from the galaxy. The velocity of the hot gas traced by X-ray emission is well above the escape velocity (Martin, 1999). (Martin et al. 2002) confirmed this conclusion with deep Chandra spectra and found that the outflow is strongly metal-enriched, carrying nearly all the metals ejected by the starburst.
7 Conclusions and summary
We have present high-sensitivity radio continuum observations at 1.5, 4.9, 8.4 and 15.4 GHz of the dwarf irregular galaxy NGC 1569 at a high resolution (6 arcsec). These data allow us to perform a spatially-resolved spectral fitting analysis of the continuum emission from which we derive maps of the thermal and synchrotron emission. The total flux density of the thermal radio emission allows us to derive the integrated synchrotron spectrum. The results from our data and its analysis are:
-
•
The radio data show an extended, irregularly shaped halo with filamentary structures around the galaxy. The spectral indices between 1.5 and 4.9 GHz and between 1.5 and 8.4 GHz show an unusually patchy distribution with regions of flat spectrum extending into the halo.
-
•
The distribution of the thermal and synchrotron emission trace the star formation history on different time-scale ( yr for the thermal emission and yr for the synchrotron emission) in NGC 1569. The thermal radio emission is mainly concentrated in the brightest H ii region west of the super star cluster A and B whereas the synchrotron emission peaks in a bar-like structure in the disk extending in between the two star clusters. The super star clusters are very young ( yr, 1997) and formed after the SF period traced by the synchrotron emission. It is thus possible that their formation has been triggered by the older SF in the bar.
-
•
We confirm the break in the synchrotron spectrum that was found by Israel & de Bruyn (1988). We discuss various possibilities that could produce such a break and find only two that are consistent with the radio data: an abrupt beginning of the star formation about years ago or a convective wind transporting CREs into an open halo. An abrupt end of a starburst several Myr ago, as suggested by Israel & de Bruyn (1988), is not able to explain the data because even in this extreme case the SN rate would not have declined immediately but only over a period of about years. This time scale is longer than the energy loss time scale of CREs so that a sharp break would be considerably smoothed. An abrupt beginning of the starburst years ago is not consistent with data at other wavelengths from which a decline (and not an increase) in the SFR over this time scale is derived (e.g. Vallenari & Bomans 1996, 1998). We thus conclude that the only mechanism able to fit the radio data and being consistent with data at other wavelengths is a convective wind allowing CREs to escape from the halo. This is in agreement with X-ray studies indicating the presence of a galactic wind (1995, Martin et al. 2002).
ACKNOWLEDGMENTS
We would like to thank the referee, U. Klein, for useful suggestions which helped us to improve the paper. UL acknowledges support by the Spanish MCyT AYA2002-03338 and the Junta de Andalucía (Spain).
References
- Ables (1971) Ables, H. D., 1971, Publ. U.S. Naval Obs. Sec. Ser. XX (IV), 61
- Anders et al. (2003) Anders, P., de Grijs, R., Fritze-v. Alvenslegen, U., Bissantz, N., 2004, MNRAS, 347, 17
- Arp & Sandage (1985) Arp, H. C., Sandage, A. R., 1985, AJ, 90, 1163
- (4) Baron, E., 1992, MNRAS, 255, 267
- (5) Berezinsky, V.S., Bulanov, S.V., Ginzburg, V.L., Dogiel, V.A., Ptsuskin, V.S., 1990, Astrophysics of Cosmic Rays, North Holland:Amsterdam
- (6) Becker, R. H., White, R. L., Edwards, A. L., 1991, ApJS, 75, 1
- (7) Clemens, M.S., Alexander, P., Green, D.A., 1999, MNRAS, 307, 481
- (8) Condon, J. J., 1983, ApJS, 53, 459
- (9) Condon, J. J., 1987, ApJS, 65, 485
- (10) Condon, J. J., Cotton, W. D., Greisen, E. W., Yin, Q. F., Perley, R. A., Taylor, G. B., 1998, AJ, 115, 1693
- Condon (1992) Condon, J. J., 1992, ARAA, 30, 575
- Dahlem et al. ( 1994) Dahlem, M., Dettmar, R.-J., Hummel, E., 1994, AA, 290, 384
- (13) Dahlem, M., Lisenfeld, U., Golla, G., 1995, ApJ, 444, 119
- (14) Dahlem, M., Lazendic, J. S., Haynes, R. F., Ehle, M., Lisenfeld, U., 2001, AA, 374, 42
- (15) Dettmar, R.J., 1992, Fund. of Cosmic Phys., 15, 143
- Deeg et al. (1993) Deeg, H.J., Brinks, E., Duric, N., Klein, U., Skillman, E., 1993, ApJ, 410, 626
- (17) de Vaucouleurs, G., de Vaucouleurs, A., & Pence, W., 1974, ApJ, 194, L119
- (18) González Delgado, R.M., Leitherer, C., Heckman, T., Cerviño, M., 1997, ApJ, 483, 705
- (19) Greggio, L., Tosi, M., Clampin, M., de Marchi, G., Leitherer, C., Nota, A., Sirianni, M., 1998, ApJ, 504, 725
- Gregory & Condon (1991) Gregory, P. C., Condon, J. J., 1991, ApJS, 75, 1011
- (21) Heckman, T.M., Dahlem, M., Lehnert, M.D., Fabbiano, G., Gilmore, D., Waller, W.H., 1995, ApJ, 448, 98
- (22) Howarth, N. A., 1990, PhD thesis, University of Cambridge
- Hummel (1980) Hummel, E., 1980, AAS, 41, 151
- (24) Hunter, D.A., O’Connell, R.W., Gallagher, J.S., Smecker-Hane, T.A., 2000, AJ, 120, 2383
- (25) Israel, F. P., 1988, AA, 194, 24
- Israel & van der Hulst (1983) Israel, F. P., van der Hulst, J. M., 1983, AJ, 88, 1736
- Israel & de Bruyn (1988) Israel, F. P., de Bruyn, A. G., 1988, AA, 198, 109
- (28) Israel, F. P., Mahoney, M.J., 1990, ApJ, 352, 30
- (29) Israel, F. P., van Driel, W., 1990, AA, 236, 323
- (30) Jaffe, W.J., Perola, G.C. 1974, AA, 26, 423
- (31) Kennicutt, R.C., 1983, ApJ, 272, 54
- (32) Kennicutt, R.C., 1984, ApJ, 277, 361
- (33) Klein, U., Gräve, A., 1986, AA, 161, 155
- (34) Lesch, H., Crusius, A., Schlickeiser, R., Wielebinski, R., 1989, AA, 217, 99
- (35) Lisenfeld, U., Alexander, P., Pooley, G.G., Wilding, T., 1996, MNRAS, 281, 301
- (36) Lisenfeld, U., Alexander, P., Pooley, G.G., Wilding, T., 1998, MNRAS, 300, 30
- (37) Lisenfeld, U., Israel, F. P., Stil, J., Sievers, A., 2002, AA, 382, 860
- Martin (1998) Martin, C.L., 1998, ApJ, 506, 222
- Martin (1999) Martin, C.L., 1999, ApJ, 513, 156
- (40) Martin, C. L., Kobulnicky, H. A., Heckman, T. M., 2002, ApJ, 574, 663
- (41) McCucheon, W.H., 1973, AJ, 78, 18
- Mühle (2003) Mühle, S., 2003, PhD thesis, University of Bonn
- (43) Niklas, S., Klein, U., Braine, J., Wielebinski, R., 1995, AAS, 114, 21
- (44) Pfleiderer, J., Durst, C., Gebler, K.H., 1980, MNRAS, 192, 635
- (45) Pohl, M., Schlickeiser, R., Hummel, E., 1991a, AA, 250, 302
- (46) Pohl, M., Schlickeiser, R., Lesch, H., 1991b, AA, 252, 493
- (47) Reuter, H.-P., Klein, U., Lesch, H., Wielebinski, R., Kronberg, P.P., 1992, AA,250, 302
- (48) Stil, J., Israel, F.P., 1998, AA, 337, 64
- Stil & Israel (2000) Stil, J., Israel, F.P., 2000, AA,392, 473
- (50) Sulentic, J. W., 1976, ApJS, 32, 171
- Tomita et al. ( 1994) Tomita, A., Ohta,K., Saito, M., 1994, PASJ, 46, 335
- (52) Taylor, C.L., Hüttemeister, S., Klein, U., Greve, A., 1999, AA, 349, 424
- Vallenari & Bomans (1996) Vallenari, A., Bomans, D. J., 1996, AA, 313, 713
- Waller (1991) Waller, W. H., 1991, ApJ, 370, 144