eduardo.bravo@upc.es domingo.garcia@upc.es 22institutetext: Institut d’Estudis Espacials de Catalunya
Explosion Models for Thermonuclear Supernovae Resulting from Different Ignition Conditions
Abstract
We have explored in three dimensions the fate of a white dwarf of mass of as a function of different initial locations of carbon ignition, with the aid of a SPH code. The calculated models cover a variety of possibilities ranging from the simultaneous ignition of the central volume of the star to the off-center ignition in multiple scattered spots. In the former case, the possibility of a transition to a detonation when the mean density of the nuclear flame decreases to g.cm-3 and its consequences are discussed. In the last case, the dependence of the results as a function of the number of initial igniting spots and the chance of some of these models to evolve to the pulsating delayed detonation scenario are also outlined.
1 Statement of the Problem
The analysis of light curves of many Type Ia Supernovae (SNIa) indicates that these events are not as homogeneous as one would desire to use them as perfect standard candles. In fact, the inferred mass of Nickel ejected in the explosion, estimated from the bolometric light curves sun , could range within a factor of ten. From a theoretical point of view, there remain a number of fundamental issues to be solved before we can rely on the predictions of SNIa modeling: pre-supernova evolution (progenitor systems, path of the white dwarf up to the Chandrasekhar mass, ignition conditions), physics of the explosion (subgrid-scale physics vs. large-scale combustion, flame behavior at low densities, deflagration–detonation transition), role of rotation and magnetic fields, etc.
Although one–dimensional (spherical) models of SNIa have succeeded to explain a wide range of observational properties, these kind of models unavoidably rely on phenomenological descriptions of inherently multidimensional processes. Among them, flame acceleration due to hydrodynamic instabilities is of particular importance. Recent multi(3D)dimensional simulations of deflagrations in Chandrasekhar mass white dwarfs have shown that the subsonic propagation of the burning front can release enough energy to unbind the whole star and, maybe, can produce SNIa-like explosions gam ; rei . Although the final test of these models will have to be done by comparing self-consistent calculations of light curves and spectra (computed in three dimensions) with observations, one can already wonder if there is any significant observational evidence of departure from spherical symmetry in SNIa. In this respect, we note that: 1) Light curves are well described by a one-parameter family of curves (e.g. phi ), 2) spectral absorption features by SiII show quite homogeneous profiles from event to event tho , and 3) polarization has not been detected in most SNIa, although there are a few exceptions kas . Supernova remnants (SNR) provide another means to constrain the geometry of the explosions, although it depends also on the presence of interstellar medium inhomogeneities and on the development of further hydrodynamic instabilities. Still, some SNRs do not show large departures from spherical symmetry (e.g. the blast wave of Tycho’s SNR), which implies that both the supernova ejecta and the interstellar medium possessed a high degree of symmetry in these cases (see also the paper by Badenes et al in these proceedings). All these data point to approximately spherical explosions in which the chemical inhomogeneities are constrained to small-size clumps (a quantitative criterion, proposed in tho , is that the area of the individual clumps present at the photosphere has to be lower than of the photospheric area).
Our aim here is to address the following questions:
-
•
Are 3D simulations of thermonuclear supernovae able to cover the full range of light curve variations (up to a factor in 56Ni production)?
-
•
How much the ejecta structure obtained in these simulations deviates from spherical symmetry (overall shape, small-scale clumping)?
We present the results from 3D hydrodynamic simulations starting from different initial conditions. We have explored as well the possible outcomes from deflagration–detonation transitions in 3D. It has to be stressed that all calculations were carried out consistently, i.e. using the same hydrocode gbs , with the same numerical resolution, the same physics, and simulating the whole white dwarf volume to avoid the introduction of artificial and unrealistic symmetry conditions.
2 Computed 3D models, 56Ni productivity and asymmetry
We have started from several ignition configurations, in which the carbon runaway took place either in a central volume, slightly perturbed from spherical symmetry, or in multiple scattered spots or ”bubbles” gw95 . In the second case, we have explored the sensitivity of the results to questions like: How many bubbles ignite simultaneously? Which are the sizes of the hot bubbles? Both theoretical analysis bg03 and 2D simulations hs02 do not seem to favor the formation of a large number of bubbles igniting in phase (i.e. of the same size).
As for the deflagration–detonation transition, up to now there is no convincing mechanism that could account for the acceleration of the burning front up to supersonic velocities, so we have computed delayed detonation models making use of several different algorithms for the initiation of the detonation. In one case, we started the detonation in those points in which the fractal dimension of the flame was larger than 2.5, while in the other cases, the condition for detonation ignition was that the density were lower than g cm-3 and the particles to be detonated were selected according to their radius. The initial deflagration phase of all the delayed detonation models was coincident with the deflagration model given in the first row of Table 1.
In Table 1, there are listed the models computed and the main results of the simulations. In all cases, the ignition started when the white dwarf central density reached g cm-3, and the simulations used 250,000 identical mass particles (each particle was about the same mass as the Earth). The third column in Table 1 gives the final kinetic energy, the fourth column gives the ejected mass of 56Ni, and the fifth column gives the ejected mass of unburned C and O.
| Model category | Ignition configuration | |||
|---|---|---|---|---|
| ( erg) | () | () | ||
| Deflagration | Central volume | 0.26 | 0.27 | 0.65 |
| Deflagration | 6 equal size bubbles | - | 0.21 | - |
| Deflagration | 7 equal size bubbles | - | 0.21 | - |
| Deflagration | 10 equal size bubbles | 0.05 | 0.24 | 0.88 |
| Deflagration | 30 equal size bubbles | 0.44 | 0.56 | 0.58 |
| Deflagration | 90 random size bubbles | 0.45 | 0.58 | 0.58 |
| Delayed detonation | Transition where | 0.75 | 0.54 | 0.39 |
| Delayed detonation | Transition in central layers | 0.48 | 0.40 | 0.55 |
| Delayed detonation | Transition in medium layers | 0.51 | 0.43 | 0.51 |
| Delayed detonation | Transition in external layers | 0.33 | 0.32 | 0.65 |
| Pulsating | ||||
| reverse detonation | 6 bubbles | 0.89 | 0.35 | 0.22 |
As can be seen from Table 1, all the deflagration models gave a kinetic energy too low to account for SNIa properties, with the exception of the two simulations starting from a large number () of bubbles. It is a remarkable result that the explosion properties resulting from these two models were almost the same, even though they started from very different initial conditions (in terms of number and sizes of hot bubbles). The results of these two simulations were as well close to the ones given in rei , for comparable initial conditions, which reinforces the reliability of the outcome we obtained. However, in the deflagration scenario there always remains a large mass of unburned C and O, which would undoubtedly have to be detectable in the optical spectra of SNIa.
All our delayed detonation models gave healthy explosions with reasonable kinetic energies and a wide range of 56Ni masses. If nature provided a range of conditions for transition to detonation as wide as we have explored, the delayed detonation scenario would help to explain the diversity of SNIa explosions observed. However, our 3D simulations have shown that the delayed detonations are relatively inefficient in converting C and O to intermediate mass elements or to iron peak elements (which is in sharp contrast with 1D models of delayed detonations), which results in a lower velocity range than expected. The ultimate reason for this behavior is the geometry of the distribution of fuel resulting from the previous deflagration stage. Due to the unavoidable distortion of the flame front caused by hydrodynamic instabilities during subsonic burning, the initial conditions for delayed detonation formation consist on large plumes of ashes coexisting at the same radii with deep tongues of fuel (see Fig. 1). These ashes’ plumes act as true barriers obstructing the propagation of the detonation waves and, in fact, decoupling large volumes occupied by C and O from other regions which can hold propagating detonations.
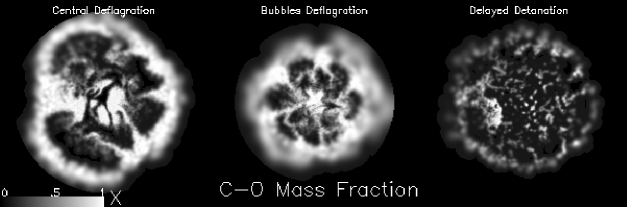
To discuss the geometrical properties of the explosions, we will refer to Fig. 1, in which we show the distributions of the ejected C–O in YZ slices. None of the models displays an overall shape that departs largely from spherical symmetry, although the distribution of chemical species presents irregularities of different sizes. However, the deflagration model starting from a central volume (left image in Fig. 1) is the most asymmetric. This is due to Rayleigh–Taylor instabilities during flame propagation, which favor the formation of large–scale structures that stand out in the final geometry of the ejecta. This configuration is in clear disagreement with the limits to the size of clumps given in tho . In the case of deflagrations starting from hot bubbles, the geometrical appearance of the ejecta retains a larger degree of spherical symmetry, but still the chemical inhomogeneities represent a large fraction of the radius of the star. We have estimated that, in the model starting from 30 bubbles (center image in Fig. 1), a typical clump size is of the ejecta radius, still too large.
Delayed detonations (right image in Fig. 1) are approximately spherical in shape, and show only small clumps. We have estimated a typical clump size of of the ejecta radius in these kind of models. This could seem a striking result, as the delayed detonations were computed starting from the final configuration of the deflagration shown in the left image in Fig. 1. The reason for this apparent contradiction is that the detonations were able to destroy the large structures built up during the deflagration phase, thus allowing the formation of only small-sized chemically differentiated clumps.
3 Discussion and a new SNIa paradigm
To summarize, deflagrations computed in 3D produce large clumps, ejecta with low kinetic energy, reasonable quantities of 56Ni, and too much unburned C–O (). On the other hand, multidimensional delayed detonations produce smaller clumps, although they are not as efficient as their 1D counterparts at rising the kinetic energy ( erg) nor at burning C and O (). In addition, we have seen that deflagrations starting from a reasonable number of bubbles () fail to unbind the white dwarf, which brings us to the following question: What is the fate of the white dwarf following explosion failure?
We have followed the evolution of the star during the first pulsation with the 3D SPH code. What came out from this multidimensional calculation was in fact quite different from what is obtained in 1D pulsating models. Due to the ability of bubbles to float to large radii in 3D, most of the thermal and kinetic energy resided in the outer parts of the structure, which resulted in an early stabilization of the central region (mostly made of C and O, i.e. fuel) while the outer layers were still in expansion. Few seconds later, an accretion shock formed at the border of the central nearly hydrostatic core (whose mass was about ). Therefore, the temperature at the border of the core increased to nearly K, on a material composed mainly by fuel but with a non-negligible amount of hot ashes, thus giving rise to a highly explosive scenario. If a detonation were ignited at this point, it would probably propagate all the way inwards through the core, burning most of it and producing an energetic explosion. We have called this new paradigm of SNIa explosion mechanism the Pulsating Reverse Detonation. Currently, we are in the process of completing the 3D calculation of its detonating phase. As a first evaluation of what one can expect from this new scenario, we have computed a 1D model (last row in Table 1), which ended with the largest kinetic energy, and the lowest mass of C and O from all the set of models we have computed in 3D up to now. It turns out that it is worth following the evolution of this scenario in 3D to see if it can derive in a new reliable and competitive model of SNIa.
References
- (1) N.B. Suntzeff: Optical, infrared, and bolometric light curves of Type Ia supernovae. In: From Twilight to Highlight: The Physics of Supernovae, ed by W. Hillebrandt, B. Leibundgut (Springer, Berlin 2003) pp 183–192
- (2) V.N. Gamezo, A.M. Khokhlov, E.S. Oran et al: Science 299, 77 (2003)
- (3) M. Reinecke, W. Hillebrandt, J.C. Niemeyer: A& A 391, 1167 (2002)
- (4) M.M. Phillips, P. Lira, N.B. Suntzeff et al: AJ 118, 1766 (1999)
- (5) R.C. Thomas, D. Kasen, D. Branch, D., E. Baron: ApJ 567, 1037 (2002)
- (6) D. Kasen, P. Nugent, L. Wang et al: ApJ 593, 788 (2003)
- (7) D. García-Senz, E. Bravo, N. Serichol: ApJSS 115, 119 (1998)
- (8) D. García-Senz, S.E. Woosley: ApJ 454, 895 (1995)
- (9) E. Bravo, D. García-Senz: Thermonuclear supernovae: Is deflagration triggered by floating bubbles? In: From Twilight to Highlight: The Physics of Supernovae, ed by W. Hillebrandt, B. Leibundgut (Springer, Berlin 2003) pp 165–168
- (10) P. Höflich, J. Stein: ApJ 568, 779 (2002)