Parameter properties and stellar population of the old open cluster NGC 3960††thanks: Based on observations made with the European Southern Observatory telescopes obtained from the ESO/ST-ECF Science Archive Facility.
We present a photometric and astrometric catalogue of the open cluster NGC 3960, down to limiting magnitude , obtained from observations taken with the Wide Field Imager camera at the MPG/ESO 2.2 m Telescope at La Silla. The photometry of all the stars detected in our field of view has been used to estimate a map of the strong differential reddening affecting this area. Our results indicate that, within the region where the cluster dominates, the values range from 0.21 up to 0.78, with () at the nominal cluster centroid position; color excesses up to 1 mag have been measured in the external regions of the field of view where field stars dominate. The reddening corrected color-magnitude diagram (CMD) allows us to conclude that the cluster has an age between 0.9 and 1.4 Gyr and a distance modulus of .
In order to minimize field star contamination, their number has been statistically subtracted based on the surface density map. The empirical cluster main sequence has been recovered in the vs. and in the vs. planes, using optical and infrared data, respectively. From these empirical cluster main sequences, two samples of candidate cluster members were derived in order to obtain the luminosity distributions as a function of the and magnitudes. The Luminosity Functions have been transformed into the corresponding Mass Functions; for , the two distributions have been fitted with a power law of index and in and in , respectively, while the Salpeter Mass Function in this notation has index .
Key Words.:
Open clusters - individual: NGC 3960 - photometry - astrometry - differential reddening - Luminosity and Mass Function1 Introduction
Old Galactic open clusters are stellar systems which can survive only if they have a large initial population and lie far from dense molecular clouds (van den Bergh & McClure, 1980; de La Fuente Marcos, 1997). For this reason they are less numerous than the young open clusters and are mainly found in the external region of the Galaxy, where there is a lower likelihood of catastrophic encounters.
Cluster stars have the same distance and chemical composition; for this reason stellar clusters are among the most appropriate objects to study the Initial Mass Function (IMF), that is one of the most crucial ingredients for dynamical evolution models and for galaxy formation and stellar evolution models. Comparison of the IMF of old open clusters with the IMF of nearby and young open clusters is fundamental to look for similarities or discrepancies of the star formation processes in the Galaxy disk, in different epochs and in different environments.
Accurate determination of the open cluster IMF is, however, a difficult task, because these objects are in general poorly populated and, due to their location in the thin disk, are highly contaminated by field stars seen along the same line of sight. In the case of old open clusters, these difficulties are increased, as they are very distant from the Sun and thus often strongly obscured due to interstellar absorption. High-quality photometry and precise extinction determinations are crucial to obtain a correct estimate of the IMF.
With an age of about 1.2 Gyr and a small spatial concentration, NGC 3960 is an interesting example of an old open cluster suitable for IMF studies. It is a low-latitude cluster, located at the celestial and Galactic coordinates RA=11h50m54s and Dec=55∘42′(J2000) and 294∘.42 and +6∘.17, respectively, about 1850 pc from the Sun.
Physical parameters of NGC 3960 were estimated by Janes (1981), through photoelectric BV and intermediate-band David Dunlop Observatory (DDO) photometry. One blue and one visual photographs were obtained in order to extend the magnitude sequences to fainter limits. From the BV photometry, the author concludes that the cluster is yr old, while from the DDO photometry for several cluster giants and using the Janes (1977) method, he derives the reddening . A distance modulus and metallicity [Fe/H]= have also been estimated by the same author. [Fe/H]= was subsequently derived by Friel & Janes (1993) from a spectroscopic study of 7 giant stars of NGC 3960.
Because of its low-latitude position, in the direction of the Carina spiral feature (Miller, 1972), effects of differential reddening are expected across the region of the sky including the cluster members. Feitzinger & Stuewe (1984) and Hartley et al. (1986) indicate the presence in their catalogues of two dark nebulae falling in the field of NGC 3960. More recently, Dutra & Bica (2002) gave values and for these two overlapping dark nebulae, respectively, derived from a 100 m dust thermal emission map. These regions are located about 13 arcmin from the cluster center, where the value is about 0.29 (Janes, 1981). This non negligible difference in the value, therefore, suggests the existence of variable extinction across the field of NGC 3960.
In this work, using a procedure similar to that used by Piotto et al. (1999) and von Braun & Mateo (2001), we attempt to construct an extinction map of our field of view, in order to correct the photometric catalogue of candidate cluster members for differential reddening effects.
In Section 2, we describe the observations and the data reduction procedure used to obtain the photometric/astrometric catalogue; in Section 3 we present the CMD and the method used to obtain the extinction map and the reddening corrected catalogue. In Section 4 we describe the method adopted to derive the cluster parameters, while in Section 5 we describe the statistical procedure used to recover the empirical cluster main sequence from optical and infrared data and the photometric selection of candidate cluster members. In Section 6, we present the Luminosity Functions obtained from optical and infrared data and the corresponding Mass Functions. Finally, we summarize and discuss our results in Section 7.
2 Cluster BVI Photometry and Astrometry
2.1 Observations and Data Reduction
NGC 3960 is an open cluster observed in the Pre-FLAMES Survey (PFS), carried out as part of the ESO Imaging Survey (EIS), aimed to provide BVI imaging data for use in connection with FLAMES, a multi-fiber spectrograph instrument on the ESO VLT UT2 (KUEYEN) Telescope. The observations for this survey were collected using the Wide Field Imager (WFI) camera mounted at the Cassegrain focus of the MPG/ESO 2.2 m Telescope at La Silla (Chile). This instrument consists of a mosaic of kk CCD detectors with narrow inter-chip gaps of width 23′′.8 and 14′′.3 along right ascension and declination, respectively, yielding a filling factor of 95.9%. With a pixel size of 0.238′′, each chip covers a field of view of 8′.12 16′.25, while the full field of view is 34′ 33′.
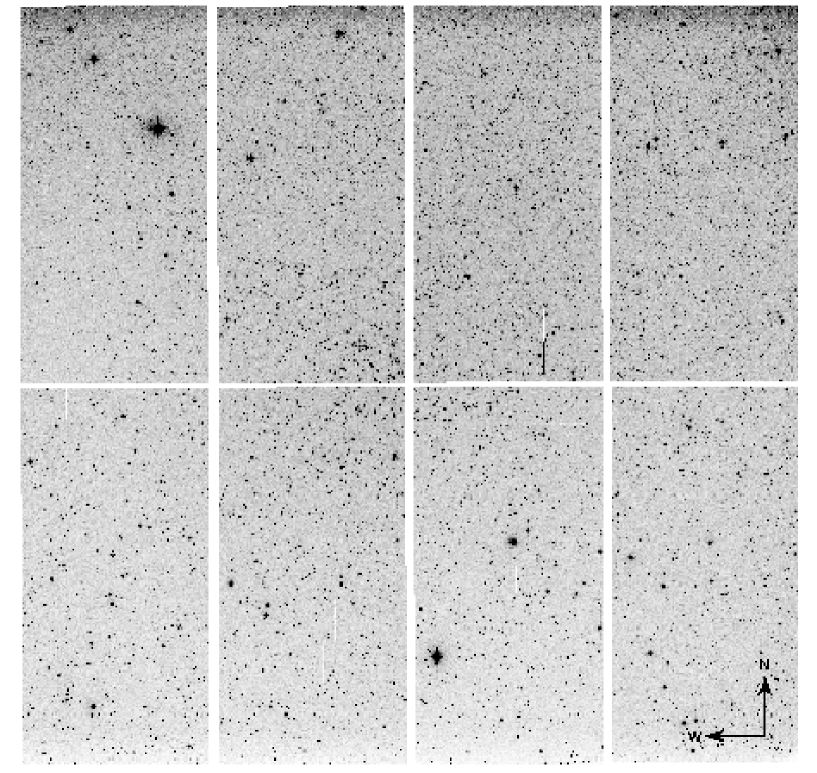
According to the PFS observing strategy, the images were obtained in the BVI pass-bands; for each filter, one short exposure of 30 seconds, useful to avoid saturating bright objects, and two deep exposures, of 4 minutes each, have been taken. In order to cover the inter-chip gaps, these observations were dithered by 30′′ both in right ascension and declination. Table 1 gives the log-book of the observations and Figure 1 shows a deep image of our field of view in the band. The cluster is approximately located in the central part of the field of view where it is barely visible within a radius of about 7 arcmin. Strong effects of differential reddening cause a non-uniform spatial distribution of the field stars in the external regions of the field of view. In addition to the science target exposures, a set of technical frames for the instrumental calibration were obtained during the same night.
| Target | RA (J2000) | Dec (J2000) | Night | Filter | Exp. Time | seeing |
|---|---|---|---|---|---|---|
| EIS name | (h m s) | (d m s) | [s] | FWHM[′′] | ||
| NGC 3960 | 11 50 55.0 | 55 41 36 | 24–25 Feb 2000 | B | 0.99–1.21 | |
| (OC21) | V | 0.86–1.38 | ||||
| I | 0.81–1.19 |
To complement the optical data, we have utilized infrared (IR) photometry from the All-Sky Point Source Catalogue of the Two Micron All Sky Survey (2MASS)111a joint project of the University of Massachusetts and the Infrared Processing and Analysis Center/California Institute of Technology, funded by the National Aeronautics and Space Administration and the National Science Foundation (Carpenter, 2001) available on the WEB222http://irsa.ipac.caltech.edu/.
The instrumental calibration of the WFI CCD images has been performed using the mscred package, a mosaic specific task implemented as an IRAF package for the NOAO Mosaic Data Handling System (MDHS).
The first stage of the data reduction process has been the removal of the instrumental signatures from each raw CCD image. First of all, we have subtracted the electronic bias using the overscan region that has been subsequently removed. Exposure bias patterns have been subtracted using a zero calibration mosaic obtained as the median of two bias frames. Finally, flat fielding for each filter has been performed using a set of dome flat fields combined into a median master flat. Due to some saturated points, we could not use the sky flat fields.
Images in the band have required a special treatment because of the strong effects of fringing. In order to remove this instrumental artifact we have subtracted the fringing pattern provided by the MPG/ESO 2.2 m Telescope team333available at http://www.ls.eso.org/lasilla/Telescopes/2p2T/E2p2M/WFI, scaling it to each exposures.
Instrumental magnitudes were obtained for each chip of each mosaic image by using the DAOPHOT II/ALLSTAR (Stetson, 1987) and ALLFRAME (Stetson, 1994) photometric routines. The point-spread functions (PSFs), determined for each chip and filter, take into account the variation in the PSF across the field of view of each WFI chip.
In order to obtain the aperture correction to the profile-fitting photometry, growth curves were determined. First, we have selected the stars used to define the PSF model; next, all other objects were removed from the frames and aperture photometry was carried out at a variety of radii. DAOGROW (Stetson, 1990) was used to derive growth curves and COLLECT to calculate the ”aperture correction” coefficient for each chip from the difference between PSF and aperture magnitudes of the selected stars.
Calibration to the Johnson-Cousin photometric system was performed by means of a set of Landolt (1992) standard fields (SA98, SA104, PG0918 and Ru 152), observed during the same night through the 8 chips.
In order to derive the transformation coefficients to the standard system we have used equations of the form:
| (1) | |||||
where , and are the standard star instrumental magnitudes, corrected to the exposure time of 1 s; is the airmass and , and are the magnitudes in the standard system. We first attempted to derive all the coefficients (the zero points, the extinction and the color terms) for each chip, but by analyzing the photometric residuals as a function of the time through the night, we noticed that when the PG0918 standard field was observed, the night was not photometric, as the mean residuals systematically change with time. Since the problem does not affect the other science observations, we have discarded all the observations of the PG0918 field and we have only used the Landolt fields SA98, SA104 and Rubin 152. In order to improve the photometric calibration, the number of the standard stars in each of these fields has been increased using secondary standards defined in Stetson (2000). Unfortunately, neither the Landolt’s nor the Stetson’s catalogue cover the chips 4 and 5 of our field with a sufficient number of standards to determine independent coefficients for these chips. Neighboring chips have been used to calibrate science observations in these chips, as described at the end of this section. Imposing mean extinction coefficients (Stetson, private communication), a zero point and a color term were determined separately for the chips where a sufficient number of standard observations were available. We have found that the color terms computed for the chips 2, 3, 6 and 7 are consistent with each other, with variations in , in and in ; for the chips 1 and 8 we have found different values because they have been computed on a smaller number of standard stars (see Table 2). Considering the homogeneous characteristics of the instrument, we have chosen to compute new zero points fixing the color term to the median value of the color terms of the chips for which the number of measured standard stars was sufficiently large. The resulting coefficients are given in Table 2 together with the corresponding average standard errors. Points above the level were not considered for the calibration. We note that the variations among the photometric zero points of different chips (Table 2), are in , in and in I, in agreement with the results found in Zoccali et al. (2003).
| Filter | Chip | N. stars. | Zero Point | Color Term | Extinction | Av. St. Error |
|---|---|---|---|---|---|---|
| 1 | 24 | -0.097 | 0.14 | 0.034 | ||
| 2 | 306 | -0.097 | 0.14 | 0.031 | ||
| 3 | 136 | -0.097 | 0.14 | 0.030 | ||
| 4 | 4 | -0.097 | 0.14 | |||
| 5 | 0 | -0.097 | 0.14 | |||
| 6 | 51 | -0.097 | 0.14 | 0.033 | ||
| 7 | 67 | -0.097 | 0.14 | 0.022 | ||
| 8 | 11 | -0.097 | 0.14 | 0.024 | ||
| 1 | 25 | 0.249 | 0.25 | 0.053 | ||
| 2 | 328 | 0.249 | 0.25 | 0.038 | ||
| 3 | 148 | 0.249 | 0.25 | 0.028 | ||
| 4 | 4 | 0.249 | 0.25 | |||
| 5 | 0 | 0.249 | 0.25 | |||
| 6 | 49 | 0.249 | 0.25 | 0.054 | ||
| 7 | 56 | 0.249 | 0.25 | 0.030 | ||
| 8 | 11 | 0.249 | 0.25 | 0.062 | ||
| 1 | 22 | 0.130 | 0.09 | 0.056 | ||
| 2 | 248 | 0.130 | 0.09 | 0.035 | ||
| 3 | 123 | 0.130 | 0.09 | 0.038 | ||
| 4 | 6 | 0.130 | 0.09 | |||
| 5 | 0 | 0.130 | 0.09 | |||
| 6 | 42 | 0.130 | 0.09 | 0.047 | ||
| 7 | 47 | 0.130 | 0.09 | 0.033 | ||
| 8 | 13 | 0.130 | 0.09 | 0.026 |
As already mentioned, the NGC 3960 field observations were dithered both in right ascension and declination to cover the inter-chip gaps. This means that contiguous chips have several stars in common. We have compared the magnitudes of these stars to verify consistency of our photometry among different chips. The mean value and the root mean square of the residuals for the stars with are given in Table. 3.
| Chips | rms | rms | rms | |||
|---|---|---|---|---|---|---|
| 1-2 | 0.051 | 0.023 | 0.043 | 0.025 | 0.054 | 0.047 |
| 1-8 | -0.006 | 0.027 | 0.033 | 0.072 | 0.009 | 0.020 |
| 2-3 | 0.005 | 0.036 | 0.004 | 0.055 | -0.018 | 0.031 |
| 2-7 | 0.021 | 0.070 | 0.043 | 0.049 | 0.014 | 0.051 |
| 3-6 | 0.046 | 0.021 | 0.035 | 0.036 | 0.034 | 0.017 |
| 6-7 | -0.032 | 0.029 | -0.071 | 0.055 | -0.023 | 0.026 |
| 7-8 | -0.065 | 0.039 | -0.015 | 0.043 | -0.043 | 0.027 |
Finally, the photometric zero points of the chips 3 and 6 have been used to calibrate the stars in the chips 4 and 5, respectively. Corrections , and mag to these photometric zero points have been found, for the magnitudes , and , respectively, using the photometric comparison of the common stars in the overlapping regions.
Completeness of our star list and accuracy of our photometry for each chip have been determined by tests with artificial stars; a total of about 1350 stars have been added as described in Prisinzano et al. (2003). Our data are complete above and more than complete above , and . The data for the recovered artificial stars of each chip have been sorted by the observed magnitude and divided into 14 group of about 80 stars. For each group, the median observed magnitude and the external errors have been computed as in Stetson & Harris (1988). In Table 4, we report the estimated errors for . The values for are less than 0.001 mag.
| Chip | Chip | ||||||||
|---|---|---|---|---|---|---|---|---|---|
| 1 | 16.721 | 0.003 | 0.005 | 0.004 | 5 | 16.873 | 0.003 | 0.006 | 0.003 |
| 1 | 17.617 | 0.006 | 0.009 | 0.007 | 5 | 18.024 | 0.007 | 0.013 | 0.007 |
| 1 | 18.663 | 0.010 | 0.021 | 0.013 | 5 | 19.128 | 0.016 | 0.037 | 0.018 |
| 1 | 19.746 | 0.027 | 0.047 | 0.032 | 5 | 20.111 | 0.033 | 0.062 | 0.043 |
| 1 | 20.878 | 0.065 | 0.150 | 0.083 | 5 | 21.456 | 0.113 | 0.213 | 0.105 |
| 2 | 16.738 | 0.003 | 0.006 | 0.004 | 6 | 16.911 | 0.003 | 0.006 | 0.004 |
| 2 | 17.916 | 0.006 | 0.009 | 0.004 | 6 | 18.049 | 0.006 | 0.013 | 0.006 |
| 2 | 18.856 | 0.015 | 0.021 | 0.010 | 6 | 19.051 | 0.015 | 0.034 | 0.018 |
| 2 | 19.989 | 0.028 | 0.062 | 0.027 | 6 | 20.079 | 0.040 | 0.085 | 0.043 |
| 2 | 21.185 | 0.094 | 0.188 | 0.093 | 6 | 21.459 | 0.110 | 0.254 | 0.116 |
| 3 | 16.755 | 0.003 | 0.006 | 0.003 | 7 | 16.995 | 0.003 | 0.007 | 0.003 |
| 3 | 18.064 | 0.007 | 0.015 | 0.009 | 7 | 18.084 | 0.009 | 0.018 | 0.010 |
| 3 | 19.313 | 0.019 | 0.033 | 0.019 | 7 | 19.144 | 0.016 | 0.037 | 0.013 |
| 3 | 20.321 | 0.034 | 0.086 | 0.032 | 7 | 20.155 | 0.035 | 0.070 | 0.039 |
| 3 | 21.318 | 0.093 | 0.227 | 0.126 | 7 | 21.441 | 0.120 | 0.246 | 0.095 |
| 4 | 16.980 | 0.003 | 0.004 | 0.003 | 8 | 16.804 | 0.003 | 0.005 | 0.003 |
| 4 | 17.910 | 0.006 | 0.013 | 0.007 | 8 | 17.897 | 0.007 | 0.013 | 0.007 |
| 4 | 18.942 | 0.016 | 0.034 | 0.012 | 8 | 18.983 | 0.013 | 0.036 | 0.013 |
| 4 | 19.987 | 0.031 | 0.087 | 0.033 | 8 | 20.088 | 0.033 | 0.072 | 0.038 |
| 4 | 21.277 | 0.074 | 0.231 | 0.065 | 8 | 21.283 | 0.095 | 0.170 | 0.081 |
2.2 Astrometry
In order to determine the astrometric solution we have considered as reference catalogue the Guide Star Catalogue, Version 2.2.01 (GSC 2.2 STScI, 2001). We have used the Aladin Sky Atlas to plot this catalogue on the finding chart of the open cluster NGC 3960 field. For each chip we have chosen three stars for which we have both the celestial coordinates of the GSC 2.2 catalogue and the pixel coordinates. We have used these stars as reference for the IRAF task ccxymatch; imposing a matching tolerance of 0′′.3, we have matched a total of 4224 stars. The IRAF task ccmap has been used to fit a transformation between pixel coordinates and celestial coordinates after applying a clipping to the data. In our case, a tangent plate projection with distortion polynomials has been chosen for the sky projection geometry. The scatter plot and the distributions of the RA and Dec residuals of the transformation are shown in Figure 2 for the chips 2 and 3 where the cluster is mainly concentrated. We note that the residual distribution is highly concentrated with a Gaussian shape in both directions. The mean offsets and the rms of the distributions, given on each panel, show that the final accuracy is always better than 0′′.2.


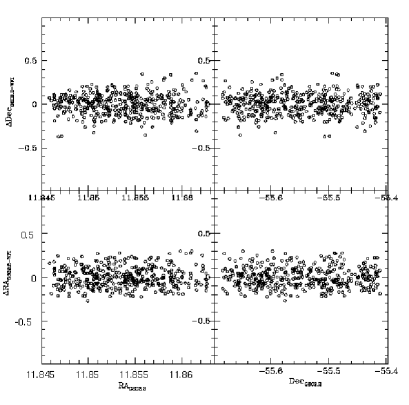
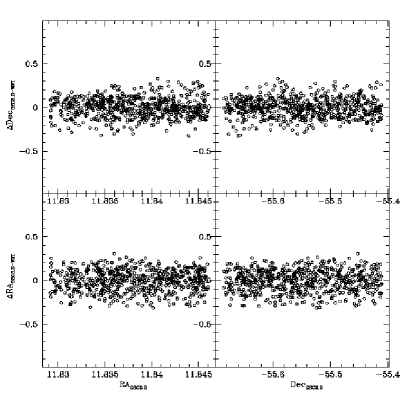
In order to investigate eventual systematic dependence from the position, we have plotted the RA and Dec residuals as a function of RA and Dec. The results for the chips 2 and 3 are shown in Figure 3 where no noticeable systematic effects are evident. Similar results have been found for the other chips.
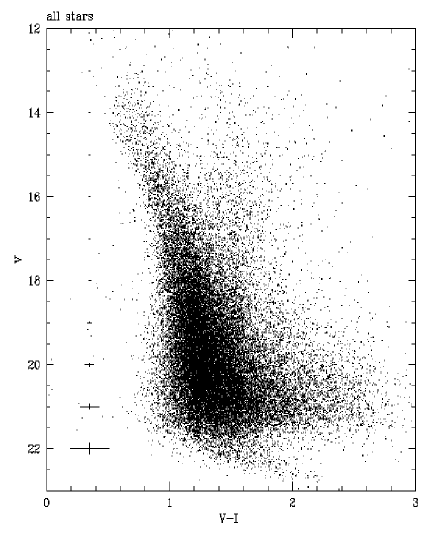
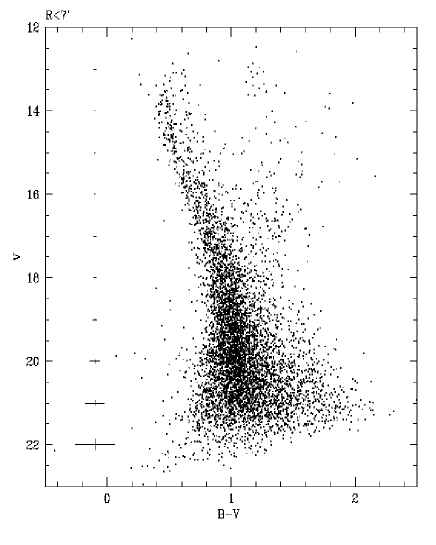
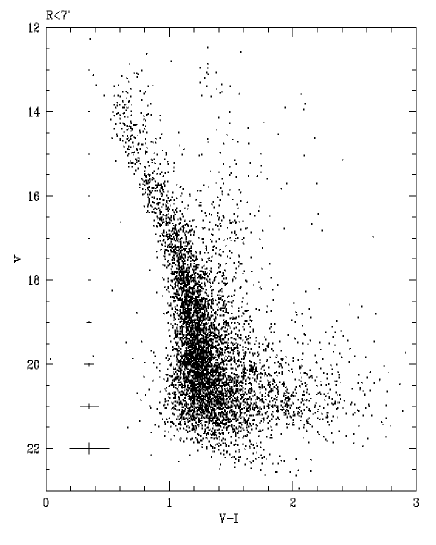
3 The Color-Magnitude Diagrams
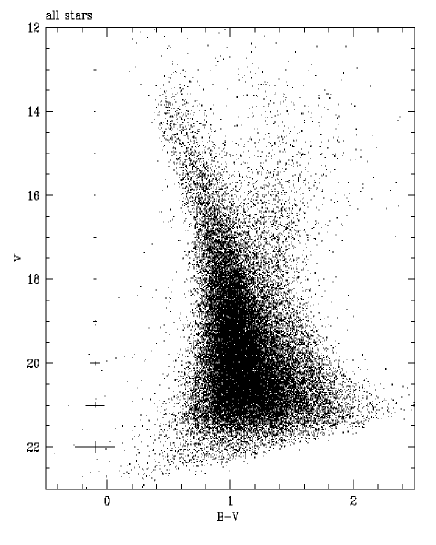
The color-magnitude diagrams of all the stars measured in our field of view have been obtained using all sources with SHARP parameter (Stetson, 1987) between 0.8 and 0.8. This selection allows us to reject non-stellar objects such as semi-resolved galaxies or blended double stars or cosmic rays. The vs. and the vs. color-magnitude diagrams of the 39 411 selected stars are shown in Figure 4 (top panels). Due to the Galactic position of the cluster, the diagrams are highly contaminated by foreground and background stars making it difficult to discriminate the cluster main sequence. To facilitate the interpretation of the color-magnitude diagrams, we have considered the distribution of the stars as a function of distance from the cluster center. For this we have first calculated the cluster centroid RA.8 and Dec∘40′37′′.4 (J2000), as the median value of the celestial positions of stars brighter than V=15.5. Therefore we have performed stars counts by using our data to obtain a first order approximation of the cluster size. We have derived the surface stellar density by performing star counts in concentric rings around the cluster centroid and then dividing them by their respective areas. Figure 5 shows the resulting density profile and the corresponding Poisson errors bars. We note a flattening of the profile outside 7 arcmin. This density variation suggests that most of the cluster members are located within 7 arcmin, whereas outside the Galactic disk population is dominant. However, we consider this radius only an approximate value where the cluster dominates the field. In fact, as expected from dynamical evolution and mass segregation effects, faint cluster stars can be located out of this radius. We note, however, that our cluster size estimate is significantly greater than the value 2.75 arcmin given for the radius of this cluster by Janes (1981), where only stars brighter than were considered. From here on we refer to the above mentioned region inside the circle of 7 arcmin as the ”cluster region” and to the remaining part of our field of view as the ”field region”.
The color-magnitude diagrams obtained using all the stars within the cluster region are shown in Figure 4 (bottom panels). Both the diagrams exhibit the cluster main sequence down to but the faint star main sequence is still hidden by contaminating stars. The Turn Off (TO) point is roughly located at , while the group of bright stars in the red part of the CMD are clearly Red Giant Branch (RGB) stars of NGC 3960.

3.1 The Differential Reddening Map
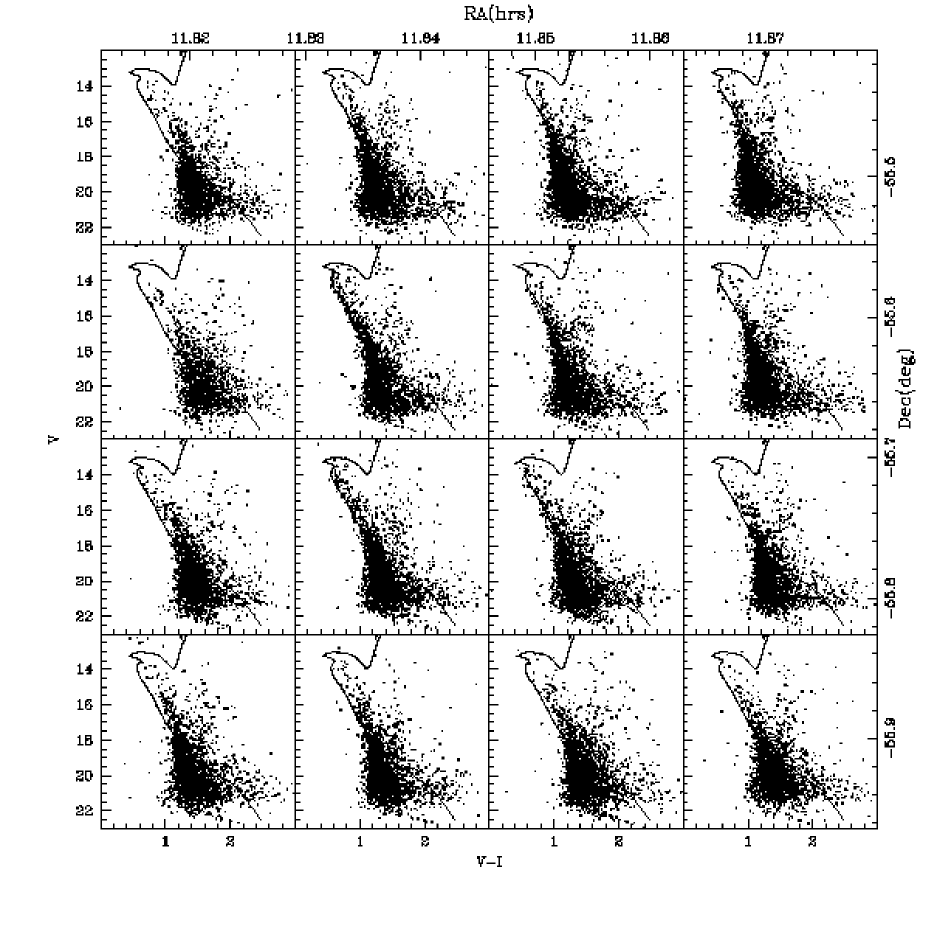
The cluster main sequence in Figure 4 appears rather broad in both diagrams, with higher dispersion in the vs. CMD (lower-right panel). Artificial-star tests indicate that our typical photometric errors for are and ; therefore, after ruling out instrumental causes and/or photometric errors as possible origin for this effect, we have investigated a possible dependence of such broadening from the positions of the stars in our field of view. In Fig 6 we show the vs color-magnitude diagrams of 16 subregions of about 8′.68′.3 in the NGC 3960 field. Celestial coordinates corresponding to each subregion are given on the top and right axes, respectively. The solid line on the color-magnitude diagrams is the isochrone of 1.1 Gyr, metallicity computed by the Pietrinferni et al. (2003) (see Section 4).
We note that the cluster main sequence is dominant in the central regions, while the number of stars in the upper main sequence decreases in the external regions. Nevertheless, a different appearance of the main sequence as a function of the position is clearly evident as regards the theoretical model. This effect could be due to the fact that the star cluster is present only in one small well defined region; such a difference is however also evident looking at the blue edge of the field population, roughly located from 0.8 to 1.2 in . We note that this shift does not depend from the chip to chip photometric zero point offsets because it is present in different CMDs of stars falling in the same chip; in addition differences in these CMD are not consistent with photometric zero point residuals of adjacent chips found in Section 2.1. Thus, we conclude that the dependence of the appearance on the spatial positions of the stars is real and can be due to differential reddening.
This conclusion is consistent with several previous studies indicating the presence of dust clouds in the NGC 3960 field. For instance, a region of 0.116 square degrees, located at the RA=11h49m10s, Dec=55∘31′40′′(J2000) and (294∘.15, 6∘.28), and falling in the north-west part of our field of view, has been included in a catalogue of dark nebulae compiled by Feitzinger & Stuewe (1984). In this study, many fields of the ESO/SRC southern sky survey were examined looking for regions of the sky where the apparent surface density is reduced compared to the surrounding regions. The dark nebula falling in our field of view was classified as a cloud with some structure and relatively well defined edges. Another dark cloud, falling also in the north-west part of our field of view, was identified by Hartley et al. (1986) using the ESO/SERC Southern survey. The catalogue obtained in this work includes a dark nebula of minimum density of size 5′3′ centered on RA=11h49m03s and Dec=-55∘40′22′′(J2000) (294∘.16, 6∘.13). The distances of these dark clouds are not known.
More recently, a value for the reddening of these regions was given in the unified catalogue of dust clouds by Dutra & Bica (2002). The reddening values were extracted from the all-sky reddening map of Schlegel et al. (1998), based on a 100 m dust thermal emission map with resolution of ′. For each region, the authors compare the reddening in the nebula direction () with the background reddening () computed from the average of the measured values in four background surrounding positions, used as reference. In our field they found and , for the first dark nebula and and , for the second one. These values are significantly different from the cluster reddening value estimated by Janes (1981) as the average of reddening measurements ranging from and obtained for 6 giants in NGC 3960. Such reddening estimates indicate that strong gradients of interstellar absorption are present in our field, confirming our conclusion on the presence of differential reddening deduced by looking at the color-magnitude diagrams.
In order to quantify such effects on the color-magnitude diagrams we have created two reddening maps, one for the stars located at the cluster distance, using the cluster main sequence, and a reddening map for the field star population, affected by a further reddening spread due to distance. Both maps are used to apply an average correction for differential reddening to the photometric data.
As in Piotto et al. (1999), the main sequence reddening map has been calculated as follows: we divided our field in 20 20 subregions of about 1′.71′.7 where we have obtained the CMDs. Such subregion size is a good compromise to have a sufficient number of stars to identify the cluster main sequence, at least within 7 arcmin from the cluster centroid, and high spatial resolution to map the differential reddening. We have selected as fiducial region the subregion with coordinates RA =[.3, .6] and Dec =[-55∘41′13′′.2, ∘38′50′′.6] (J2000) where the cluster main sequence is well defined and where our estimated cluster centroid is located; we have fitted with a spline the points of the CMD where the star density is larger, defining the cluster main sequence; for each star with and , we have calculated the distance from the fitted sequence along the reddening vector defined by the relation , where (Munari & Carraro, 1996). The relative reddening has been calculated as the median value of the component of these distances.
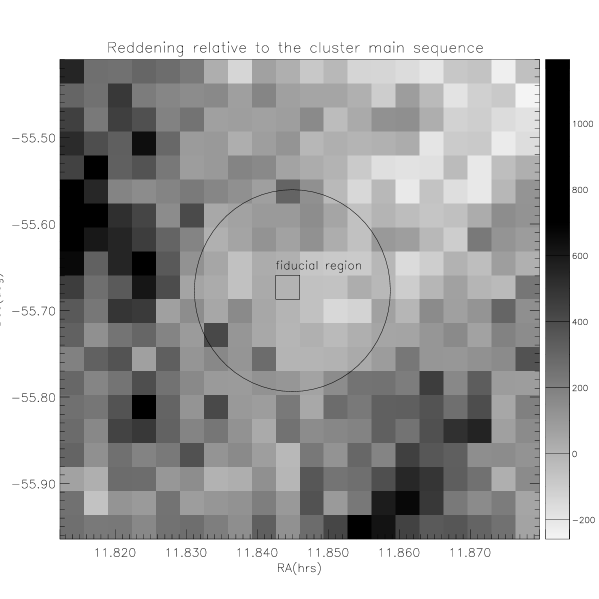
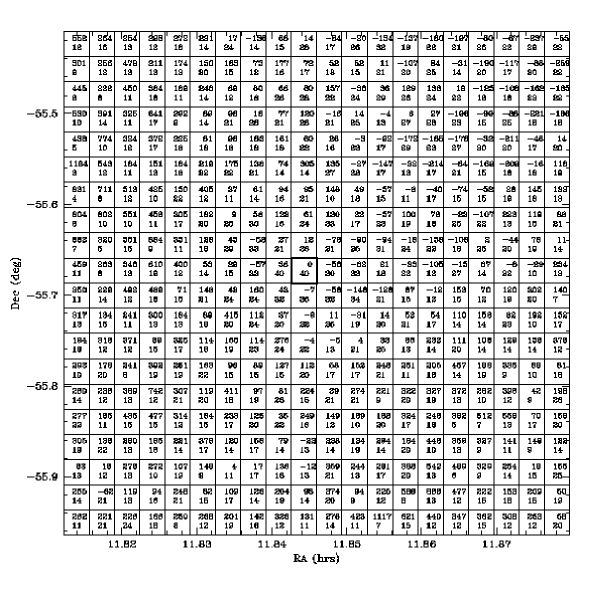
As in von Braun & Mateo (2001), we have obtained the reddening map at the cluster distance shown in Figure 7, where the darker regions correspond to the higher relative reddening; for reference, the position of the fiducial region and the cluster region are also indicated by the small box and the circle, respectively. The reddening values in milli-magnitudes, relative to the fiducial sequence and corresponding to each subregion, are the top number in each pixel of the grid shown in Figure 8. The bottom number in each pixel is the number of stars used to determine the relative reddening in that pixel. The thicker box indicates the position of the fiducial region. We note that higher reddening regions correspond to lower star numbers with respect to the average star number in the surrounding regions. Nevertheless, we are aware that the relative reddening values are significant for the central regions, where the cluster population is dominant, but are not significant for the external regions of our field of view where the stellar population is dominated by field stars; in fact, these stars lay at different distances and the fiducial main sequence used to determine the reddening is not representative in these regions.
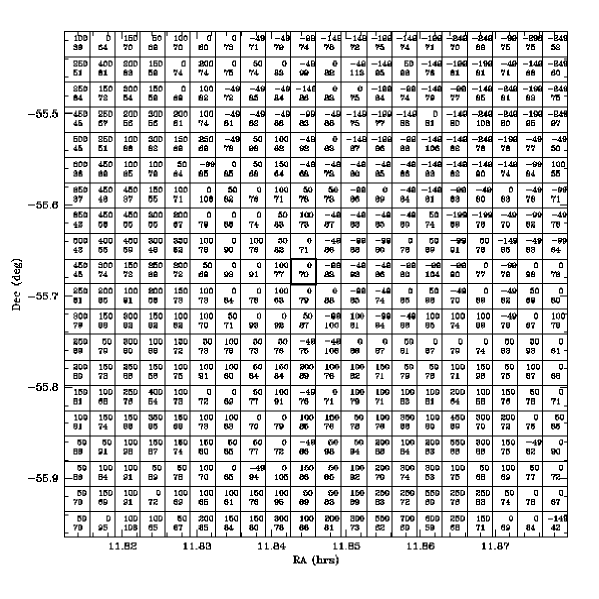
In order to estimate the differential reddening affecting the field stars, we have calculated the separation of each star with and , from the blue edge of the CMD in the fiducial region (von Hippel et al., 2002). The relative reddening affecting these stars has been estimated as the mode of the distribution. We note that we are approximating the relative reddening to a single value for all the field stars, although we are aware that the relative reddening is almost certainly spread out in distance. Using a single reddening value for each subregion is an approximation, since clearly we cannot determine the reddening for each star. However, our value can be used to determine an average contamination of cluster candidates, as will be discussed in Section 5.1. The obtained results are shown in Figure 9, where the fiducial region position is also indicated; the corresponding values in milli-magnitudes and the number of the stars used to determine the relative reddening are reported in Figure 10, where the position of the fiducial region is marked by a thicker box. In Figure 9, the small circle and the circular line indicate the position of the dark nebulae included in the Hartley et al. (1986) and Feitzinger & Stuewe (1984) catalogues.
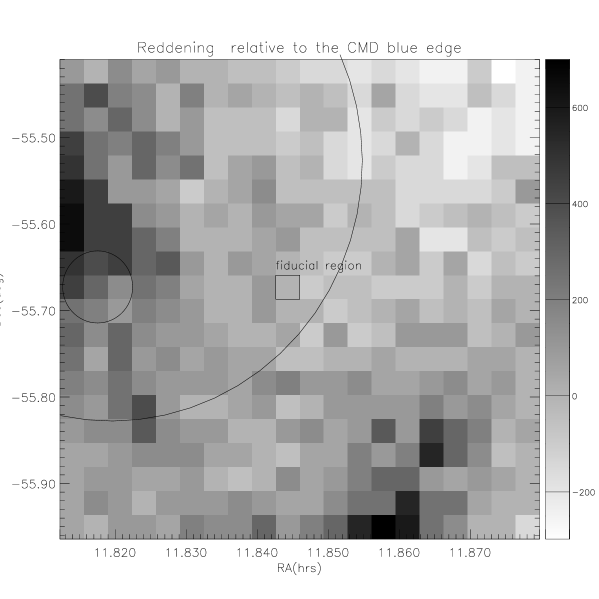
As already mentioned, Dutra & Bica (2002) estimated in the region corresponding to the small circle. On the other hand, in this region we have measured a shift of with respect to the CMD blue edge in the fiducial region. Using the relation given in Munari & Carraro (1996), this shift corresponds to . By subtracting this value to the reddening estimated by Dutra & Bica (2002), we find, in our fiducial region, , that is consistent with the average value given by Janes (1981) for the central region of the cluster. This external test shows that our differential reddening estimate is consistent with previous reddening estimates.
We note that the two reddening maps are qualitatively consistent with each other, both showing the two regions with highest reddening, located in the north-west and in the south-east part of the field, and the lowest reddening region, located in the north-east part of the field. In the cluster region the median of the differences between the reddening values derived from the two methods is mag with a standard deviation of 0.25 mag. We have used the reddening values relative to the cluster main sequence (Figure 8) to correct magnitude and color measurements of the stars within the cluster region, where we expect most of the cluster members to be located, and the reddening values relative to the blue edge of the CMD to correct magnitudes and colors of the stars in the field region, where the stellar population is dominated by field stars. We find that, within the cluster region, the values range from 0.21 up to 0.78, assuming that ( (Janes, 1981)) in the fiducial region; corrections in up to 1 mag have been, instead, applied for the most reddened field stars.
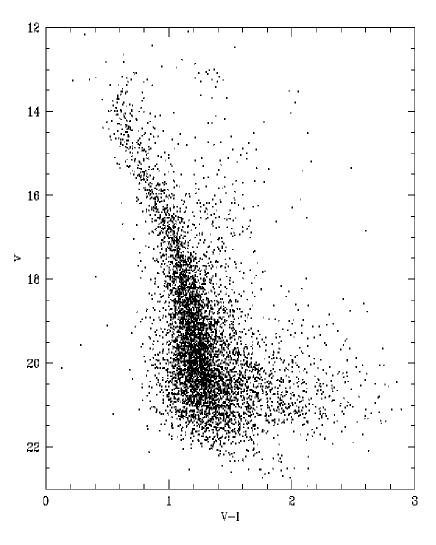
The reddening corrected vs. CMD in the cluster region is shown in Figure 11 (left panel). We note that the main sequence is better defined with respect to the uncorrected CMD shown in the lower-right panel of Figure 4. The Turn Off and the RGB stars, which were spread out in Figure 4, are now well traced. Of course, our procedure computes an average correction on each pixel of our map and a residual spread in the CMD remains.
4 Cluster Fundamental Parameters
Our photometric data together with very recent stellar models allow us to determine the cluster parameters, previously estimated by Janes (1981) from a sample of only 318 stars with .
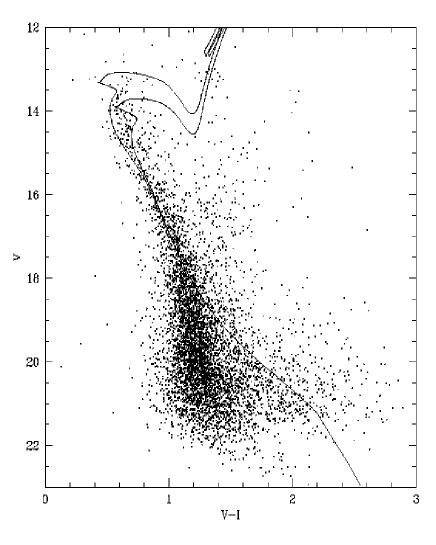
In order to find the age and the distance of the cluster, we have considered a set of different age theoretical isochrones recently calculated by Pietrinferni et al. (2003), with metallicity , as spectroscopically determined by Friel & Janes (1993). By fixing the reddening value , derived by Janes (1981), we have vertically shifted the set of reddened isochrones in the vs. CMD of the stars in the cluster region. The distance that better fit the upper part of main sequence stars () corresponds to a distance modulus of . Since we do not know the individual membership we can only constrain the age within the range of ages of isochrones limiting most of the stars close to the Turn Off. With this criterion the cluster age is between 0.9 and 1.4 Gyr.
Our results therefore suggest an age for NGC 3960 older than that given in Janes (1981) and a distance of about 1850 pc, that is slight larger than the value given by the same author (d=1660 pc). In the right panel of Figure 11 we show the vs. diagram of the stars within the cluster region where the adopted theoretical isochrones have been superimposed.
5 Empirical Cluster Locus and Photometric Selection of Candidate Cluster Members
5.1 Optical Data
As already mentioned, the reddening corrected vs. CMD computed from the stars within the cluster region is highly contaminated by field stars, as shown by the fact that only the bright cluster main sequence is clearly visible. In order to define a sample of candidate cluster members useful to study the cluster population, we need to define photometrically the complete cluster locus in the CMD. This result is usually achieved by superimposing theoretical stellar models to the observed CMD where the complete cluster main sequence is clearly visible, which is not our case. To check the agreement of theoretical isochrones, that suffer from a number of uncertainties (von Hippel et al., 2002; Grocholski & Sarajedini, 2003), with our data, we have empirically recovered the cluster main sequence using a statistical subtraction of the CMD density distribution, as described below. A similar approach has been used by von Hippel et al. (2002).
We have used the field region to perform a statistical subtraction of the contaminating field stars in the CMD derived in the cluster region. The result of this subtraction defines the locus of the cluster main sequence (Chen et al., 1998; von Hippel et al., 2002; Baume et al., 2003).
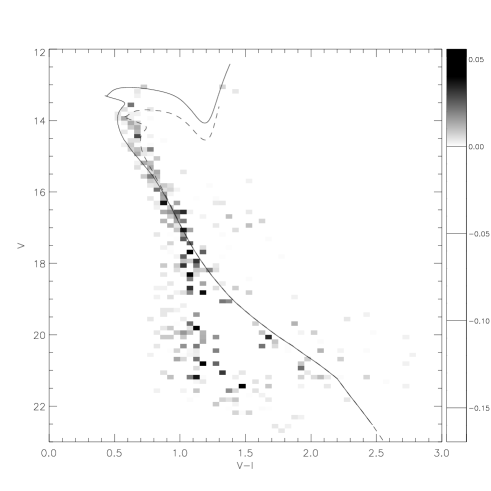
Using our reddening corrected photometric data, we have defined a ”clean field region” by selecting from the ”field region” all those subregions in Figure 10 whose relative reddening correction was between and , corresponding to the range of reddening, estimated for the field stars within the ”cluster region”. We have chosen these limits in order to consider only field stars affected by an absorption similar to that of the cluster stars. For both the cluster and the field regions, we have constructed a grid of boxes of and on the vs. plane. Thus, we have built a greyscale CMD density map of the cluster by subtracting the unreddened CMD density map of the field stars, from the unreddened CMD density map computed for the ”cluster region”. Figure 12 shows the resulting map where only the boxes showing a excess are shown. This excess should follow the cluster main sequence. The cluster main sequence is clearly present down to , while the subtraction is noisier for , the region of the cluster main sequence more strongly contaminated by field stars, where the main sequence exhibits a lower star density; as we have already mentioned, our relative reddening correction suffers from the uncertainty due to the spread of the reddening of individual stars, which prevents us from obtaining an accurate field star CMD estimate. This explains the lower star density in the low mass cluster main sequence and the noise of the bluer field stars. However, in this subtraction the faint cluster population () is well separated by the field star population this allowing us to have a well defined empirical locus of the cluster main sequence.
In Figure 12, the 0.9 and 1.4 Gyr isochrones (Pietrinferni et al., 2003) have been superimposed onto the CMD density map using the cluster parameters found in Section 4. The good agreement between the empirically recovered cluster main sequence locus and the adopted theoretical model down to at least , confirm both that the parameters determined in Section 4 are suitable to the cluster and that the adopted theoretical models reproduce the cluster main sequence over the mass range for which the IMF will be fitted.
We have used both the empirical cluster locus and the mentioned theoretical isochrones to define a photometric cluster member sample. To this aim, we have defined a strip in the observed CMD; the lower and upper limits take into account the spread of the reddening determined above. Furthermore, the upper limit of our strip is displaced upward by 0.75 mag in order to include binary stars. We have defined as candidate cluster members a total of 2119 stars lying in the cluster region that, within their photometric errors, belong to this strip. The photometric/astrometric catalogue of these candidate cluster members is given in Table 5444available in the electronic form at the CDS via anonymous ftp to cdsarc.u-strasbg.fr (130.79.128.5) or via http://cdsweb.u-strasbg.fr/cgi-bin, where we report RA and Dec (J2000) coordinates in decimal degrees, an identification number for each star, the , , magnitudes and their uncertainties.
5.2 IR Data
As already stressed in the previous Sections, our field of view is strongly affected by differential reddening, thus making uncertain the field star CMD estimate and the study of the cluster population. To have an external check of our results, we have used near-infrared data from 2MASS survey of the same field of view (Carpenter, 2001), since IR bands are not as much sensitive to reddening effects as optical bands. To have a sample as reliable as possible, only stars detected in all the bands, with magnitudes measured from point spread-function fitting or aperture photometry have been selected from the 2MASS catalogue.
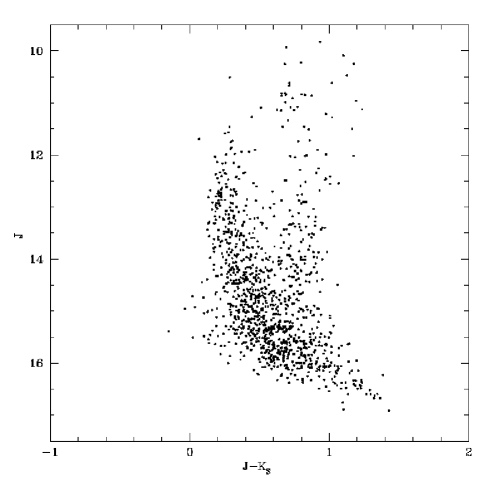
The first step has been to construct IR CMDs of the stars in the cluster region. Figure 13 shows the vs. CMD of 1162 stars detected in this area; we can see that the cluster main sequence is revealed from higher star density sequence down to , although it remains rather broad probably due to a large scatter in the colors of the low Signal-to Noise ratio sources.
In this diagram, the clump of stars at and are certainly Red Giant Branch stars of NGC 3960, while the lower density stars in the almost vertical sequence are mainly giant field stars.
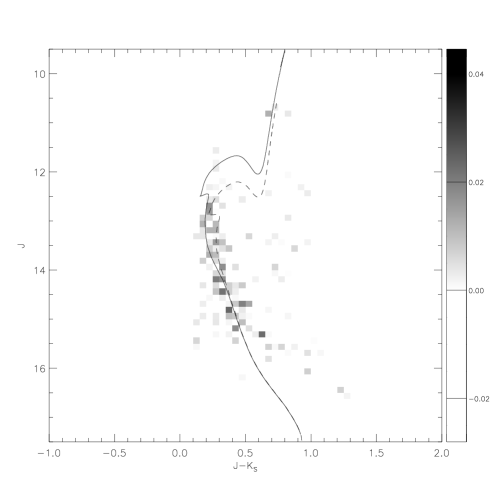
As already done with optical data, we have built the greyscale density map of the cluster with IR data by subtracting the field CMD density map from the vs. CMD density map computed for the ”cluster region”. In order to estimate an optical-independent field star distribution, we have defined as ”field region” the farther annulus area with radius between 30’ and 45’ from the cluster centroid. Figure 14 shows the IR resulting map where only the boxes having a excess are shown. We note as the cluster main sequence is well defined at least down to , that is the 2MASS completeness and reliability magnitude limit. In order to verify the cluster parameters, we have superimposed in Figure 14 the 0.9 and 1.4 Gyr isochrones of Pietrinferni et al. (2003), adopted also in the optical case, using the parameters that we have determined in Section 4 and the reddening law derived by Cardelli et al. (1989). We again find a good agreement between theoretical models and observational data down to , while for fainter stars, the model do not reproduce the empirical cluster main sequence; this can be due both to the strong uncertainties affecting IR color-temperature relations (Grocholski & Sarajedini, 2003) and to the photometric errors in this magnitude range. However, the agreement of the adopted theoretical model with the bright cluster main sequence confirms again the reliability of the cluster parameters found in Section 4.
Once the empirical cluster main sequence has been recovered from the IR data, we have applied, as done with the optical data, a photometric selection of candidate cluster members. Using the adopted theoretical isochrone for the upper main sequence and a fiducial line for the lower one, we have defined a strip in the CMD, including the boxes about the main sequence with a excess; in this way we have selected a sample of 749 IR cluster candidates within the ”cluster region” and belonging, according to their photometric errors, to this strip. The photometric/astrometric catalogue of these candidate cluster members is given in Table 6 555available in electronic form at the CDS via anonymous ftp to cdsarc.u-strasbg.fr (130.79.128.5) or via http://cdsweb.u-strasbg.fr, where we report RA and Dec (J2000) coordinates in decimal degrees, an identification number for each star, the , , magnitudes and their uncertainties.
6 Luminosity and Mass Functions
One of the main objectives of this study is to derive the stellar mass function down to the limiting magnitude reached in this survey, that is .
In Section 5.1 we have found a sample of optical candidate cluster members, but such photometrically selected sample contains the contribution of foreground and background sources that has to be subtracted in order to estimate the number of stars belonging to NGC 3960. Since neither spectroscopic observations, nor proper motions are available for this cluster, we have used the following statistical approach to estimate the number of the cluster members.
First, we have computed the total distribution of the optical candidate members lying in the ”cluster region”, as a function of the magnitude; second, we have computed the distribution of the candidate members falling in the ”clean field region” defined in Section 5.1, unreddened relatively to the fiducial region; then, this field distribution has been normalized to the ”cluster region” area and then subtracted to the total one. The resulting luminosity function of the cluster is shown in the top panel of Figure 15, where the values of the absolute magnitude (), corresponding to the visual magnitudes are also indicated in the top axis. We note that for , the distribution is in some case consistent with the zero value and in one case, is even negative(!). This result is consistent with the low star density found in Figure 12 in the same magnitude range. As already mentioned, this finding is very likely due to the critical field star distribution estimate about , where the contribution of the field stars is dominant. For , the deficiency of stars is probably due to incompleteness of our catalogue that, based on the artificial star tests, is complete down to . In addition, due to dynamical evolution, a percentage of such faint cluster stars is expected to be found also outside our estimated cluster region, that is where we have estimated the field star distribution, and this makes it difficult to have a correct estimate of the cluster luminosity function in this magnitude range.

An independent IR luminosity distribution of the cluster has been obtained using the same statistical approach and the sample of IR candidate cluster members obtained in Section 5.2. As for the optical case, the contribution of field stars has been computed using the ”field region” defined in Section 5.2. The resulting J luminosity function is shown in the bottom panel of Figure 15. Also in this case, the result is reliable for , that is in the magnitude range where the 2MASS catalogue is complete. This limiting magnitude corresponds to , for a main sequence star at the cluster distance.
In order to compare these results, obtained from two independent surveys, we have transformed the and luminosity functions into the corresponding mass functions. We have used in both cases, the Mass-Luminosity Relation (MLR) computed by Pietrinferni et al. (2003). The derived mass functions are shown in Figure 16. As already stressed, the results are reliable for , where both surveys are complete. For this mass range, we have computed a linear fit to both distributions and have found that the two functions have a slope of and , for the and luminosity functions, respectively.
The agreement of the mass function obtained from the optical data with the one obtained from IR data indicates that the applied corrections for differential reddening and, therefore, the field star distribution estimate, are reliable. Nevertheless, the very large errors corresponding to the optical mass function in the range are the result of the already mentioned problems in this mass range that prevent from having a reliable estimate of the low mass function of NGC 3960.

7 Summary and Conclusions
This Chapter presents photometry and astrometry of the stars in the field of the open cluster NGC 3960, falling in the arcmin square field of the WFI camera of the MPG/ESO 2.2 m Telescope. Our survey reaches a limiting magnitude ; based on artificial star tests, it is complete down to , where the photometric accuracy is better than . Comparison of the positions of the stars in our survey with those of the GSC 2.2, used as reference catalogue, indicates that the final astrometric accuracy is 0′′.2.
The photometric data have been used to construct the vs. and the vs. CMDs, where the high contribution of the disk population allows us to identify only the cluster bright star main sequence, that appears rather broadened due to strong differential reddening. A detailed spatial study of the vs. CMD allows us to evaluate the relative reddening of 20 subregions, each of about 1′.71′.7, with respect to a fiducial region corresponding to the cluster centroid. The relative reddening has been computed from the cluster main sequence, for the stars falling in the cluster region, and using the blue edge of the CMD for the field stars, which, being at distances different from that of the cluster, are affected by different reddening. Our results indicate that, within the cluster region, the values range from 0.21 up to 0.78; corrections in up to 1 mag have been, instead, applied for the most reddened field stars.
The final reddening map traces regions of low star density, that are consistent with two areas, indicated in literature as dark nebulae, that are regions of the sky where the apparent surface density of stars is reduced compared to surrounding regions. Comparison of our reddening estimate in the smallest of these dark nebulae, with the one reported in literature, allows us to estimate a color excess of about 0.23 in the region corresponding to the cluster centroid. This value is very similar to the value 0.29 given by Janes (1981) for the cluster.
Using the reddening corrected CMD and recent stellar models, we have found that the cluster has an age between 0.9 and 1.4 Gyr, its distance modulus is and it is located about 1850 pc from the Sun.
In order to minimize the field star contamination in the CMD, a statistical subtraction of the CMD density map has been performed to empirically recover the whole cluster main sequence. Using the resulting density map, we have been able to compare the empirical cluster main sequence with the adopted theoretical models, thus allowing us to verify the reliability of our estimated cluster parameters. Furthermore, this empirical cluster main sequence has been used to identify a strip in the optical CMD where cluster stars are expected to be located; 2119 candidate cluster members fall in this strip.
In order to have an external check of our results, we have built an analogous CMD density map using IR data from the 2MASS catalogue. Taking advantage of the availability of the entire sky coverage of the 2MASS catalogue and in order to avoid the above mentioned dark nebulae, a different control region for field stars, located farther than the one used in the optical case, has been used. The obtained empirical cluster main sequence in the vs. plane has been compared to theoretical models using the cluster parameters estimated in this work. The result of this comparison shows, again, the correctness of the estimated cluster parameters. As in the optical case, the IR empirical main sequence has been used to define a strip in the vs. CMD and therefore a sample of IR candidate cluster members.
From the two samples of candidate cluster members, obtained from the optical and IR surveys, and using the respective control field, the luminosity distributions for the cluster, as a function of the and magnitudes, have been computed. Using the same MLR, the two distributions have been transformed into two independent mass function determinations of the cluster. In the mass range where the two data set are complete (), the two mass functions have been fitted to a power law having indices and in and in , respectively, while the Salpeter mass function in this notation has index . Our values are both consistent with the data presented in the vs. log plot of Kroupa (2002) for other open clusters.
The good agreement of the two distributions, furthermore, suggests both that the reddening correction of our catalogue and the estimates for the field star contamination are reliable and correct. However, the low mass range is affected both by completeness problems as well as by likely mass segregation effects preventing a reliable derivation of the cluster luminosity and mass functions for .
A future spectroscopic study of this region is planned in order to measure the radial velocities crucial to have an independent membership criterion and to determine individual reddening of each star.
Acknowledgements.
We thank S. Cassisi and A. Pietrinferni for providing their most recent models and M. Zoccali and E. Flaccomio for useful suggestions that greatly improved the presentation of this paper. This work has been partially supported by MIUR.References
- Baume et al. (2003) Baume, G., Vázquez, R. A., Carraro, G., et al. 2003, A&A, 402, 549
- Cardelli et al. (1989) Cardelli, J. A., Clayton, G. C., & Mathis, J. S. 1989, ApJ, 345, 245
- Carpenter (2001) Carpenter, J. M. 2001, AJ, 121, 2851
- Chen et al. (1998) Chen, B., Carraro, G., Torra, J., et al. 1998, A&A, 331, 916
- de La Fuente Marcos (1997) de La Fuente Marcos, R. 1997, A&A, 322, 764
- Dutra & Bica (2002) Dutra, C. M. & Bica, E. 2002, A&A, 383, 631
- Feitzinger & Stuewe (1984) Feitzinger, J. V. & Stuewe, J. A. 1984, A&AS, 58, 365
- Friel & Janes (1993) Friel, E. D. & Janes, K. A. 1993, A&A, 267, 75
- Grocholski & Sarajedini (2003) Grocholski, A. & Sarajedini, A. 2003, MNRAS, in press
- Hartley et al. (1986) Hartley, M., Tritton, S. B., Manchester, R. N., et al. 1986, A&AS, 63, 27
- Janes (1977) Janes, K. A. 1977, PASP, 89, 576
- Janes (1981) Janes, K. A. 1981, AJ, 86, 1210
- Kroupa (2002) Kroupa, P. 2002, Science, 295, 82
- Landolt (1992) Landolt, A. U. 1992, AJ, 104, 340
- Miller (1972) Miller, E. W. 1972, AJ, 77, 216
- Munari & Carraro (1996) Munari, U. & Carraro, G. 1996, A&A, 314, 108
- Pietrinferni et al. (2003) Pietrinferni, A., Cassisi, S., Salaris, A., et al. 2003, A&A, in preparation
- Piotto et al. (1999) Piotto, G., Zoccali, M., King, I. R., et al. 1999, AJ, 118, 1727
- Prisinzano et al. (2003) Prisinzano, L., Micela, G., Sciortino, S., et al. 2003, A&A, 404, 927
- Schlegel et al. (1998) Schlegel, D. J., Finkbeiner, D. P., & Davis, M. 1998, ApJ, 500, 525
- Stetson (1987) Stetson, P. B. 1987, PASP, 99, 191
- Stetson (1990) Stetson, P. B. 1990, PASP, 102, 932
- Stetson (1994) Stetson, P. B. 1994, PASP, 106, 250
- Stetson (2000) Stetson, P. B. 2000, PASP, 112, 925
- Stetson & Harris (1988) Stetson, P. B. & Harris, W. E. 1988, AJ, 96, 909
- van den Bergh & McClure (1980) van den Bergh, S. & McClure, R. D. 1980, A&A, 88, 360
- von Braun & Mateo (2001) von Braun, K. & Mateo, M. 2001, AJ, 121, 1522
- von Hippel et al. (2002) von Hippel, T., Steinhauer, A., Sarajedini, A., et al. 2002, AJ, 124, 1555
- Zoccali et al. (2003) Zoccali, M., Renzini, A., Ortolani, S., et al. 2003, A&A, 399, 931