Molecular Gas & Star Formation in Nearby Galaxies
Abstract
We review recent observations of molecular gas in nearby galaxies and their implications for the star formation law on large ( kpc) scales. High-resolution data provided by millimetre interferometers are now adding to the basic understanding that has been provided by single-dish telescopes. In particular, they confirm the good correlation between star formation rate (SFR) and molecular gas surface densities, while at the same time revealing a greater degree of heterogeneity in the CO distribution. Galaxies classified as SAB or SB tend to show radial CO profiles that peak sharply in the inner 20′′, indicative of bar-driven inflow. The observed Schmidt law index of 1.5 may result from a nearly linear relation between SFR and H2 mass coupled with a modest dependence of the molecular gas fraction on the total gas density. The normalisation of the Schmidt law, giving the characteristic timescale for star formation, may stem from the generic nature of interstellar turbulence.
CSIRO Australia Telescope National Facility, PO Box 76, Epping NSW 1710, Australia; and School of Physics, University of New South Wales, Sydney NSW 2052, Australia
Department of Physics, Bucknell University, Lewisburg, PA 17837, USA
1. Observational Tracers
The principal way to trace molecular gas in galaxies is with the rotational lines of the CO molecule, due to CO’s relatively high abundance (about of H2) and low excitation requirements ( K). The high abundance of CO generally makes it optically thick, especially in the lowest () transition, with the result that the effective critical density is quite low, cm-3, and the excitation temperature approaches the kinetic temperature in most molecule-rich regions. Unlike CO, H2 itself has no permitted rotational transitions, and can only be observed in infrared (quadrupolar or rovibrational) lines that require more extreme ( K) excitation conditions.
The main disadvantage of CO is that its high opacity makes it a poor tracer of column density. Indeed, the theoretical basis for using CO as a column density tracer is the virial hypothesis: the CO emission comes from an ensemble of virialised clouds that do not shield each other in position-velocity space. For a virialised cloud, the size , density , and linewidth are related by:
| (1) |
Then the CO luminosity is proportional to the H2 mass, assuming roughly constant density and temperature:
| (2) |
However, the assumption of virial equilibrium in molecular clouds has been questioned (e.g. Ballesteros-Paredes & Mac Low 2002), and in regions where CO comes predominantly from a diffuse intercloud medium—as has been suggested for starburst galaxies (Solomon et al. 1997, Downes & Solomon 1998)—the linearity between CO emission and H2 column density is likely to break down. CO is also not as self-shielding at H2, and might be dissociated even in regions where H2 is present. Finally, its abundance relative to H2 will vary according to the metallicity of the interstellar medium (ISM), and so it is unlikely to be detectable in very low metallicity regions.
Other methods to trace molecular gas include observations of far-infrared and submillimetre emission from dust, and ultraviolet (UV) H2 absorption towards continuum sources. Dust emission is usually optically thin and depends only linearly on temperature in the Rayleigh-Jeans part of the spectrum, although there are additional uncertainties arising from the adopted grain size distribution and gas-to-dust ratio. Alton et al. (2002) show that the 850m dust emission from the disk on NGC 6946 matches the CO emission very well. The UV absorption technique is biased against high gas columns because of extinction, but does provide a powerful tool to study diffuse H2. Tumlinson et al. (2002) find that the diffuse H2 fraction in the Magellanic Clouds is very low, 1% compared to 10% in the Galaxy.
For the remainder of this paper, we assume that CO can be used as a quantitative tracer of H2 within the disks of normal spiral galaxies.
2. Radial Gas Profiles
Our general knowledge of the CO distribution in galaxies is still based on the single-dish survey of some 300 galaxies conducted with the FCRAO 14-m telescope (Young et al. 1995). Using multiple-pointing observations for 193 of the galaxies, Young et al. concluded that CO is usually peaked toward galaxy centres: only in 28 galaxies was there an indication of a molecular ring or off-centre CO peak. At higher resolution, however, the picture is not so simple. The BIMA Survey of Nearby Galaxies (BIMA SONG), which imaged the distribution of CO emission in 44 nearby spirals at 6′′–9′′ resolution and included single-dish data for full flux recovery, finds that the CO distribution in spiral galaxies is generally very heterogeneous (Regan et al. 2001, Helfer et al. 2003). Even when azimuthally averaged, large departures from a smooth exponential profile are seen, due to the very clumpy distribution of molecular gas (which responds strongly to spiral arms, bar perturbations, etc.). In addition, only 20 of the 44 SONG galaxies exhibit their maximum CO surface brightness within the central beamwidth, with six galaxies showing no detectable CO emission at all in this region (Helfer et al. 2003).
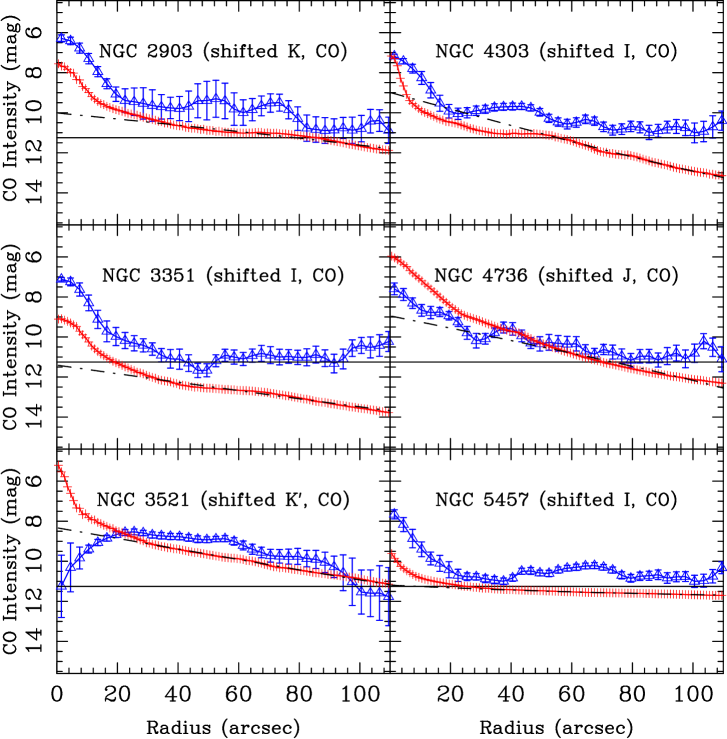
With the higher resolution imaging, the distributions of molecular gas and stars can be compared on scales relevant for studying the effects of internal dynamical processes. Even though many galaxies in BIMA SONG do not show central CO peaks, the majority do display a CO excess in the inner 20′′ above the exponential profile, where the stellar bulge contributes a similar excess to the stellar light profile (Regan et al. 2001, Thornley et al. 2003). Representative profiles are shown in Figure 1. Concentrating on the 27 BIMA SONG galaxies with the most extended CO detections, Thornley et al. (2003) have found that such CO excesses occur in both early and late-type galaxies, and are nearly universal in galaxies with some bar contribution (type SAB or SB). This suggests that at least some of the central excesses are due to bar-driven inflow of molecular gas (Sakamoto et al. 1999, Sheth et al. 2004). However, roughly half of the selected galaxies without significant bar contributions also show such central excesses, suggesting that significant bars are not required to produce gas inflow.
It is notable that the HI radial distribution is almost always much flatter than the CO, and often shows a central depression, as if the atomic gas has undergone a phase transition to form H2. Recent comparisons of single-dish CO maps and VLA HI imaging by Crosthwaite et al. (2001, 2002) highlight this dichotomy. Wong & Blitz (2002) found that for seven galaxies with high-resolution CO and HI data, the HI/CO ratio increases with radius as roughly , consistent with being determined largely by the hydrostatic pressure of the ISM, as predicted by Elmegreen (1993). In this interpretation, star formation is rarely found in low-pressure regions such as the halo or outer disk because the dominant phase of neutral gas there is atomic.
3. The Star Formation Law
The FCRAO survey indicated that CO emission scales roughly linearly with star formation tracers (e.g. Rownd & Young 1999) except in merging or interacting galaxies (Young et al. 1996), which show enhanced star formation rates. Kennicutt (1998), averaging CO, HI, and H fluxes within the optical disks of 61 galaxies, found a strong correlation between the SFR and the total gas content, consistent with a Schmidt (1959) law:
| (3) |
where and are the surface densities of the star formation rate (in ) and total gas mass (in ) respectively. The correlation of SFR with HI or CO individually was much poorer, suggesting that the gas involved in star formation can quickly cycle between atomic and molecular phases.
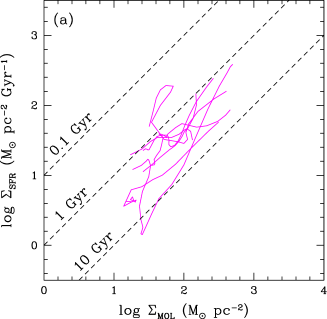
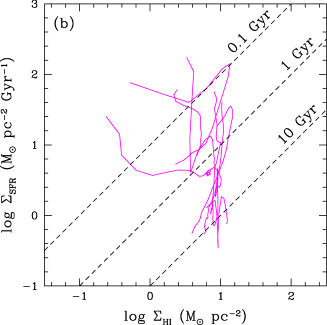
How does the star formation law behave on smaller scales? Wong & Blitz (2002) compared CO, HI, and H emission in seven galaxies from the BIMA SONG sample, and found that the Schmidt law continues to hold for azimuthally averaged rings spaced by 1 kpc. The exact slope of the power law depends on how one chooses to correct for H extinction; an extinction-free SFR indicator, such as the total IR emission (Kewley et al. 2002) might yield a more accurate slope than H. Regardless, the correlation of SFR with CO is considerably stronger than that with HI, as the HI profile is often declining or flat in the inner regions, whereas star formation is generally centrally peaked (Figure 2). It is unclear whether the poor correlation of SFR with CO found by Kennicutt (1998) may be due to differences in galaxy selection, as the galaxies studied by Wong & Blitz (2002) are relatively strong CO emitters.
If SFR generally correlates with molecular rather than atomic gas, then the Schmidt law index of 1.5 may derive from a roughly linear relation between SFR and H2 coupled with a weak dependence of the molecular fraction on :
| (4) |
This implies that star formation is a two-step process involving molecular cloud formation, and contrasts with the conventional interpretation that the index results from the free-fall (dynamical) time being the natural timescale for star formation:
| (5) |
Indeed, it has long been known that the star formation timescale is much longer than the free-fall time; this inefficiency of star formation is reflected in the numerical factor in Eq. 3 and in Eq. 5. Recently, two studies have tried to explain the observed Schmidt law using the density probability distribution function (PDF) that results from interstellar turbulence, as revealed in simulations by (e.g.) Wada & Norman (2001). Elmegreen (2002) hypothesises that only that part of the density PDF above cm-3 proceeds to form stars on a dynamical timescale, whereas Kravtsov (2003) assumes a much lower critical density of 50 cm-3 but a much longer star formation timescale of 4 Gyr. In both cases, the presence of a critical density ensures that only a small fraction of the galactic gas is involved in star formation at a given time. Detailed case studies of nearby galaxies such as M33 and the LMC may be able to shed further light on this issue.
Acknowledgments.
We thank Eva Schinnerer for providing the IRAM PdB image of NGC 4736 used in the talk, and Leo Blitz for extensive discussions over the past few years on many of the topics covered here. This work was supported by a Bolton Fellowship awarded to T.W. by the CSIRO ATNF.
References
Alton, P. B., Bianchi, S., Richer, J., Pierce-Price, D., & Combes, F. 2002, A&A, 388, 446
Ballesteros-Paredes, J. & Mac Low, M. 2002, ApJ, 570, 734
Crosthwaite, L. P., Turner, J. L., Hurt, R. L., Levine, D. A., Martin, R. N., & Ho, P. T. P. 2001, AJ, 122, 797
Crosthwaite, L. P., Turner, J. L., Buchholz, L., Ho, P. T. P., & Martin, R. N. 2002, AJ, 123, 1892
Downes, D. & Solomon, P. M. 1998, ApJ, 507, 615
Elmegreen, B. G. 1993, ApJ, 411, 170
Elmegreen, B. G. 2002, ApJ, 577, 206
Helfer, T. T., Thornley, M. D., Regan, M. W., Wong, T., Sheth, K., Vogel, S. N., Blitz, L., & Bock, D. C.-J. 2003, ApJS, 145, 259
Kennicutt, R. C. 1998, ApJ, 498, 541
Kewley, L. J., Geller, M. J., Jansen, R. A., & Dopita, M. A. 2002, AJ, 124, 3135
Kravtsov, A. V. 2003, ApJ, 590, L1
Lupton, R. H., Gunn, J. E., & Szalay, A. S. 1999, AJ, 118, 1406
Regan, M. W., Thornley, M. D., Helfer, T. T., Sheth, K., Wong, T., Vogel, S. N., Blitz, L., & Bock, D. C.-J. 2001, ApJ, 561, 218
Rownd, B. K. & Young, J. S. 1999, AJ, 118, 670
Sakamoto, K., Okumura, S. K., Ishizuki, S., & Scoville, N. Z. 1999, ApJ, 525, 691
Schmidt, M. 1959, ApJ, 129, 243
Sheth, K., Vogel, S. N., Regan, M. W., Teuben, P. J. T., Harris, A. I., Thornley, M. D., & Helfer, T. T. 2004, ApJ, submitted
Solomon, P. M., Downes, D., Radford, S. J. E., & Barrett, J. W. 1997, ApJ, 478, 144
Thornley, M. D., Spohn-Larkins, C. J. L., Regan, M. W., & Sheth, K. 2002, BAAS, 34, 1117
Tumlinson, J. et al. 2002, ApJ, 566, 857
Wada, K. & Norman, C. A. 2001, ApJ, 547, 172
Wong, T. & Blitz, L. 2002, ApJ, 569, 157
Young, J. S. et al. 1995, ApJS, 98, 219
Young, J. S., Allen, L., Kenney, J. D. P., Lesser, A., & Rownd, B. 1996, AJ, 112, 1903