The Birth of a Super Star Cluster: NGC 5253
Abstract
We present images of the 7mm free-free emission from the radio “supernebula” in NGC 5253 made with the Very Large Array and the Pie Town link. The images reveal structure in the nebula, which has a pc (50 mas radius) core requiring the excitation of 1200 O7 stars. The nebula is elongated, with an arc of emission curving to the northeast and to the south. The total ionizing flux within the central 1.2″ ( pc) is , corresponding to 7000 O7 stars. We propose that the radio source is coincident with a small, very red near-infrared cluster and apparently linked to a larger, optical source some 10 pc away on the sky. We speculate on the causes of this structure and what it might tell us about the birth of the embedded young super star cluster.
1 Introduction
NGC 5253 is a peculiar dwarf galaxy containing numerous bright super star clusters (Caldwell & Phillips, 1989; Meurer et al., 1995; Gorjian, 1996), with ages of 2-50 Myr (Calzetti et al., 1997; Tremonti et al., 2001). The current burst of cluster formation may have been induced by accretion of gas from the intergalactic medium via a prominent, minor axis dust lane. A bright source less than 2 pc in diameter (Beck et al., 1996; Turner, Ho, & Beck, 1998) dominates the radio emission of NGC 5253. The Lyman continuum rate for this single source can explain most if not all of the IRAS luminosity of the galaxy, at 3.8 Mpc (Turner, Beck, & Ho, 2000). Confirmation that the radio source is indeed an HII region came with the detections of a compact mid-infrared source with an infrared/radio flux ratio characteristic of HII regions (Gorjian, Turner, & Beck, 2001) and narrow radio and infrared recombination lines (Mohan, Ananthamariah, & Goss, 2001; Turner et al., 2003). This is a giant ultra-compact HII region, similar in properties to Galactic UCHII regions, but with a much larger ionized volume due to the excitation of thousands of O stars (Turner, Ho, & Beck, 1998). However, the “supernebula” is different from Galactic HII regions in that its embedded cluster is so massive. One difference is that gravitational pull of the cluster may confine the nebular gas to prevent the HII region from expanding (Turner et al., 2003): as yet, this is the only HII region known in which this is the case. The star formation in NGC 5253 is also unusually efficient, consistent with the formation of a bound cluster (Meier, Turner, & Beck, 2002).
We know little about how large bound clusters, such as globular clusters, form. Young super star clusters are found only in other galaxies, where they are difficult to resolve. Enhancements in the high frequency capabilities of the VLA now make it possible to map free-free emission with resolutions of tens of milliarcseconds. At this resolution the great nebula in NGC 5253 can be resolved.
We have mapped NGC 5253 at the highest resolution possible with the NRAO 111The National Radio Astronomy Observatory is a facility of the National Science Foundation, operated under cooperative agreement by Associated Universities, Inc. VLA. We used the Pie Town antenna link and Q band (7mm) receivers to obtain resolutions higher than 100 mas. Our aims were: to confirm the size of the “supernebula” in NGC 5253; to measure an optically thin free-free flux and refine the number of O stars; and to search for spatial structure.
2 Observations
We observed with the VLA in the A configuration, including Pie Town, on 2002 March 9, in good weather. To obtain diffraction-limited images at Q band (43.34 GHz), fast-switching between source and calibrator was used. The phase calibrator was J13161-33390 (J2000), which has coordinates good to mas, and the total cycle was 120 seconds. After calibration, we performed a Gaussian deconvolution of the calibrator from the beam and measured a size identical to the beam, east-west, and to within 4 mas north-south. This could reflect real structure within the calibrator, which we assumed to be a point source; however, since the elongation is north-south, it may be due to seeing. The elongation is only 5% of the north-south FWHM of the highest resolution images. The flux scale is based on 3C286, which is 1.455 Jy at Q band. We estimate that absolute fluxes are good to a few percent, with the uncertainty dominated by the finite size of 3C286. The expected rms noise level for the 45 minute integration is 0.12 mJy/beam, which is what we measure for our naturally-weighted maps.
3 Properties of the Supernebula
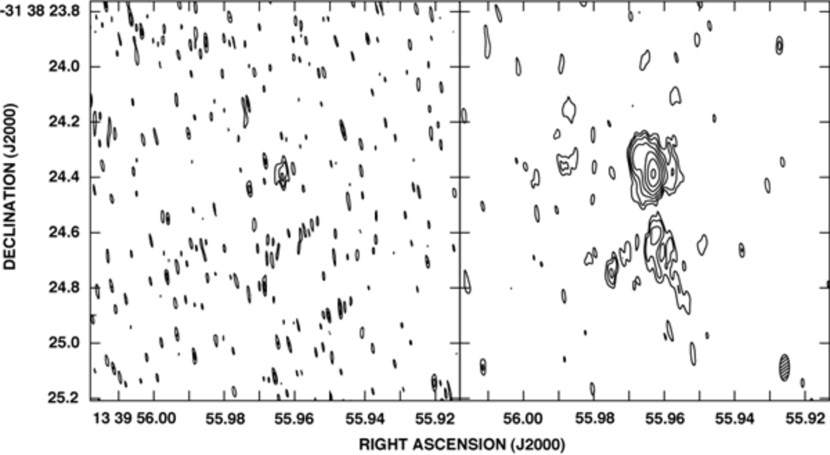
With aperture synthesis mapping one has some leeway in adjusting the weighting of different baselines to control the effective “illumination” of the aperture, and thus the beamsize. We present two maps in this paper, with different aperture weightings. Because of missing short baselines, the maps can reliably image only sources less than 1.2-1.3″ in diameter.
In Figure 1a we present our highest resolution image of NGC 5253, made with uniform weighting. The image reflects the full contribution of Pie Town, which provides long, mostly east-west baselines. The beam is 74 mas by 17 mas, p.a. 7°, and the rms noise level is 0.37 mJy/beam. In this image, the nebula clearly is resolved out. This is important information since it gives us a brightness temperature. The peak 7mm intensity is 2.2 mJy/beam, corresponding to a Rayleigh-Jeans brightness temperature of 1100K 200 K. The surrounding are K.
Following Turner, Ho, & Beck (1998) we use the radio spectrum of the HII region to infer its emission measure, EM=. The peak brightness temperature at 7mm is 1100 K; thus if we assume that K, similar to the optical nebulae (Walsh & Roy, 1987; Kobulnicky et al., 1997). The turnover frequency of the free-free emission, where equals unity (), is then 14 1 GHz. From the turnover frequency (Mezger & Henderson, 1967), we find , a value characteristic of UCHII regions. If we assume that the line of sight dimension is equal to its diameter, the density of the bright core is 3-.
In Figure 1b, we show a lower resolution image of the supernebula. The beam for this naturally-weighted image is 93 mas 34 mas, p.a. -1°. With less weighting on the sparse and atmospherically-challenged Pie Town baselines, the map has an rms of 0.11 mJy/beam. While little different in beamsize from the previous image, the core of the nebula has become apparent and we begin to pick up traces of filaments to the north and east, and a kidney-shaped envelope around the core. The bright core is located at RA 13:39:55.9631, Dec: -31:38:24.388 (J2000) 4mas, and contains 8.5 mJy of flux at 43 GHz. When deconvolved from the beam assuming a Gaussian source distribution, the core has a size of 99 9 mas by 39 mas, at p.a. =6°°, or 1.8 pc by 0.72 pc (FWHM).
The 7mm flux for the central 12 region is 50 mJy. This corresponds to a Lyman continuum rate of , the equivalent of 7000 O7 stars for the central 1.2″ (22 pc) region, 20% (8.5 mJy) of which is confined to the central 1-2 pc bright core, and one-third (15 mJy) to the 5 pc region surrounding the core. The total flux is in agreement with previous fluxes, when optical depth is taken into account (Turner, Ho, & Beck, 1998; Turner, Beck, & Ho, 2000; Meier, Turner, & Beck, 2002). From the ionizing flux and a density of , we obtain a total gas mass of (corrected for He) for the central 1 by 2 pc core; and for the inner 5 pc region. Since the density is lower outside the main core, 3000 is a lower limit to , which scales inversely with .
4 Is the Supernebula Gravity-bound?
One of our goals was to confirm our suggestion that the nebula is gravitationally bound, a finding based on recombination linewidths and the size of the radio nebula (Turner et al., 2003).
Given our new size, and more robust measure of , we can refine the calculation of the escape velocity. The core of the supernebula requires the excitation of 1200 O stars. Radio and Brackett recombination linewidths are , FWHM (Mohan, Ananthamariah, & Goss, 2001; Turner et al., 2003). For a cluster of 1200 O7 stars only, and a radius of 0.36 pc, and if we assume that the cluster is within the nebula (), then at the edge of the nebula is ; for a Salpeter cluster of stars from O3 to G (), a more likely mass function, it is ; and for a Salpeter cluster extending to K-M stars, . In the north-south direction, for a radius of 0.9 pc, these numbers become , , and , respectively. Whatever the cluster IMF may be, the escape velocity is greater than the sound speed. Gravity must play a role in the evolution of the supernebula.
Since the observed linewidths are close to the gas may actually be in gravitational equilibrium. If so, then the recombination linewidth of 75 gives a mass of 4-. A cluster of this mass is consistent with the observed IR luminosity of 1- (Gorjian, Turner, & Beck, 2001). If so, the nebula can be maintained at its small size indefinitely; in the absence of other confinement, such a dense nebula would have expanded past its present size in less than yrs.
5 Interaction of a Young SSC with its Surroundings: First Indications
Can we learn anything about the young super star cluster from the structure of its nebula? One obvious question is, where are the stars that excite the supernebula? The excitation requirements are extreme: 1200 O7 stars for the pc-sized central core, another 2000 O7 stars within the central 5 pc, and a total of 7000 O stars for the inner 20 pc region. These numbers of O stars should be multiplied by 100-200 for total numbers of stars of all masses. And that is assuming the nebula is density-bounded and no dust absorption. The true number of stars could be larger, although it cannot be too much larger with the observed . The bright core suggests that it marks the location of the young super star cluster.
At a radius of only 0.4-0.9 pc, the core of the nebula is smaller than the core radius of most Galactic globular clusters. The nebula may be intermixed with the stars. In Galactic UCHII regions, the ionized gas often forms a shell surrounding the stars (e.g., Dreher & Welch, 1981; Turner & Matthews, 1984; Wood & Churchwell, 1989) and probably arises from the ionization of surrounding placental gas. There is little evidence for molecular clouds near the supernebula in NGC 5253, although the limits of a few (Meier, Turner, & Beck, 2002) are not very stringent. Given the compactness of the nebula, the dominance of gravity, and the general windiness of O stars, the nebula could arise from mass loss from stars within the cluster. 7000 O stars can easily produce 2200 of gas over their lifetimes.
If the gas is indeed mixed in with the stars, then it could significantly affect the evolution of the young super star cluster. Intracluster gas provides a source of drag for the orbiting stars and could facilitate stellar collisions and mergers (Bonnell & Bate, 2002). The results of these mergers could be extremely massive stars or other massive objects.
If the gas is intermixed with the star cluster, and the ionized gas of the “supernebula” in NGC 5253 is in virial equilibrium, then it is possible that the shape of the nebula reflects the shape of the underlying mass distribution. The elongation of the nebula could indicate that the young super star cluster is elongated. However, this would not easily explain the larger radio arc, which is beyond gravity’s grasp.
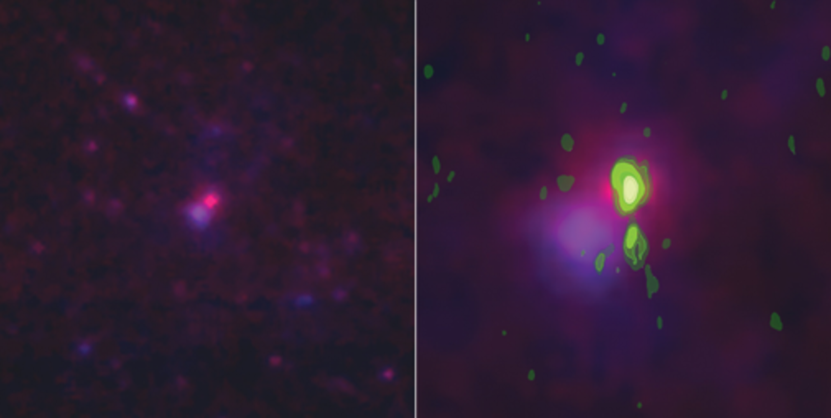
In Figure 2, we overlay our 7 mm radio image atop a false color HST/NICMOS image of the center of NGC 5253 (data described in Scoville et al., 2000; Alonso-Herrero et al., 2003). The red channel is NICMOS 1.90m continuum, and the blue channel 1.12m; the 7mm VLA image is in green. There is a diffuse blue “optical source” (source 5 in Calzetti et al., 1997; Gorjian, 1996, source 1) and a bright, very red “IR cluster.” The IR cluster appears only in m, and is offset 0.5″ to the northeast of the blue cluster (see Alonso-Herrero et al., 2003, for SEDs and ages). The absolute pointing accuracy of HST, 1″, is inadequate for registration of the infrared and radio images. However, the Keck K-band (2.2m) image of Turner et al. (2003) shows a single, slightly extended bright source coincident with the compact Brackett line source, and this K-band source is also offset to the northwest of the optical source by 05. It is thus reasonable to identify the “IR cluster” with the K-band/ Brackett line/radio source. The Brackett lines indicate a visual extinction of mag internal to the nebula, which would explain the redness of the IR cluster. While the K-band source is extended, and may include emission from nebular dust, the IR cluster at 1.9m is compact, probably an embedded star cluster.
If we adopt the coincidence of the supernebula core and IR cluster, then the faint arc of radio emission curves around in the direction of the optical source, to the southeast. As shown in Figure 2, the optical source appears diffuse compared to other clusters on the NICMOS images. It is only 10 pc in projected distance from the IR cluster. The nature of any association between the optical source and the IR/radio cluster is at this point speculative. The elongation of the supernebula core and the radio arc indicate that the nebula is “aware” of the nearby optical “cluster.” Given the proximity of the two sources in projection, and the gravity-bound gas, could it be that the arc of ionized gas is a reflection of tidal interaction between two massive star clusters, one still embedded, one visible? How will this double cluster evolve? Or is the nebula a blister feature burning its way into the surface of a molecular cloud? In this case, the optical “cluster” may not be a cluster at all, but merely a reflection nebula from a gap opening in the cocoon around the IR cluster, with the ionizing arc tracing the opening of this gap. A reflection nebula would be consistent with the diffuse morphology of the optical source. This possibility suggests another scenario: that the supernebula is cometary. The direction of the ionized arc would then suggest motion of the HII region/cluster to the west and north, which, incidentally, is the approximate direction of the infalling gas clouds of the minor axis dust lane (Meier, Turner, & Beck, 2002). Is a cometary supernebula in NGC 5253 the last kinematic remnant of the gas stream from intergalactic space that triggered the birth of this super star cluster?
6 Summary
We present a 7mm continuum image of the “supernebula” in NGC 5253 made with the VLA including Pie Town. We have resolved the nebula. Its central core is 1.8 pc by 0.7 pc in extent (99 by 39 mas) with an rms density of . It is a giant compact HII region, requiring the excitation of 1200 O7 stars for the pc-sized core, 3500 stars for the inner 5 pc, and a total of 7000 O7 stars within the central 20 pc. The overall cluster membership implied by this number of O stars is -.
We confirm the finding of Turner et al. (2003) that the supernebula is gravity-bound, possibly even in virial equilibrium. In the latter case, we obtain a mass of 4- for the embedded stellar cluster.
We overlay the 7mm image on a NICMOS near-IR continuum image. There is a heavily reddened IR cluster not evident in optical images. We suggest that this IR cluster is responsible for the radio nebula. A faint radio arc curves in the direction of a bright optical source 10 pc away. The nature of the optical source is unclear: it may be a reflection nebula. The elongation of the core of the supernebula could indicate that the underlying stellar cluster, which is most likely intermixed with the HII region, is itself elongated. Or, the curved shape of the nebula and faint radio arc may reflect interactions of the young cluster with its surroundings, possibly reflecting motion of the newly-born cluster within the galaxy.
References
- Alonso-Herrero et al. (2003) Alonso-Herrero, A., Takagi, T., Scoville, N. Z., Rieke, M. J., Rieke, G. H., Baker, A., & Imanishi, M. 2003, in preparation
- Beck et al. (1996) Beck, S.C., Turner, J.L., Ho, P.T.P., Lacy, J.H., & Kelly, D.M., 1996, ApJ, 457, 610
- Beck et al. (2000) Beck, S.C., Turner, J.L., & Kovo, O., 2000, AJ, 120, 244
- Bonnell & Bate (2002) Bonnell, I. A., & Bate, M. R. 2002, MNRAS, 336, 659
- Calzetti et al. (1997) Calzetti, D., Meurer, G., Bohlin, R.C., Garnett, D.R., Kinney, A.L., Leitherer, C., & Storchi-Bergmann, T., 1997 AJ, 114, 1834
- Caldwell & Phillips (1989) Caldwell, N., & Phillips, M. M. 1989, ApJ, 338, 789
- Dreher & Welch (1981) Dreher, J. W., & Welch, W. J. 1981, ApJ, 245, 857
- Gorjian (1996) Gorjian, V. 1996, AJ, 112, 1886
- Gorjian, Turner, & Beck (2001) Gorjian, V., Turner, J. L., & Beck, S. C. 2001, ApJ, 554, L29
- Kobulnicky & Skillman (1995) Kobulnicky, H. A., & Skillman, E. D. 1995, ApJ, 454, L121
- Kobulnicky et al. (1997) Kobulnicky, H. A., Skillman, E. D., Roy, J.-R., Walsh, J. R., & Rosa, M. R. 1997, ApJ, 477, 679
- Martin & Kennicutt (1995) Martin, C.L. & Kennicutt, R.C. Jr., 1995, ApJ, 447, 171
- Meier, Turner, & Beck (2002) Meier, D. S., Turner, J. L., & Beck, S. C. 2002, AJ, 124, 877
- Meurer et al. (1995) Meurer, G. R., Heckman, T. M., Leitherer, C., Kinney, A., Robert, C., & Garnett, D. R. 1995, AJ, 110, 2665
- Mezger & Henderson (1967) Mezger, P. G.,& Henderson, A. P. 1967, ApJ, 147, 471
- Mohan, Ananthamariah, & Goss (2001) Mohan, N., Ananthamariah, K. R., & Goss, W. M. 2001, ApJ, 557, 659
- Scoville et al. (2000) Scoville, N. Z., et al. 2000, AJ, 119, 991
- Tremonti et al. (2001) Tremonti, C. A., Calzetti, D., Leitherer, C., & Heckman, T. 2001, ApJ, 555, 322
- Turner & Matthews (1984) Turner, B. E., & Matthews, H. E. 1984, ApJ, 277, 164
- Turner et al. (2003) Turner, J. L., Beck, S. C., Crosthwaite, L. P., Larkin, J. E., McLean, I. S., & Meier, D. S. 2003, Nature, 423, 621
- Turner, Beck, & Ho (2000) Turner, J. L., Beck, S.C., & Ho, P.T.P., 2000, ApJ, 532, L109
- Turner, Beck, & Hurt (1997) Turner, J. L., Beck, S. C., & Hurt, R. L. 1997, ApJ, 474, L11
- Turner, Ho, & Beck (1998) Turner, J. L., Ho, P.T.P., & Beck, S.C., 1998, AJ, 116, 1212
- Walsh & Roy (1987) Walsh, J. R., & Roy, J.-R. 1987, ApJ, 319, L57
- Wood & Churchwell (1989) Wood, D. O. S., & Churchwell, E. 1989, ApJ, 340, 265