Theoretical Fe i/ii/iii Emission-Line Strengths from Active Galactic Nuclei with Broad-Line Regions
Abstract
We present theoretical iron emission line strengths for physical conditions typical of Active Galactic Nuclei with Broad-Line Regions. The non-local thermodynamic equilibrium (NLTE) models include a new and extensive treatment of radiative transfer in the Fe III ion, complementing the Fe II emission line strengths predicted in our earlier works. We also briefly present preliminary results for the Fe I emission from AGN using a reduced atom model. We can satisfactorily reproduce the empirical UV Fe III emission line template of Vestergaard & Wilkes (2001) for the prototypical narrow-line Seyfert 1 galaxy I Zw 1, both in terms of the general Fe III flux distribution and the relative strength of the Fe III and Fe II emission. However, a number of detailed features are still not matched; the most prominent example is the strongest single Fe III feature observed in the I Zw 1 spectrum, UV47: it is predicted to be strong only in models suppressing Fe-H charge exchange reactions. We examine the role of variations in cloud turbulent velocity and iron abundance and carry out Monte Carlo simulations to demonstrate the effect of uncertainties in atomic data on the computed spectra.
1 Introduction
The ultraviolet spectra of active galactic nuclei (AGN) with broad-line regions (BLRs) exhibit a quasi-continuum of thousands of blended iron emission lines, dominated by Fe II (Wills et al. 1980, Wills, Netzer, & Wills 1980); numerous Fe II transitions are also present in the optical (Boroson & Green 1992, Véron-Cetty, Joly & Véron 2004) and near-infrared (Rudy et al. 2000, Rudy et al. 2001, Rodríguez-Ardila et al. 2002). Since their recognition as a significant component of the BLR emission spectrum, these Fe II transitions have been the subject of intense observational scrutiny and theoretical modelling (Netzer 1980; Kwan & Krolik 1981; Netzer & Wills 1983; Wills, Netzer & Wills 1985; Elitzur & Netzer 1985; Collin-Souffrin et al. 1986; Penston 1987; Collin-Souffrin, Hameury & Joly 1988; Dumont & Collin-Souffrin 1990; Netzer 1990; Sigut & Pradhan 1998; Verner et al. 1999; Sigut & Pradhan 2003). Reproducing the strength of the Fe II emission has been a considerable challenge for traditional photoionized models for the BLR clouds; typically the Fe II/H flux ratio is observed to be , ranging from to near in the case of super-strong Fe II emitters (Joly 1993; Graham, Clowes & Campusano 1996).
However Fe II is not the only component of the low-ionization emission spectrum of the BLR. Ultraviolet transitions of Fe III are also well established (Baldwin et al. 1996, Laor et al. 1997, Vestergaard & Wilkes 2001). Laor et al. (1997) identify a strong feature near Å in the spectrum of the prototypical narrow-line Seyfert 1 (NLS1) galaxy I Zw 1 as Fe III multiplet UV47. Most recently, Vestergaard & Wilkes (2001) provide a detailed analysis of the UV Fe III emission from the I Zw 1 and use their observations to empirically derive Fe II and Fe III flux templates.
In our previous work (Sigut & Pradhan 2003, hereafter SP03), we constructed a detailed non-LTE radiative transfer model for Fe II, including 829 atomic levels, and predicted a large number () of Fe II emission line strengths for conditions typical of BLRs of AGN. In this paper, we extend our earlier work on Fe II to compute detailed non-LTE models for Fe i-iv. We compare these predictions to the observed UV I Zw 1 template.
2 Atomic Data
The four lowest ionization stages of iron, Fe i-iv, were explicitly included in the calculations (although Fe IV was included as only a one-level atom). A summary of the complete iron model atom is given in Table 1. The final non-LTE atomic model includes 944 energy levels and 14,962 radiative bound-bound (rbb) transitions. With the exception of level energies, the majority of radiative and collisional atomic data was computed using methods developed under the Iron Project111Complete references for the Iron Project are given at www.astronomy.ohio-state.edu/pradhan (Hummer et al. 1993, IP.I). The R-matrix method employed in the Iron Project (IP) ensures relatively uniform accuracy for the computed data. In the following sections, the IP atomic data will also be identified according to the number of the paper in the ongoing IP series published in Astronomy and Astrophysics (e.g. IP.I for the first paper in this series).
2.1 Fe I
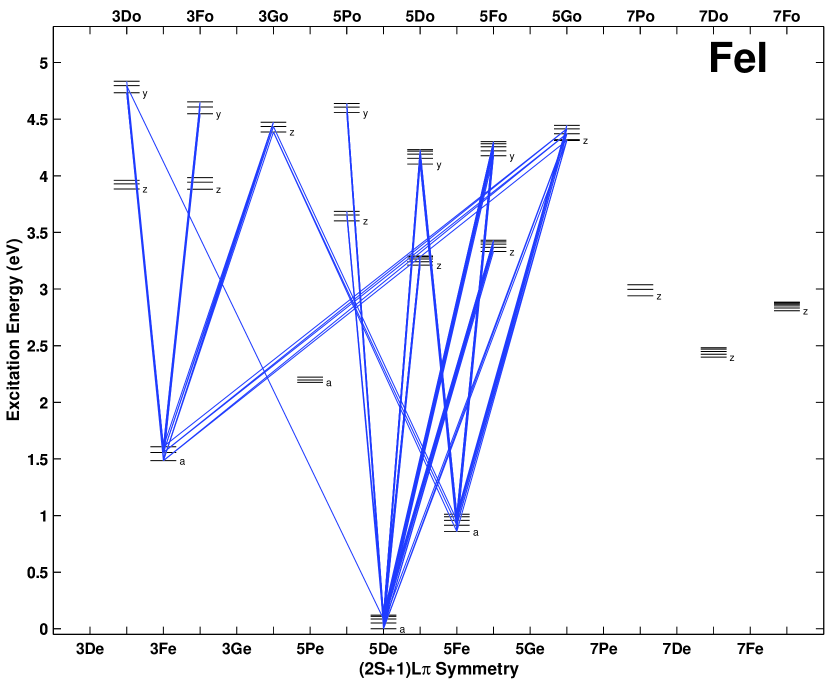
A minimal Fe I atomic model was included in the calculation, mainly to predict the ionization fraction of Fe I in the various BLR models and provide preliminary flux estimates. While rare, Fe I fluxes have been tentatively identified for a few Fe II-strong quasars (Boroson & Green 1992, Kwan et al. 1995). The Fe I atomic model consisted of 77 fine-structure levels (see Figure 1) comprising 19 low-energy LS levels from the triplet, quintet, and septet spin symmetries. Energy levels and Einstein spontaneous transition probabilities ( values) for the 185 transitions were taken from the NIST compilation222http://physics.nist.gov/PhysRefData/contents-atomic.html. Photoionization cross sections were adopted from the R-matrix calculations of Bautista & Pradhan (1997, IP.XX). Low-temperature, IP effective collision strengths for electron impact excitation of the first 10 meta-stable Fe I levels have been computed by Pelan & Berrington (1997, IP.XXI). All remaining collision strengths were estimated with the effective Gaunt factor approximation of van Regemorter (1962).
2.2 Fe II
Atomic data for Fe II has been extensively discussed by Sigut & Pradhan (1998, 2003). The IP data for collisions strengths for electron impact excitation were computed by Zhang & Pradhan (1995, IP.VI), for radiative transition probabilities, by Nahar (1995, IP.VII), and for photoionization cross sections, by Nahar & Pradhan (1994). We have adopted the smaller, 256 fine-structure level atom of Sigut & Pradhan (1998) for use in this calculation. The smaller number of Fe II levels allows a maximal number of Fe III energy levels to be simultaneously included. However, this smaller Fe II atom is still sufficiently large for realistic estimates of the flux and the inclusion of fluorescent excitation.
Among the atomic data for Fe II, we call particular attention to the charge-exchange reaction rates of Neufeld & Dalgarno (1987). These large rates, computed in the Landau-Zener approximation, play an important role in the Fe II-Fe III ionization balance. However, their accuracy and efficacy in determining emission line strengths can be a source of uncertainly in the present calculations, as discussed later.
2.3 Fe III
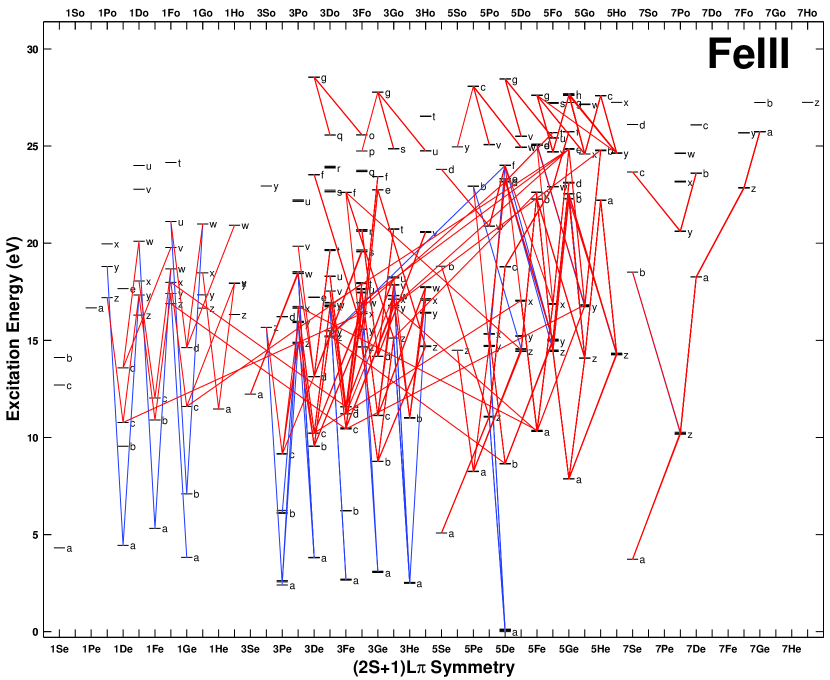
Fe III was represented by 581 fine-structure energy levels (see Figure 2) which includes all Fe III levels with known energies (see the NIST compilation; also Nahar & Pradhan 1996). We have used four principal sources to compile the required values for Fe III transitions: the NIST critically-evaluated database; the R-matrix results of Nahar & Pradhan (1996, IP.XVII) for dipole-allowed () transitions; the Hartree-Fock calculations of Ekberg (1993), which also treats inter-system () transitions, and the extensive semi-empirical calculations of Kurucz (1992).
Photoionization cross sections were adopted from Nahar & Pradhan (1996, IP.XVII). Collision strengths for electron impact excitation were adopted from Zhang (1996, IP.XVIII). All remaining collision strengths were estimated with the Gaunt factor approximation. Charge exchange reactions with Fe IV were also included following Kingdon & Ferland (1996).
3 Calculations
The iron line fluxes were calculated using the procedure of SP03. Briefly, a background temperature and density structure for a single BLR cloud of a given ionization parameter and total particle density was computed with cloudy (Ferland, 1992). The shape of the photoionizing continuum was taken to be that of Mathews & Ferland (1987). Given this fixed, one-dimensional model, the coupled equations of radiative transfer and statistical equilibrium were solved for a self-consistent set of iron level populations and line fluxes. A complete discussion of the system of equations solved, including the treatment of fluorescent excitation by Lyman- and Lyman-, and the implementation details, are given in SP03. We note that our treatment of fluorescent excitation involves first the construction the full frequency-dependent, PRD (partial-redistribution) source functions for Lyman- and Lyman-, and then their inclusion in the total monochromatic source functions used in the radiative transfer solutions for all overlapping iron rbb transitions.
In the current work, each set of iron fluxes is specified by four model parameters representing the BLR cloud: the ionization parameter, the total particle density, the (internal) cloud turbulent velocity333Turbulent velocity is used to refer to what is commonly denoted microturbulence by stellar astronomers; this velocity represents the width of a Gaussian distribution of turbulent motions small in scale compared to unit optical depth. These motions act to broaden the atomic absorption profile and thus can alter the radiative transfer solution in each line., and the iron abundance relative to hydrogen. Table 2 identifies the different BLR models constructed in this work and the associated ionization parameters and particle densities.
4 Iron Ionization Balance
The ionization balance among the four lowest ionization stages of iron was self-consistently calculated simultaneously with the level populations. Expression for the total and level-specific photo and collisional ionization-recombination rates are given in Paper I. A small correction was applied at each depth for the fraction of iron more highly ionized than Fe IV, with this correction being estimated by cloudy.
Our self-consistent procedure is different from Verner et al. (1999) who first solve for the iron ionization balance in isolation, balancing photoionization from the ground states against effective recombination rates, and then solving for the individual (Fe II) level populations using a fixed ionization structure. While this approximation is typical of nebular work where the population in the excited states is very small, densities in the BLR may approach particles per cm3, high enough to warrant a detailed treatment of photoionization from excited states in the calculation of the ionization balance. Another advantage of our approach is that no a priori assumptions are made as to the optical depths in the radiative transitions forming the recombination cascade (assumptions usually expressed as “Case A” or “Case” B, following Osterbrock, 1989, for example); a self-consistent solution is automatically obtained.
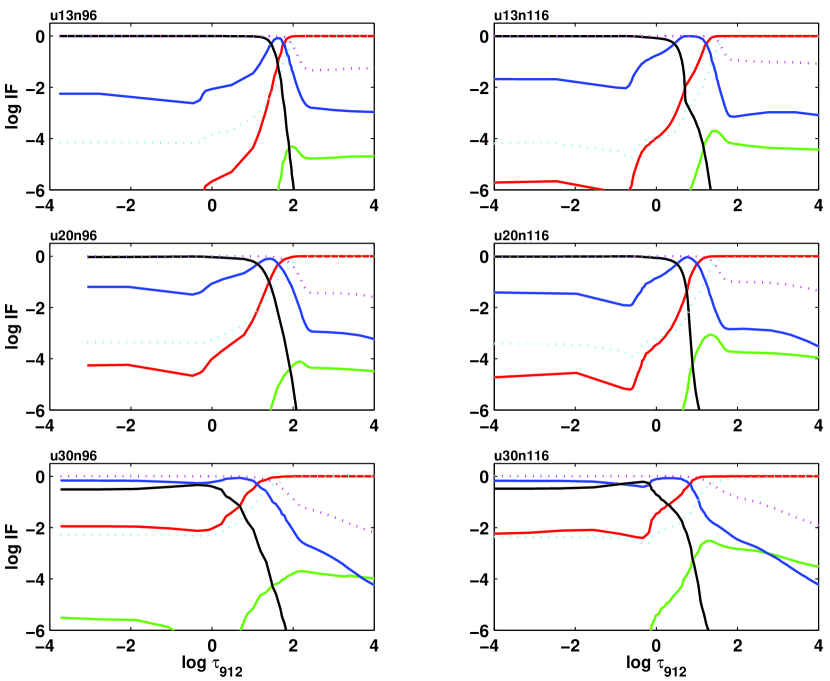
Figure 3 shows the Fe I-Fe IV ionization balance for all the models of Table 2 assuming a solar iron abundance and turbulent velocity of 10 (at K, the thermal widths of the iron lines are ). At large optical depths in the Lyman continuum, Fe II is always the dominant iron species. However, closer to the illuminated face, the ionization parameter plays a strong role; for the lowest ionization parameter considered, Fe III dominates in the outer layers, while at the higher ionization parameters, Fe IV is the dominant species, with Fe III confined to a narrow zone at intermediate Lyman continuum optical depths. Also shown in Figure 3 is the hydrogen ionization balance as predicted by cloudy. The ionization of hydrogen has a strong influence on the iron ionization balance not only through the obvious effect of its opacity on the local ionizing radiation field, but also through strong charge-exchange reactions, .
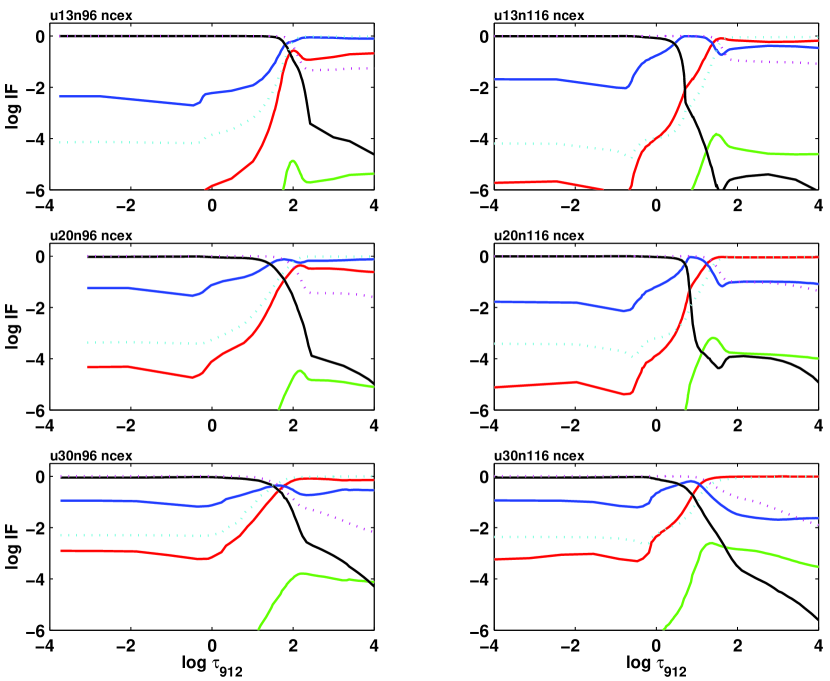
Figure 4 shows the predicted ionization fractions in the same BLR models as Figure 3 except neglecting Fe-H charge-transfer reactions. There are significant differences, most notably for the higher ionization parameters at the lower particle density considered, models u20h96 and u13h96. The absence of charge exchange reactions in these models leads to Fe III, and not Fe II, as the dominant iron ionization stage throughout the cloud model. The influence of the charge-exchange reactions on the predicted iron fluxes will be discussed in a later section; such models may be partially supported by observation of I Zw 1 as they are better able to account for an intense feature near Å identified by Laor et al. (1997) as Fe III UV47. We note that the charge exchange ionization and recombination rates for predicted by Neufeld & Dalgarno (1987) were obtained in the rather crude Landau-Zener approximation (see Flower 1990, also Kingdon & Ferland 1996) and thus it is not inconceivable that this rate may be significantly overestimated.
Finally we note that the predicted fraction of Fe I in all cases, including the lowest ionization parameter considered, is very small, . The question of weather or not such a small neutral fraction can account for the tentatively identified Fe I features in AGN spectra will be addressed in a later section.
5 Predicted Fe III Fluxes
Table 3 gives the total iron fluxes in the wavelength interval of 1500-5000 Å for the single-zone BLR cloud models of Table 2. The effect of increasing the cloud turbulent velocity from 10 to 50 and of tripling the iron abundance relative to hydrogen are also given. The total flux is broken down into the percentage contributions of each of the iron ions. The higher density models with the largest ionization parameters, models u20h11 and u13h11, predict the largest contribution of the flux arising from Fe III, approaching % in model u13h11. As also seen from the table, the percentage contribution of Fe III tends to decrease with increasing turbulent velocity but increases with an enhanced iron abundance; the u13h11 model with a threefold enhancement of the iron abundance comes close to having an equal flux split between Fe II and Fe III. It should be borne in mind that these comparisons are with the significantly smaller atom Fe II of Sigut & Pradhan (1998) to allow the simultaneous treatment of the current large Fe III atom.
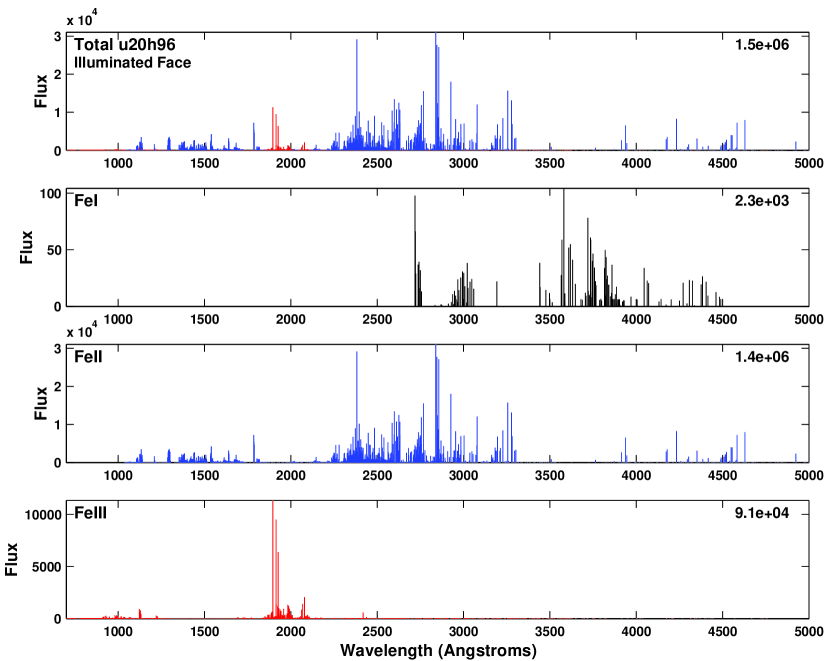
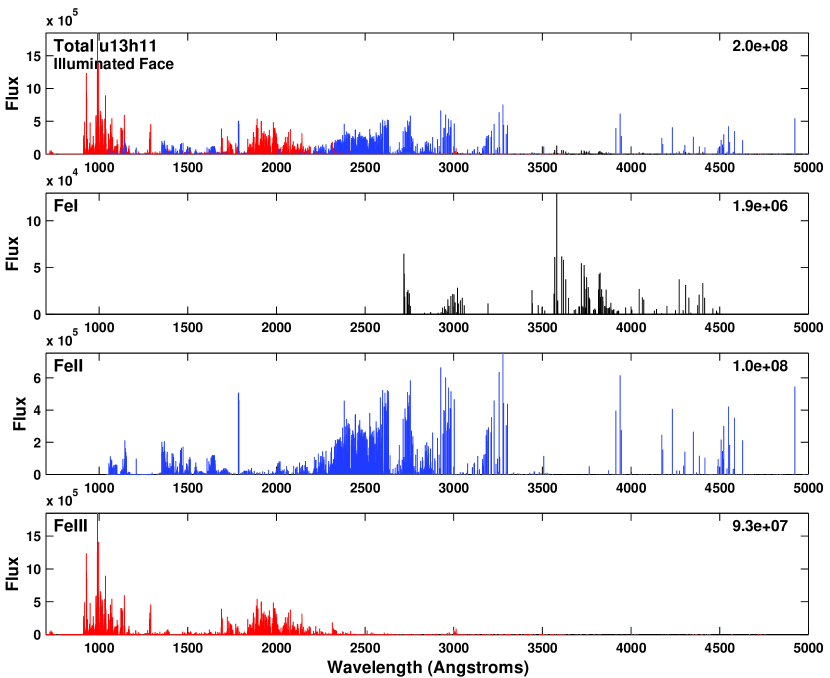
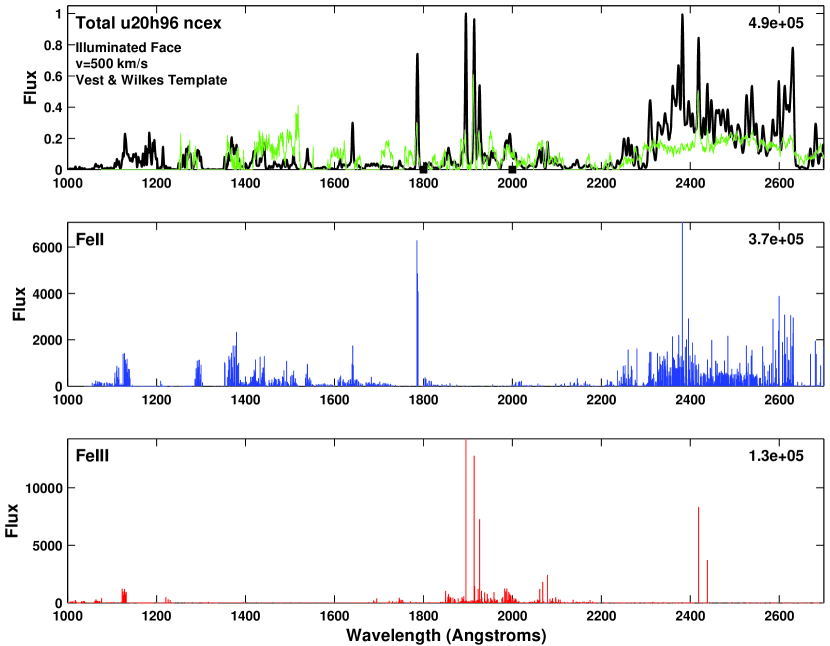
Figures 5 and 6 show the wavelength distributions of the emitted iron line fluxes for the u20h96 and u13h11 models, respectively, in the case of a solar iron abundance and 10 km/s of turbulent velocity. The lower wavelength limit has been extended down from the 1500 Å of Table 3 to 500 Å in order to show the complete Fe III spectrum. The separate panels in these plots show the total flux as well as the contributions from the individual iron ions. There is a striking difference in the Fe III fluxes predicted for these two models. For u20h96, the strongest Fe III emission occurs at wavelengths near 1900 Å. These transitions represent decays from the lowest odd-parity Fe III level, , to and are the only possible transitions (see Figure 2). Inter-system () transitions from to , the Fe III ground state, giving lines near Å, and to , giving lines near Å (multiplet UV47), are also present but weak. The multiplet UV47 transitions identified as the strongest Fe III features in the spectrum of I Zw 1 by Laor et al. (1997) will be further discussed in Section 8.1. Decays from the only other low-lying odd-parity level, , about eV above , are not prominent in the predicted spectrum for u20h96. A number of decay paths from this level are possible, including the Fe III ground state resulting in transitions near Å, as well as decays to and giving rise to transitions with Å.
The higher ionization parameter, higher density model u13h11 presents a radically different picture. Now, the region around 1000 Å dominates the Fe III emission. This region is filled with decays from the numerous odd-parity levels near eV to the lowest even parity levels (eV) of each spin system. The spectral region around Å is now filled with strong Fe III emission arising principally from the decay of odd parity levels to the numerous even parity levels near eV. As noted in Table 3, a significant fraction of the total iron flux comes out in the form of Fe III transitions.
In both of these models, fluorescent excitation by Lyman- is unimportant due to the absence of significant line-overlap with any Fe III transitions. However, fluorescent excitation by Lyman- offers more potential. There are transitions from several low-lying, even-parity triplet states within a few Ångstroms of Lyman- (at Å): - at Å (), - at Å (), and - at , Å (,). Re-performing the u20h96 model without Lyman- fluorescent excitation resulted in a reduction in the total predicted Fe III flux of only about 12%; the reduction in the case of u13h11 from the absence of Lyman- fluorescent excitation was negligible.
6 Predicted Fe I Fluxes
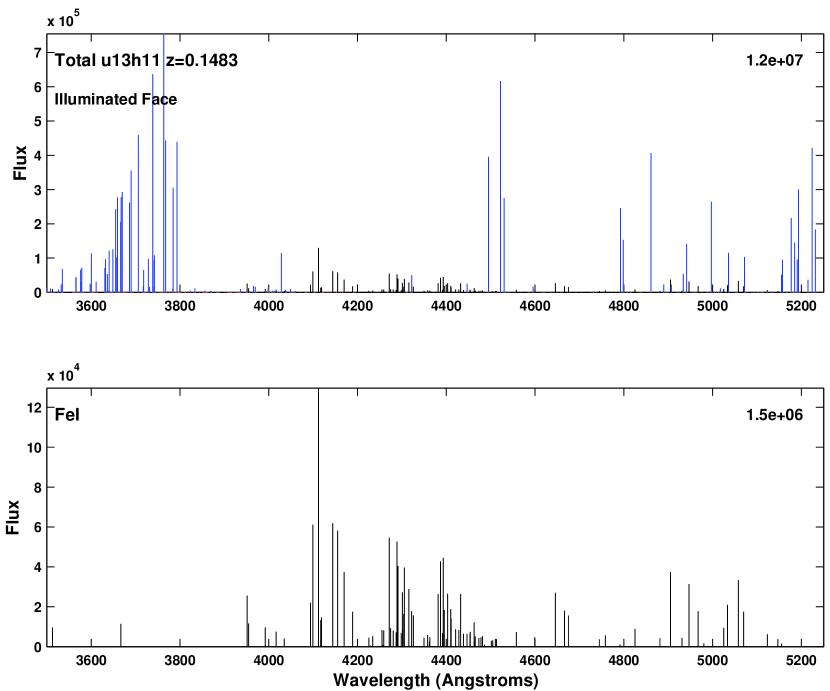
According to Table 3, % of the iron line flux comes out in transitions of Fe I. In Figure 6, representing model u13h11, the predicted emission due to Fe I in the -Å region is, although quite weak, not entirely negligible. This is illustrated in Figure 7; the strongest transitions present in this figure are just those expected from the Fe I Grotrian diagram of Figure 1, namely decays from low-lying odd parity levels between to eV to the three lowest even parity states, the ground state, , and . The strongest predicted multiplet is 23, - , giving lines near Å. Such multiplets of Fe I have been tentatively identified in PHL 1092 by Bergeron & Knuth (1980) and Kwan et al. (1995) and in IRAS 07598+6508 by Kwan et al. Both objects are Fe II-strong quasars. The current calculations tend to support these identifications and the occurrence of Fe I transitions in some AGN spectra. Comparing our predictions to the IRAS 07598+6508 spectrum given by Kwan et al. (their Figure 1), we note that the observed Fe I flux relative to the nearby Fe II flux between Å is much larger than predicted by our models, even when considering the effect of the tentative Ti I blends identified by Kwan et al. However, it is likely that our models underestimate the Fe I flux; the very limited Fe I atomic model employed artificially suppresses recombination by omitting energy levels within eV of the continuum. This acts both to reduce the recombination contribution the line fluxes and to lower the Fe I ionization fraction which also leads to weaker lines. We plan to extend our treatment of the Fe I atomic model in the future to provide more realistic flux estimates to compare with these observations.
7 Dependence of Iron Flux on BLR Cloud Parameters
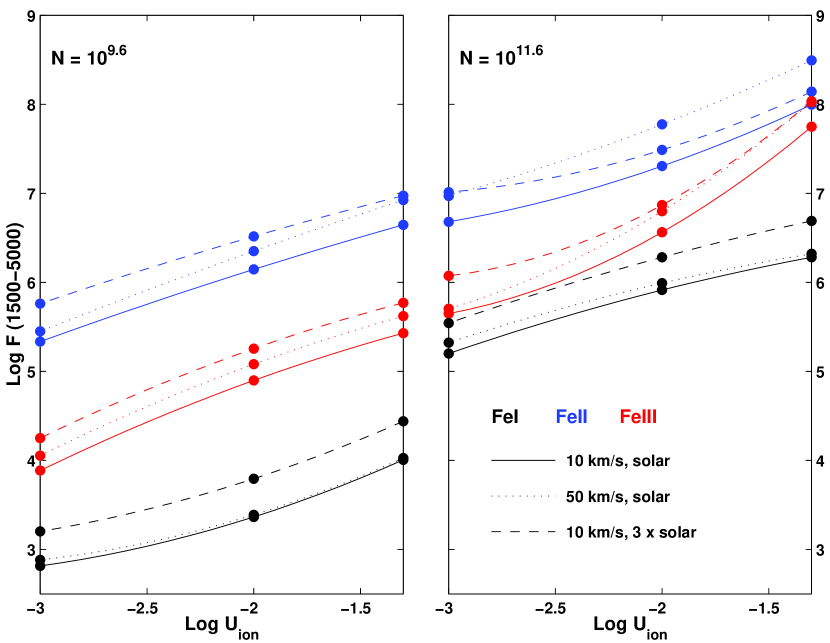
Figure 8 summarizes the dependence of the Fe I, Fe II, and Fe III fluxes on the various model parameters. The trend of increasing iron line fluxes with both ionization parameter and particle density is evident, as well as the maximization of the Fe III fluxes for the higher ionization parameter models. The figure also shows increased flux in Fe II and Fe III for either an increased cloud turbulent velocity or an increased iron abundance. Interestingly, however, the predicted Fe I flux does not depend on the internal cloud turbulent velocity. The lines of Fe I are weak and unsaturated so are insensitive to the turbulent velocity, contrary to the lines of the other ionization stages. From this figure it might seem that the internal cloud turbulent velocity might be deducible from the spectrum of an object exhibiting lines of both Fe I and Fe II. In fact, this is the classic technique in stellar atmospheres to determine the turbulent velocity dispersion (often dubbed microturbulence)–forcing weak and strong lines to be reproduced in strength by the same abundance. It might be worthwhile to attempt this in AGN; however, the situation is much more complex as the entire BLR spectrum is likely not formed within a single cloud or ensemble of identical clouds (Baldwin et al. 1995); the question would arise as to whether clouds of different ionization parameters and particle densities would have similar turbulent velocities. Nevertheless it would be still worthwhile to attempt this investigation. Knowledge of the intrinsic width of an emission line for individual clouds in the BLR has important implications on the uncertain nature of the BLR clouds themselves. Narrow, near thermal widths of imply large numbers of BLR clouds in oder to reproduce the smooth observed line profiles. Much larger intrinsic widths would require fewer clouds to produce smooth profiles, perhaps allowing stellar models for the BLR clouds to become viable (Peterson, Pogge & Wanders, 1999).
8 Comparison to I Zw 1 Fe II-Fe III UV Template
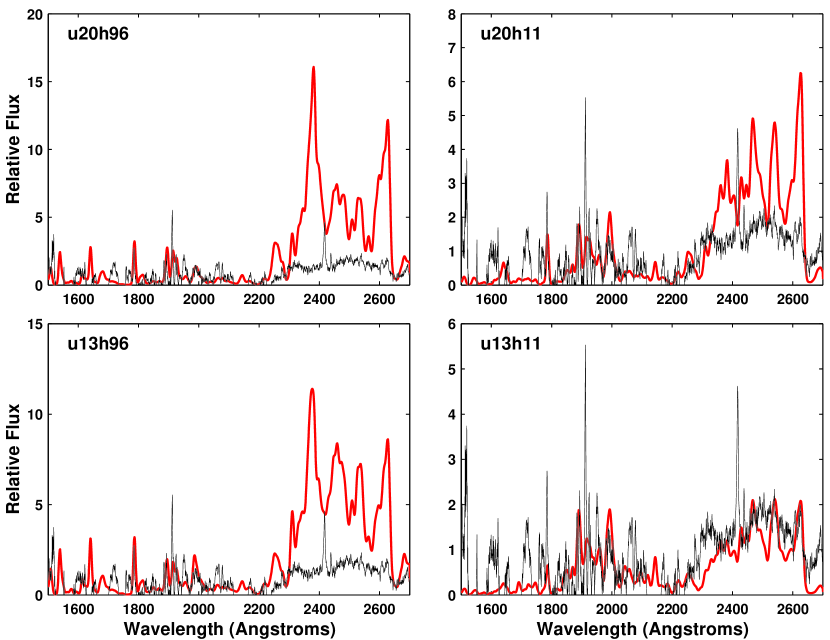
Vestergaard & Wilkes (2001) provide an empirical Fe II-Fe III UV template (Å) derived from I Zw 1, the prototypical narrow-line Seyfert 1 galaxy. One of the main results of this work is the careful documentation of extensive Fe III emission from I Zw 1, building on the identifications of Laor et al. (1997). Figure 9 compares four of our basic models with a solar iron abundance and minimal turbulent velocity (10 ) with the I Zw 1 template. In these comparisons, the calculations have been broadened by convolution with a Gaussian to (FWHM), and the template has been normalized to the median model flux in the region of strongest Fe III flux included in the template wavelength region, -Å. Only our highest-density, highest ionization parameter model, u13h11, correctly reproduces the overall level of the Fe II UV emission line strength in the -Å region. Thus we find that there is, in principle, no problem in accounting for the basic level of Fe III flux from I Zw 1, even with a crude, single-zone model.
While inspection of Figure 9 clearly reveals a strong correlation between the model and the empirical template, there are several disagreements in detail. In the principle Fe III wavelength region, -Å, the relative strengths of individual features are not correctly reproduced. Most notable, however, is the failure of the basic model to correctly reproduce the strength of the Fe III feature near Å identified by Laor et al. (1995). This strong feature is associated with Fe III multiplet UV47, the inter-system transition -, giving (identified) features near Å (, ) and Å (, ). Finally, some of the disagreement in the -Å region can be traced to our use of a limited Fe II model atom.
To assess the seriousness of these discrepancies, we have performed additional calculations along two fronts: first, we considered predictions of models in which the highly-uncertain Fe-H charge-exchange reactions were omitted. As noted in section 4, omission of these rates can substantially alter the iron ionization balance for certain models; secondly, we have performed a series of Monte Carlo simulations to assess the effect of errors in the basic atomic data have in the predicted Fe III line fluxes. We shall first discuss models omitted charge-exchange reactions.
8.1 Charge-Exchange and Fe III UV47 in I Zw 1
The important role played by the rather uncertain Fe-H charge exchange reaction rates motivated us to compute a series of models in which these rates were omitted. The predicted iron ionization balances have already been discussed in section 4 with the results shown in Figure 4. The predicted flux of model u20h96 without charge-exchange reactions is shown in Figure 10 and these predictions may be compared with Figure 5. As expected by the change in the ionization balance shown in Figures 3 and 4, the model without charge-exchange reactions has a lower Fe II flux and a higher Fe III flux. It is still the case that normalizing the predicted iron fluxes to the observed template in the interval -Å results in an over-prediction of the Fe II flux, but the over-prediction is now less. Now conspicuous in the model omitting charge-exchange reactions is the presence of strong lines of Fe III multiplet UV47. However, this is not translated into a significantly better fit to the Vestergaard & Wilkes template as shown by the upper panel of Figure 10. While there is now a strong predicted feature at Å corresponding to Fe III, the fit to the Fe II flux retains strong features for Å, centred around Fe II Å (-), which have no counterpart (in terms of observed strength) in the empirical template. We have also explored the possibility that the Fe III Å feature is strengthened by numerous, blended Fe II transitions by merging our predicted Fe III fluxes with the more extensive Fe II fluxes of SP03 based on an 829-level Fe II model atom. However, such merged line-lists did not help to improve the fit by much.
The overall fit to the Fe II flux distribution is generally better for the higher density models () but unfortunately these models do not predict strong Fe III features for multiplet UV47, either with or without charge-exchange reactions.
8.2 Monte Carlo Simulation Estimates for Error Bounds
Given that all of the models presented have shortcomings when compared to the Vestergaard & Wilkes template, it is important to assess the accuracy to which the iron line fluxes can be computed. This is a complex question, encompassing everything from the accuracy of the underlying BLR cloud model(s) and the approximations used in the numerical methods to the accuracy of the underlying atomic data. In this work, we will address only the latter issue by asking how accurately the iron line fluxes can be predicted given the sometimes large uncertainties in the basic atomic data. Even this question is not completely straightforward. For example, a single value clearly affects the flux in the radiative transition. However, through the coupling of the atomic level populations by the statistical equilibrium equations, and the global coupling of the emitting volume through the transfer of radiation, a single value can possibly affect the fluxes in many lines. And similar observations can be made, in principle, for all of the remaining atomic data, including the photoionization and recombination rates and the collisional excitation and de-excitation rates. To address all of these interconnections in a consistent manner, we have turned to the Monte Carlo simulation technique used by Sigut (1996). Each fundamental atomic parameter ( value, effective collision strength, photoionization cross section, collisional ionization cross section, and charge-transfer reaction rate) is assigned an uncertainty. Given these uncertainties, a set of atomic data is randomly realized and used to solve the radiative transfer-statistical equilibrium problem for the iron fluxes. Then, a new set of atomic data is randomly realized and the predicted fluxes for this new data found. This sequence is repeated, and the width of the distribution of each line flux can be taken as a measure of its uncertainly.
Table 4 lists the basic atomic data uncertainties adopted for our collection of iron atomic data. The error assignment is kept deliberately simple; in principle, uncertainties could be assigned on a transition by transition basis. The R-matrix collision strengths (cbb rates) for low ionization states computed under the Iron Project are the most accurate ones available. However, they also display extremely complicated structure due to autoionizing resonances in the near-threshold region which dominates the rate coefficient at K. Therefore, uncertainties as large as a factor of for individual transitions can not be ruled out. The values (rbb rates) are expected to be more accurate; however, significant errors may still be present, particularly in several calculations where relativistic effects have not been considered in an ab initio manner. Such calculations are now in progress, but the computations are about an order of magnitude more difficult that those in LS coupling (see Nahar, 2003).
The distribution of the random scalings is also kept very simple: a set of uniform random deviates, , is computed with the ran2 algorithm of Press et al. (1986). Given the uncertainty assignment, , from Table 4, a uniform set of deviates for the logarithm of the scaling is found from the linear relation where and . The actual set of scalings, , is taken as . This procedure ensures the following common-sense property of the scalings: for example, if a charge-exchange rate is assumed accurate to within a factor of 100, then one might expect the a scaling from to be as likely as one from . However, this procedure also results in the mean scaling being different from one, namely ; for example, the mean scaling for is about . Thus the most probable value for the rate is not that adopted in the default (unscaled) atomic model. However, given the uncertainty (a factor of 100 in this case), we do not consider this deviation significant.
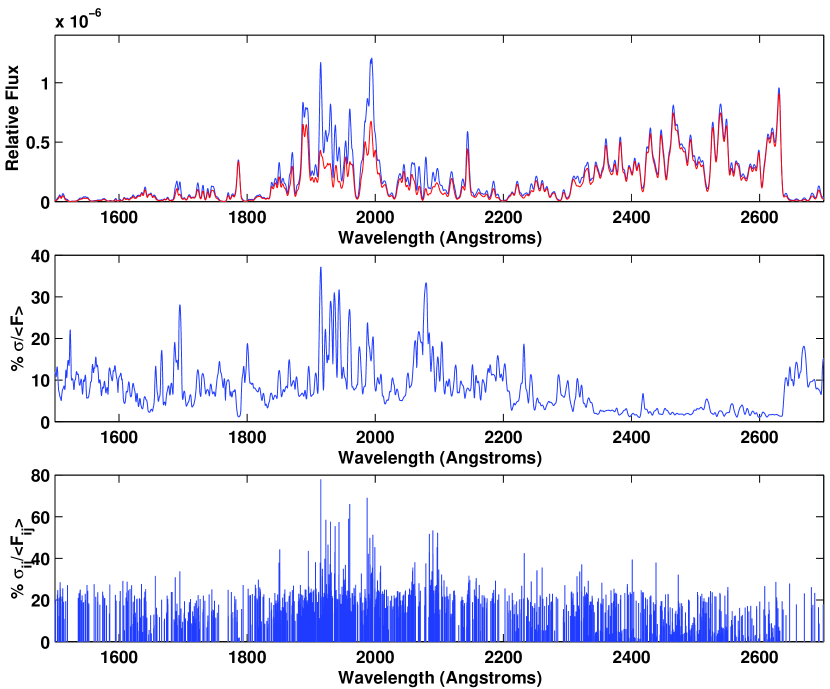
Figure 11 summarizes the uncertainties due to the atomic data uncertainties in Table 4 on the predicted Fe II-Fe III flux for model u13h11. This model BLR was chosen as it gave the best fit to the overall Fe II-Fe III flux levels in the Vestergaard & Wilkes template. Charge-exchange reactions between iron and hydrogen were included in this calculation, although assumed uncertain to within a factor of 10 (Table 4). The top panel displays the minimum and maximum predicted flux at each wavelength and the middle panel shows the standard deviation of each predicted flux expressed as a percentage of the average flux at that wavelength. The largest uncertainties approach 30% for the Fe III features near 2000 Å. This reflects mostly the scaling of the charge-exchange reaction rates which strongly affects the Fe II-Fe III ionization balance. Much smaller uncertainties are predicted for the bulk of the Fe II emission; this smaller uncertainty reflects, to some extent, the large number of individual Fe II transitions contributing to each wavelength in the broadened spectrum (see the bottom panel of Figure 11), each with an individually scaled uncertainty following Table 4. In light of this figure, the detailed discrepancies between the I Zw 1 template of Vestergaard & Wilkes and the computed model model shown in Figure 9 are mostly explained as uncertainties in the underlying atomic data.
9 Discussion
The primary aim of this continuing project is to incorporate advanced methods of non-LTE radiative transfer from stellar astrophysics into emission line analysis of AGN. In the current work, we have provided predictions for the entire low-ionization spectrum of iron, focusing on Fe III. Given the preliminary nature of the models, and the use of only single-zone BLR cloud models, a reasonable fit to the Fe II-Fe III UV template of Vestergaard & Wilkes for I Zw 1 was obtained.
An aspect in which our treatment is incomplete is in the detailed treatment of the Fe IV atom, the dominant ionization state in the fully ionized optically thin region of BLR models. The atomic data for Fe IV are in hand, computed from the Iron Project, and we plan to incorporate those into a further extension of the present work on par with Fe II and Fe III. The Fe IV lines may also contribute to UV spectra of BLR; for example, see observations of the Orion nebula using HST (Rubin et al. 1997).
In addition, the Å feature in the computed and observed Fe III spectra offers a diagnostics of atomic processes and physical conditions and of uncertainties in atomic data. The combined role of these factors in determining the intensity of this emission feature may be illustrated by considering level-specific recombination. An increase in the recombination-cascade rates might lead to: (a) less of a role for charge-exchange, as inferred by the non-charge-exchange models, (b) enhancement of the feature due to recombination contribution to the Fe III line, and (c) less flux in Fe II short-ward of Å, consistent with observations. The present recombination rates were derived from level-specific photoionization cross sections of Fe III computed in LS coupling (Nahar & Pradhan 1994). Later work has shown (Pradhan, Nahar & Zhang 2001, Nahar & Pradhan 2003) that near-threshold resonance complexes may affect the recombination rates by up to several factors. It is necessary to consider relativistic fine structure and resolve the resonance complexes in great detail (excited metastable state cross sections are affected much more than than the ground state). Nahar & Pradhan (2003) have developed a scheme for unified calculations of electron-ion recombination, including both the radiative and the dielectronic recombination processes. Such level-specific calculations for total recombination into the Fe III levels may possibly resolve the discrepancy in the observed and computed intensities of the Å feature.
It is therefore not an exaggeration to say that in spite of the present scale of this effort, both in terms of atomic physics and radiative transfer, considerable work is still needed to improve the models.
References
- (1)
- (2) Baldwin, J. A., Ferland, G., Korista, K, & Verner, D. ApJ 455, L119
- (3)
- (4) Baldwin, J. A., et al. 1996 ApJ 461, 664
- (5)
- (6) Bautista, M. A., & Pradhan, A. K. 1997 A&A Supp. Ser. 122, 167 (IP.XX)
- (7)
- (8) Bergeron, J., & Knuth, D. 1980 A&A 85, L11
- (9)
- (10) Boroson, T. A., & Green, R. F. 1992 ApJS 80, 109
- (11)
- (12) Collin-Souffrin, S., Joly, M., Pequignot, D., & Dumont, S. 1986 A&A 166, 27
- (13)
- (14) Collin-Souffrin, S., Hameury, J.-M., & Joly, M. 1988 A& A 205, 19
- (15)
- (16) Dumont, A. M., & Collin-Souffrin, S. 1990 A&A 229, 313
- (17)
- (18) Ekberg, J. O. 1993 A& A Suppl. Ser. 101, 1
- (19)
- (20) Elitzur, M., & Netzer, H. 1985 ApJ 291, 464
- (21)
- (22) Ferland, G. J. 1991 HAZY: An Introduction to CLOUDY, OSU Internal Report 91-01
- (23)
- (24) Flower, D. 1990 Molecular Collisions in the Interstellar Medium (Cambridge University Press: Cambridge)
- (25)
- (26) Graham, M. J., Clowes, R. G., & Campusano, L. E. 1996 MNRAS 279, 1349
- (27)
- (28) Hartig, G. F., & Baldwin, J. A. 1986 ApJ 302, 64
- (29)
- (30) Hummer, D. G., Berrington, K. A., Eissner, W., Pradhan, A. K., Saraph, H. E., & Tully, J. A. 1993 A&A 279, 298 (IP.I)
- (31)
- (32) Johansson, S. & Jordan, C. 1984 MNRAS 210, 239
- (33)
- (34) Joly, M. 1993 Ann. Phys. Fr. 18, 241
- (35)
- (36) Kingdon, J. B., & Ferland, G. J. 1996 ApJS 106, 205
- (37)
- (38) Kurucz, R. L. 1992
- (39)
- (40) Kwan, J.K., Cheng, F., Fang, L., Zheng, W., & Ge, J. 1995 ApJ 440, 628
- (41)
- (42) Kwan, J. K., Krolik, J. H. 1981 ApJ 250, 478
- (43)
- (44) Laor, A., Jannuzi, B. T., Green, R. F., & Boroson, T. A. 1997 ApJ 489, 656
- (45)
- (46) Mathews, W. G., & Ferland, G. J. ApJ, 323, 456
- (47)
- (48) Nahar, S. N. 1995 A&A 293, 967 (IP.VII)
- (49)
- (50) Nahar, S. N. 1996 Phys. Rev. A 53, 1545
- (51)
- (52) Nahar, S. N., & Pradhan, A. K. 1994 J. Phys. B: Atom. Molec. Opt. Phys. Letters 27, 429
- (53)
- (54) Nahar, S. N. 2003 “The Iron Project and Non-LTE stellar modelling”, in ASP Conference Series 288, Stellar Atmosphere Modelling, I. Hubeny, D. Mihalas, & K. Werner (eds), (ASP: California), 651
- (55)
- (56) Nahar, S. N., & Pradhan, A. K. 1996 A& A Suppl. Ser. 119, 507 (IP.XVII)
- (57)
- (58) Nahar, S. N., & Pradhan, A. K. 2003 Self-Consistent R-matrix Approach To Photoionization And Unified Electron-Ion Recombination, in Radiation Processes In Physics and Chemistry, Elsevier (in press), astro-ph/0310624
- (59)
- (60) Netzer, H. 1980 ApJ 236, 406
- (61)
- (62) Netzer, H. 1990 Saas-Fe Advanced Course 20, Active Galactic Nuclei, T. J.-L. Courvoisier & M. Mayor eds., (Heidelberg: Springer), 57
- (63)
- (64) Netzer, H., & Wills, B. J. 1983 ApJ 275, 445
- (65)
- (66) Neufeld, D. A., & Dalgarno, A. 1987 Phys. Rev. A, 35, 3142
- (67)
- (68) Mihalas, D. 1978, Stellar Atmospheres (2d ed.; San Fransisco: Freeman)
- (69)
- (70) Pelan, J., & Berrington, K. A. 1997 A&A Supp. Ser. 122, 177 (IP.XXI)
- (71)
- (72) Penston, M. V. 1987 MNRAS 229, 1P
- (73)
- (74) Peterson, B. M., Pogge, R. W., & Wanders, I. 1999 Emission-Line Profile Variability, in “Structure and Kinematics of Quasar Broad-Line Regions”, C. M. Gaskell, W. N. Brandt, M. Dietrichm D. Dultzin-Hacyan & M. Eracleous (eds), ASP Conference Series 175
- (75)
- (76) Pradhan, A.K. Nahar, S. N., & Zhang, H. L., 2001, ApJ 549, L265
- (77)
- (78) Press, W. H., Teukolsky, S. A., Vetterling, W. T., & Flannery, B. P. 1992, Numerical Recipes (Cambridge University Press: New York)
- (79)
- (80) Rodríguez-Ardila, A., Viegas, S. M., Pastoriza, M. G., & Prato, L. 2002 ApJ 565, 140
- (81)
- (82) Rubin, R. H., et al. ApJ 474, L131
- (83)
- (84) Rudy, R. J., Mazuk, S., Puetter, C., & Hamann, F. 2000 ApJ 539, 166
- (85)
- (86) Rudy, R. J., Lynch, D. K., Mazuk, S., Venturini, C. C., Puetter, C., & Hamann, F. 2001 PASP 113, 916
- (87)
- (88) Rybicki, G. B., & Hummer, D. G. 1991 A&A 245, 171
- (89)
- (90) Rybicki, G. B., & Hummer, D. G. 1992 A&A 262, 209
- (91)
- (92) Sigut, T. A. A. 1996 ApJ 473, 452
- (93)
- (94) Sigut, T. A. A. & Pradhan, A. K. 1998, ApJ 499, L139 (SP98)
- (95)
- (96) Sigut, T. A. A. & Pradhan, A. K. 2003, ApJS 100, 100 (SP03)
- (97)
- (98) Van Regemorter, H. 1962 ApJ 136, 906
- (99)
- (100) Véron-Cetty, M.-P., Joly, M., & Véron, P. A&A 2004, astro=ph.0312654
- (101)
- (102) Verner, E. M., Verner, D. A., Korista, K. T., Ferguson, J. W., Hamann, F., & Ferland, G. J. 1999 ApJS, 120, 101
- (103)
- (104) Vestergaard, M., & Wilkes, B. J. 2001 ApJS 134, 1
- (105)
- (106) Wills, B.J., Netzer, H., Uomoto, A. K., & Wills, D. 1980 ApJ 237, 319
- (107)
- (108) Wills, B. J., Netzer, H., & Wills, D. 1980 ApJ 241, L1
- (109)
- (110) Wills, B. J., Netzer, H., & Wills, D. 1985 ApJ 288, 94
- (111)
- (112) Zhang, H. L., & Pradhan, A. K. 1995 A&A 293, 953 (IP.VI)
- (113)
- (114) Zhang, H. L. 1996 A&A Supp. Ser. 199, 523 (IP.VXIII)
- (115)
| Atom | Number of | Number of rbb |
|---|---|---|
| NLTE Levels | Transitions | |
| Fe i | 77 | 185 |
| Fe ii | 285 | 3892 |
| Fe iii | 581 | 10885 |
| Fe iv | 1 | 0 |
| Total | 944 | 14962 |
| Label | |||
|---|---|---|---|
| u13h96 | |||
| u13h11 | |||
| u20h96 | |||
| u20h11 | |||
| u30h96 | |||
| u30h11 |
| Model | %Fe I | %Fe II | %Fe III | |
|---|---|---|---|---|
| Solar abundance, | ||||
| u30h96 | 0.3 | 96.3 | 3.4 | |
| u30h11 | 2.9 | 88.8 | 8.3 | |
| u20h96 | 0.2 | 94.5 | 5.4 | |
| u20h11 | 3.3 | 81.9 | 14.8 | |
| u13h96 | 0.2 | 94.1 | 5.7 | |
| u13h11 | 1.2 | 63.1 | 35.7 | |
| Solar abundance, | ||||
| u30h96 | 0.3 | 95.9 | 3.9 | |
| u30h11 | 2.1 | 92.9 | 5.0 | |
| u20h96 | 0.1 | 94.8 | 5.1 | |
| u20h11 | 1.5 | 89.1 | 9.4 | |
| u13h96 | 0.1 | 95.2 | 4.7 | |
| u13h11 | 0.5 | 74.3 | 25.2 | |
| 3 x Solar abundance, | ||||
| u30h96 | 0.3 | 96.7 | 3.0 | |
| u30h11 | 2.9 | 87.0 | 10.0 | |
| u20h96 | 0.2 | 94.6 | 5.2 | |
| u20h11 | 4.8 | 76.8 | 18.4 | |
| u13h96 | 0.3 | 93.9 | 5.9 | |
| u13h11 | 1.9 | 55.1 | 43.0 | |
Note. — The total flux, in , is for Å. Columns (3) through (5) give the percentage contribution of each iron ion to the total flux. The models are identified as in Table 2. The notation means .
| Type | Atomic Parameter | Uncertainty | Notes |
|---|---|---|---|
| rbb | R-matrix | ||
| rbb | semi-empirical | ||
| rbf | R-matrix | ||
| cbb | R-matrix | ||
| cbb | Gaunt Factor approx. | ||
| cbf | Seaton approx. | ||
| cex | Landau-Zener approx. |
Note. — (a) The uncertainty is denoted in the text. (b) The recombination rate to each individual level is related to the photoionization cross section (rbf) through the Einstein-Milne relation.